
Creating an in-house ’omics data portal using EBI Atlas software
Abstract:
The amount of public gene expression data has dramatically increased in recent years. This has resulted in several efforts to curate and make accessible this huge amount of public data in a useful and easy to use way. One such project, the European Bioinformatics Institute’s Gene Expression Atlas, led to the development of a portal that was intuitive to use and yet still incorporated sophisticated queries and statistical analysis results. The authors describe how the public Atlas project was adapted to become a standalone product, which can be installed anywhere. This Atlas allows both private companies and public institutes to develop in-house data portals.
9.1 Introduction
Within the pharmaceutical industry, there is an ever increasing amount of biological data being generated. Much of this data is from the ’omics disciplines such as transcriptomics, proteomics and metabolomics. The most prevalent of these is transcriptomics, with a mountain of public data available and increasing amounts generated within companies. To process, analyze and interpret this data requires sophisticated software, which is available both as open source packages and also several vendor solutions. To date, most of the work in developing software has focused on processing, analytics and storage of the data. This software has a high learning curve and is not easily accessible without training. Within the environment of a large pharmaceutical company, we saw a need to create a portal where users could browse and query ’omics data sets, in an easy to use way using just a web browser. This would enable a whole new category of users to access the data and make sense of it, and hopefully use it in day-to-day scientific decision making. The solution should also complement existing ’omics infrastructure rather than replace it. Here, we describe how we have adapted the European Bioinformatics Institute (EBI) Gene Expression Atlas software (the Atlas), which was developed for a similar purpose, into a standalone product that can be deployed within a company firewall. This in-house installation of the Atlas allows loading of public and internal data sets, and gives scientists access to these data sets in a nice easy-to-use interface. First, we give an overview of how ’omics data is used in the drug industry today, and the motivation for building a portal. Next, we detail the process of adapting Atlas from an existing public web site into an installable standalone piece of software. Finally, an overview of deploying and running the portal within a large company will be described.
9.2 Leveraging ’omics data for drug discovery
9.2.1 ’omics data is used throughout the drug discovery and development pipeline
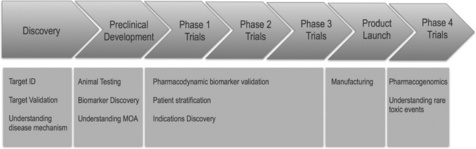
The use of ’omics data within drug discovery has increased in recent years in particular gene expression profiling using transcriptomics [1]. In the past it was used in pre-clinical studies to understand drug action, animal models of disease and also to understand toxicology. Later, ’omics studies utilizing human samples became more prevalent, and this is now done in all phases of the drug discovery and development pipeline (see Figure 9.1). In the early phase of discovery, a typical scenario is to look for differences in expression between normal and diseased tissue (both in humans and in animals), to discover new potential targets for therapeutic intervention [2]. It is also common at this early stage to look at gene expression following compound treatment in cell lines to discern patterns and signatures of mode of action. These can later be utilized to discover interesting connections between drugs and disease [3].
In the later phases of drug discovery, ’omics data can be utilized for biomarker discovery and also increasingly to stratify patient populations. A typical scenario is using pre-clinical species or cell line-based studies to identify biomarkers using the lead compound, and then moving into the clinic to validate the best candidate marker(s) to use in later trials. A crucial application of a biomarker is to find the optimum efficacious dose in humans, which in the past, was usually done by estimating downwards from the maximum tolerated dose. This is not always the best approach, as sometimes the maximum tolerated dose is not reached, so the best dose may be much lower resulting in a safer drug. Many different ’omics technologies can be utilized for biomarker discovery (see [4]), and there is an increasing need for software that can integrate data from multiple technologies.
There is also now an acute understanding that to truly treat human disease, it is critical to study the disease as much as we can in humans. Therefore, there is a large effort to do deep molecular profiling of human diseased samples, to gain a better understanding of disease pathophysiology. Furthermore, it is important to also know target expression and distribution in normal tissues to understand how the drug will act on the body and to highlight any potential side effects early on. It is therefore crucial that not only computational experts, but also discovery bench scientists, clinicians, drug metabolism and pharmacokinetics (DMPK) scientists and toxicologists can easily access and interpret this type of data.
9.2.2 The bioinformatics landscape for handling ’omics data
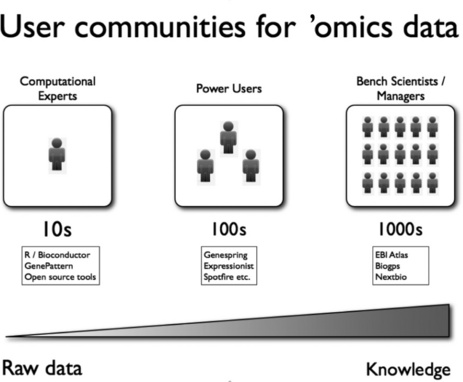
The basic pipeline for analyzing and interpreting ’omics data starts with raw data files and ends with some kind of knowledge. In between, we have data QC, data reduction, analytics, annotation and interpretation and perhaps a whole host of other smaller steps. This results in a large landscape of bioinformatics applications, which cater to the various steps in the data pipeline. We can break down the users of these applications into three crude bins. The first are the computational experts who are familiar with programming and can script highly custom code to process complex data sets. These users usually use open source solutions, although they are also very savvy with the vendor tools out there. Second, there are the power users, who include computational biologists who do not know how to program and also computationally adept scientists who are willing to learn complex software. These users tend to work on this kind of data a lot, and use tools such as Genespring and Expressionist routinely for project data analysis and support. They tend to work on one data set at a time, and are less concerned with mining across a large compendium of data. Hence, the solutions in this space tend to be very project-focused and are great at getting useful knowledge from one data set. The last category of users are the average bench scientists and managers. They do not have time to learn a lot of complex software, and need to know the answers to simple questions. They want to make queries on data that have already been generated and analyzed either inside or outside the company. They want to verify what those data mean, and be presented with the data in a form that can be easily interpreted such as a graphical output. These user communities are summarized in Figure 9.2, along with some typical applications that cater for each community.
9.2.3 Requirements for an ’omics portal
The EBI Gene Expression Atlas was constructed as a large-scale portal for publicly available functional genomics data. Public domain ’omics data sets originate from a variety of sources; the ArrayExpress Archive of Functional Genomics contains data sets performed on more than 5000 different platforms coming from hundreds of different laboratories. Naturally, raw data come in a great variety of formats, whereas metadata, that is experiment description representation can be highly idiosyncratic, oftentimes incomplete or even missing. Significant efforts have been undertaken in recent years to bring this situation under control; establishing the Minimal Information About a Microarray Experiment (MIAME) [5] and the Minimum Information about a high-throughput SeQuencing Experiment (MINSEQE) [6] standards for microarrays and NGS experiments and a common data exchange format, MAGE-TAB [7].
In order to create a useful ’omics portal, two additional steps are needed beyond aggregation of standards-compliant data:
1. curation towards a commonality of experimental descriptions across all available data; and
2. statistical analysis enabling queries over the entire curated data collection.
Curation is a part-automated, part-manual process, the aim of which is to prepare data for meaningful downstream analysis, by ensuring data completeness and correctness and mapping free-text descriptions to controlled vocabularies, or ontologies. In bioinformatics, ontologies are used widely to model knowledge of various domains: the OBO Foundry [8] and NCBO BioPortal [9] host between them more than 300 ontologies for describing things as diverse as medical terms for disease and loggerhead turtle nesting behaviors. The Experimental Factor Ontology (EFO) [10] was created at the EBI specifically to describe ’omics experiments and is used widely in the curation and data analysis process. It is described in detail in [11].
The EBI Atlas is constructed primarily for transcriptomics experiments. In these data sets, one of the aspects of curation is to identify and mark experimental variables being tested, for example disease, tissue, cell type or drug response, and map these terms to the EFO hierarchy uniformly. Once the terms are identified, statistical analysis is performed automatically to identify significantly differentially expressed elements in the transcriptome (e.g. genes, their transcripts, microRNA). The statistical framework is described in [12].
In addition to these browsing requirements, which serve the majority of the bench user community described in Figure 9.2, it is also useful to have the ability to process the curated data sets using more sophisticated algorithms, which are not pre-computed automatically for all data and may be thought of at a later date. To serve this purpose, the data in the ’omics portal must be accessible through programmatic APIs in order to automate data processing using other algorithms. The EBI Atlas software again deals with this in an elegant way, by storing the data in self-describing and accessible NetCDF format [13] files, and also providing RESTful APIs to the curated data sets, as described in the next section.
9.3 The EBI Atlas software
The Atlas was constructed to provide a simple, easy to use and understand interface to the computed statistics. As such, the requirements are to be able to query by gene, including any of its attributes such as synonyms, protein domains, pathway and process annotations, or by curated experimental variable, or both. Expecting the user to be unfamiliar with the statistical underpinnings of the analysis, simple summaries of up-/ down-expression patterns are provided: for each gene, the number of public data sets is reported where it is over-or under-expressed, color-coded red and blue, respectively. More sophisticated users can create more complex queries and drill down to individual data points underlying the analysis results.
Figure 9.3 presents a selection of results for the search for members of the EGFR signaling pathway differentially expressed in carcinomas. Genes are in rows, ranked by the number of found studies, and columns provide a view of EFO carcinoma hierarchy. The numbers in dark/light squares indicate numbers of studies with differential expression.
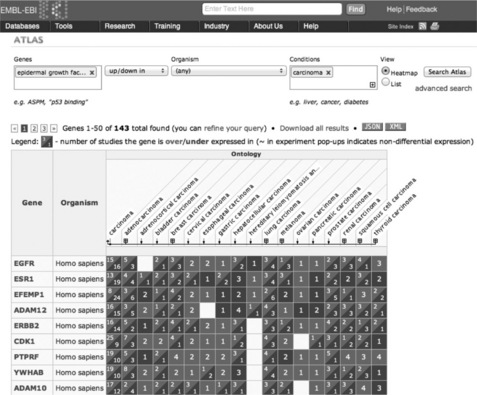
Bioinformaticians and computational biology researchers often need direct access to the data and analysis results, bypassing the graphical user interface. For such users, extensive application programming interfaces (APIs) are provided, enabling them to extract data from the Atlas as XML or Javascript Object Notation (JSON) feeds. Every result page has a JSON and XML button providing direct access to these data feeds.
9.3.1 Adapting Atlas for the real (internal) world
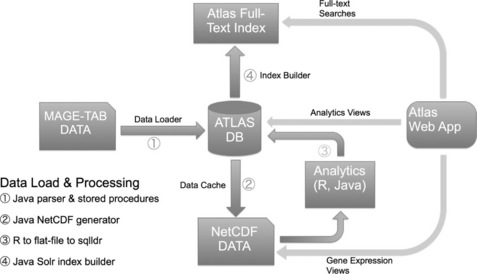
In order to adapt the EBI Atlas to standalone deployments, we undertook a significant engineering effort. The greatest effort was devoted to simplifying the underlying data model and creating a new framework for loading data. The overall architecture is described in Figure 9.4 below.
9.3.2 Simplifying the data model
To simplify maintenance and data administration, we moved from a highly formalized data structure, where every attribute was encoded explicitly as a separate set of tables, into a more lightweight data model, fewer than 30 tables in total. This also allowed us to simplify greatly the data loading procedure, going almost directly from MAGE-TAB parser objects to Atlas data objects and then to the relational database. The database itself does not store the raw data or analytics: these are stored in NetCDF format [13] files and accessed directly by the web application and R-based analytics. These NetCDF files are also available for power users to access via R scripts, if they need to do more sophisticated processing of the raw data.
9.3.3 Building an easy to use installation procedure
The original Atlas was not meant to be installed anywhere except at the EBI. This meant there were a number of dependencies on existing infrastructure. We developed a regular software and data release procedure, together with detailed documentation. To install the standalone Atlas, two files are downloaded – a web application and a data archive. The data archive contains an installer, which unpacks the files and loads them automatically into the specified database. The web application contains an administration interface with configuration options and data loading interface. We can release incremental updates to the data archive, and update an Atlas installation without re-installing the database.
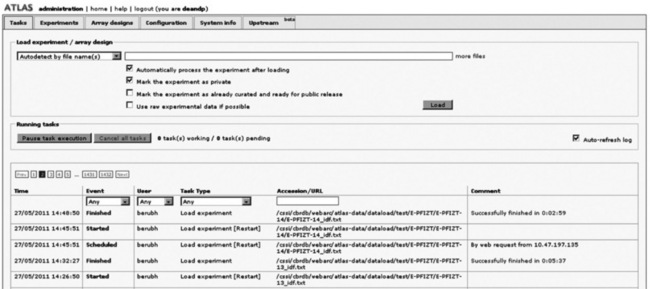
9.3.4 Creating a new administration interface for loading data
A completely new administration interface was developed, as shown in the figure below. This interface allows the Atlas administrator to load and unload experiments, update data and analytics, and manage various configurable options of the software, for example custom branding templates and external database/cross-reference links.
9.3.5 Future enhancements
As Atlas matures into a larger platform for transcriptomics data, we have started to expand its scope from microarrays towards other ’omics data types – first of all, high-throughput sequencing-based, or next-generation sequencing (NGS), transcriptomics. To this end, we developed a pipeline, ArrayExpressHTS [14], for processing NGS data sets from raw reads to quantified transcript isoform expressions, and have been working on integrating it into the Atlas. NGS data, RNA-Seq, and ChlP-Seq will be a key focus for future Atlas developments.
The amount of data in the public Atlas has grown more than sixfold since its start in 2009 and we are seeing that for a growing number of experiments our statistical approach may not be best suited. We must turn our attention now to method development: in particular, we are gradually switching to using raw data wherever possible and reprocessing these data for best standardization and comparability, and we are working with other groups to incorporate advanced gene set-based statistics into our pipeline.
Lower costs and technological barriers have made possible two comparatively new kinds of experiments: large meta-analysis experiments, such as the global map of human gene expression (Atlas experiment ID: E-MTAB-62) and large reference experiments such as the Illumina Body Map 2.0 data set (E-MTAB-513). These experiments call for different statistics and visualization approaches entirely, and the Atlas team have started work on making this possible.
9.4 Deploying Atlas in the enterprise
9.4.1 Rationale and requirements for an ‘in-house’ Atlas
The EBI public Gene Expression Atlas web site has proven to be a valuable resource for mining public expression data. Having an ‘in-house’ installation of the system provides the added advantage of combining internal, proprietary data with the public content in one easy to use system. Furthermore, an internal system can be customized and extended and may also be integrated with other internal systems.
An open source system will typically have a shorter release cycle than most commercial systems and is likely to require some additional testing. Therefore, it is highly desirable to have a research computing environment where databases, data files and applications can be deployed without a formal change control processes. Pfizer Research Business Technology supports global and local computational biology groups with an application hosting environment that uses a hybrid support model where system management and configuration are under the control of the data center platform and operations teams using standard processes. Applications are deployed using non-privileged service accounts used by a deployment team. Databases are managed in a similar fashion, using an Oracle instance backed-up and managed by the corporate database operations team. A local representative in the application support group has system privileges enabling them to create, extend, and tune the Atlas database. These environments are used to support both test and quasi-production environments, enabling new releases to be evaluated offline and quickly released for general use after testing and evaluation.
9.4.2 Deployment and customization of the Pfizer Gene Expression Atlas
Deployment of the standalone Atlas follows procedures provided by the EBI Atlas team. The database file is downloaded and deployed on a Oracle server (Oracle version 11.2) supporting research class applications. Typically, two environments are supported as described in the previous section. The netCDF data files and indexes are managed on general NAS filers that are available to the application hosts, this is where the bulk of the data resides (the database size is small being a few GB). The Tomcat web application is deployed on an Enterprise Red Hat Linux system, (HP Proliant DL 580 with 4 CPUs and 64 GB memory) running under a locally installed Java Runtime Environment.
A corporate system that includes proprietary data should have access control. In the Pfizer deployment, login and authentication was implemented by developing a standard J2EE-based request filter that integrates with a single sign-on system used throughout the company. The filter class and supporting libraries are simply installed to Tomcat’s standard directories for shared libraries or classes. The filter is referenced in the web application deployment file, so no custom extensions or modifications are required.
A couple of minor extensions have been developed to date to facilitate the Pfizer deployment. First, it was desired to add a corporate logo to the in-house installation to distinguish the site from the public Atlas. This was done initially through modification of an application JSP page. The EBI Atlas team then developed a template model that allows the site to be ‘branded’ for local installations without modification of source code. A minor code change has also been implemented to facilitate capturing of application usage metrics, so code for the system is currently obtained from the source-code control system supporting the open source project and used to compile a custom build containing the local customizations.
9.4.3 Loading custom and private data sets into the in-house Atlas
Although the EBI public Atlas contains thousands of curated public experiments, the wealth of public data submitted historically and currently will require local curation to include additional studies of interest. In addition, public and private research institutions will have access to internally generated and proprietary data to add to their local Atlas installation. Therefore, an institution interested in setting up an in-house Atlas instance will want to consider workflow and resource for curation of internal data. The Pfizer installation of Gene Expression Atlas has been supplemented with public studies of interest to scientists and clinicians supporting oncology research. Around 50 studies of interest were selected based on key cancer types, treatments or systems of interest to the research unit. Although a number of these studies were found to be in the public Atlas, the remaining studies where expression data and meta-data were available from public sources were curated in-house.
Atlas includes an administrative utility page that allows experiments to be loaded in MAGE-TAB format, which is the preferred format for data submission to the EBI Array Express database. The MAGE-TAB Sample and Data Relationship Format (SDRF) file allows specification of characteristics describing sample properties. These typically include general properties of samples that may hold for all samples in the experiment (such as tissue type) as well as factors under study, such as treatment or clinical outcome. In addition, the Experimental Factor identifies the primary variables of interest in the study, and these variables are used to drive the analytics in Expression Atlas.
Many of the public studies submitted to Array Express specify the key sample and experiment meta-data through Comment or Characteristics fields in the SDRF file. So for these types of studies, study curation can be achieved by formatting or transforming the key variables of interest as Experimental Factors in the SDRF file. Once these files are parsed and validated by the Atlas loader, the analytics workflow is automatically triggered to identify genes having significant association with the variables identified. A number of public studies include only some of the meta-data for the experiment, or even none at all! In these cases, original publications or other online resources have to be consulted, and data curation becomes more time-consuming or problematic.
One approach to loading internal data would be to export local expression studies of interest in MAGE-TAB format [7] for loading by the sample loader. This has proven to be feasible, although some manual curation is still required to identify the key experimental factors in a given study and to map meta-data terms used on local systems to the Experimental Factor Ontology used in the Expression Atlas. If all data for a given public or internal study are available in electronic format, curation of a typical experiment having 20–50 samples can generally be accomplished in an hour or two. Studies requiring re-entry of data from publications or other non-electronic sources will require considerably longer to properly curate, if, in fact, the meta-data can be obtained. Of course, a number of other more general considerations of quality have to be taken into account when entering internal and external studies, including experimental design and quality of samples and data files. Installation, operation, and support of a local Atlas installation has proven to be very feasible and is certainly a cost-effective option to consider. Supplementing internal data has also proven to be feasible and worthwhile. As will be discussed in the next section, efforts to reduce the amount of manual curation in data entry are under active development.
9.4.4 Next steps and future considerations for an in-house Atlas
Manual curation of experimental meta-data for custom studies has proven to be feasible, but this is certainly not a high-value activity for in-house resource and is prone to human error. It would be highly desirable to map standard terms used for annotation of in-house data with the EBI EFO. Better yet, the EFO could be used in systems to capture experiment and sample meta-data so that data are complete and captured in a standardized format from the start! As the EFO is inherently dynamic, update and exchange mechanisms would be highly desirable to bring in new terms of general interest such as standard strain, cell line and treatment names.
As described above, public studies of interest to Pfizer have been curated in-house and loaded into the local Atlas. Although this activity adds value, it is likely to be of pre-competitive value to Pfizer and other commercial entities. Therefore, it would be of mutual benefit to public and private institutions having local installations to be able to publish locally curated public studies back to the public Atlas, subject to review of curators of the public Atlas. As a considerable portion of the available public expression data is currently uncurated, it would be mutually beneficial for the Atlas community to consider a one-time effort to review and curate all public studies meeting a defined quality standard. Such a project would benefit commercial and non-commercial partners alike, and it would be fitting to have an open source software system developed to share public expression data contribute to an open science model for gene expression and other ’omics data.
9.5 Conclusion and learnings
The open source EBI Atlas platform has proven to be a great project to bring curated expression studies into an easy to use portal system for scientists. Initial analysis of a gap in vendor solutions in this area pointed to either developing an in-house portal or adapting open source code. In collaborating with the Atlas team, a great deal of expertise in curation and data management of a large collection of gene expression data has been gained, while at the same time developing a usable prototype that serves as a proof-of-concept for future development. There were several learnings we can take away from this experience.
The first is the importance of data curation to the development of a useful portal. The EBI Atlas uses an ontology to control terms used in data curation of the various gene expression studies contained therein. This ontology make the data searchable in a semantically meaningful way, and also opens the door for using other algorithms which can understand semantics to be deployed later onto this large collection of data. One example is that we could go through the entire data collection and generate signatures of gene changes between normal and various disease states. Once the signatures have been computed, a gene set enrichment analysis [15] could be performed on each disease state to reveal pathways involved in particular diseases. Being able to make a query, for example, like ‘Find all genes upregulated consistently in breast cancer’ and then combining it with other data such as drug target databases would also be a very powerful use of this kind of semantically aware data. Of course this is a great experience when all the data are curated by subject matter experts, but what about in-house legacy data sets? It is difficult to get consistent annotations and curations of these data sets where in many cases the original scientists may have left the company a long time ago. It is also helpful to have good user-friendly tools to enable easy curation of experimental meta-data, and these are sorely lacking as yet. In this project, a combination of in-house bioinformatics expertise and computational biologists who are familiar with the subject matter (e.g. cancer) were a prerequisite to getting high-quality annotations. As stated above, we believe that for public data sets this could be a pre-competitive activity where one could outsource the data curation to experts and the work could be funded through a variety of organizations.
One of the other learnings in terms of collaborating with an open source project is that of the provision of support. Typically when dealing with a vendor, certain service levels of support and documentation to help us install, configure, and deploy a system such as the Atlas are expected. Even then, it is likely that there will be certain teething problems in going from a relatively open environment to a large controlled corporate data center. One of the essential components of a successful collaboration is good communications, and this was certainly the case here. The Atlas team was responsive and accommodating to our frequent requests for information and support. Had this not been the case, the project could have become very frustrating and difficult. It is also worth pointing out that in our initial agreement, we stipulated that the outcome of our collaboration would be free and open source, and that set the tone for an open collaborative relationship. It is important and worth stating that for corporations to make more use of open source software, they should also be willing to fund and contribute code to these efforts.
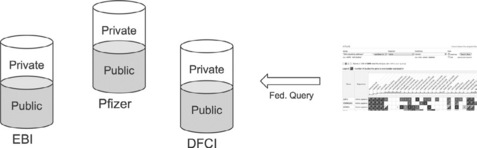
Finally, there is the learning in terms of ongoing maintenance of this standalone Atlas. We realized in setting up our own in-house version of this repository how similar our installation is to the public instance, and how with some tweaking we could move to more interesting models. One model is to have a federated solution whereby each institution could have their own Atlas repository, and that each repository would have a ‘public’ and ‘private’ portion (see Figure 9.6). The public portion of each repository could then be federated into the public instance, so that queries against that instance would also search all public repositories in the federation. This, however, does not solve the problem of maintenance, as each institute would still need to maintain their own individual installations and update them with patch releases as newer features are released.
Another model is the ‘cloud’ model where each institute hosts their separate installation in the cloud, but the infrastructure is maintained by one entity. Public/private firewalls would still exist but all data would be in the cloud, and the private data would be in a well-secured sandbox area within the larger cloud. This hosted solution has the advantage that maintenance of the infrastructure is no longer the problem of the individual institutes or companies, but that of the hosting provider. Furthermore, the institutes get instant updates and new features without having to implement patch releases and maintain in-house code and hardware infrastructure. If the system scales and has good security it is hard to argue that this would not be a boon for both companies and academic institutions. One common gripe of hosted solutions is the lack of direct control; for example what if you wanted to run your own algorithms on the data sets? A solution to this complaint is to build an easy to use yet comprehensive enough API to allow bioinformaticians and biostatisticians access to the data sets and annotations so that they can run these algorithms on the data sets in the cloud. We think that such a hosted solution is not only possible but is coming in the not-too-distant future.
9.6 Acknowledgments
The authors would like to thank the members of the Atlas Development team, namely: Tomasz Adamusiak, Tony Burdett, Aedin Culhane, Anna Farne, Alexey Filippov, Ele Holloway, Andrey Klebanov, Nataliya Kryvych, Natalja Kurbatova, Pavel Kurnosov, James Malone, Olga Melnichuk, Robert Petryszak, Nikolay Pultsin, Gabriella Rustici, Andrew Tikhonov, Ravensara S. Travillian, Eleanor Williams, Andrey Zorin, Helen Parkinson and Alvis Brazma. The authors would also like to thank Ami Engineer Khandeshi, Rajesh Molakaseema and Hugo Berube for their invaluable support of the Pfizer implementation. Thanks also to Lee Harland for critical review of the manuscript and helpful suggestions.
9.7 References
[1] Bates. The role of gene expression profiling in drug discovery. Current Opinion in Pharmacology. 2011.
[2] Yang, et al. Drug Discovery Today. 2009; 14(3–4):147–154.
[3] Lamb, et al. The Connectivity Map: using gene-expression signatures to connect small molecules, genes, and disease. Science. 2006; 313(5795):1929–1935.
[4] Classen, et al. Use of genome-wide high-throughput technologies in biomarker development. Biomarkers in Medicine. 2008; 2(5):509–524.
[5] http://www.mged.org/Workgroups/MIAME/miame.html.
[6] http://www.mged.org/minseqe/.
[7] Rayner, et al. A simple spreadsheet-based, MIAME-supportive format for microarray data: MAGE-TAB. BMC Btomformattcs. 2006; 7:489.
[8] http://www.obofoundry.org.
[9] http://bioportal.bioontology.org.
[10] http://www.ebi.ac.uk/efo.
[11] Malone, et al. Modeling Sample Variables with an Experimental Factor Ontology. Bioinformatics. 2010; 26(8):1112–1118.
[12] Kapushesky, et al. Gene Expression Atlas at the European Bioinformatics Institute. Nucleic Acids Research. 2010; 38(Database issue):D690–D698.
[13] http://www.unidata.ucar.edu/software/netcdf/.
[14] Goncalves, et al. A pipeline for RNA-seq data processing and quality assessment. Bioinformatics. 2011; 27(6):867–869.
[15] Subramanian, et al. Gene set enrichment analysis: a knowledge-based approach for interpreting genome-wide expression profiles. Proceedings of the National Academy of Sciences USA. 2005; 102(43):15545–15550.