
Squeezing big data into a small organisation
Abstract:
The technological complexity involved in generating and analysing high-throughput biomedical data sets means that we need new tools and practices to enable us to manage and analyse our data. In this chapter we provide a case study in setting up a bioinformatics support service using free and open source tools and software for a small research institute of approximately 80 scientists. As far as possible our support service tries to empower the scientists to do their own analyses and we describe the tools and systems we have found useful and the problems and pitfalls we have encountered while doing so.
11.1 Introduction
To paraphrase Douglas Adams, biological and medical data sets can be big, really big, I mean mind-bogglingly huge, and are only getting bigger. Recent years have seen an intimidating increase in the quantity of data collected in experiments performed by researchers across all fields of the medical and life sciences. As geneticists, genomicists, molecular biologists and biomedical scientists, we have seen the nature of our work transformed by huge advances in DNA sequencing, high-throughput drug discovery, high content screening and new technologies for fluorescence microscopy, but this transformation has come at a price. We have seen data costs plummet and yield grow at a rate of change in excess of that of the famous Moore's Law [1] (Figure 11.1), stretching the hardware and software we use to its limits. Dealing with these data is a truly mammoth task and contextualising the amount of data that must be handled for a new entrant to the field or a scientist with little or no informatics background is difficult; inevitably we end up talking about abstract quantities like terabytes (TB), which for most people, even technically minded people like scientists, has little connection to daily experience. As a more real yardstick for the quantities being produced, it is interesting to note that the United States Library of Congress aims to keep a copy of each written work in all languages. It carries about 15 TB of data in this form. In comparison, a single DNA sequencer such as the Illumina HiSeq 2000 can easily generate 55 000 000 000 nucleotides (55 gigabases) [2] of sequence in one day and would take only ten months to exceed the total written output in the Library of Congress, essentially the writings of the whole of humanity since the dawn of time. Given that there are many thousands of DNA sequencers and other high-throughput machines in active use across the world, then the word deluge does not even begin to describe the current data situation.
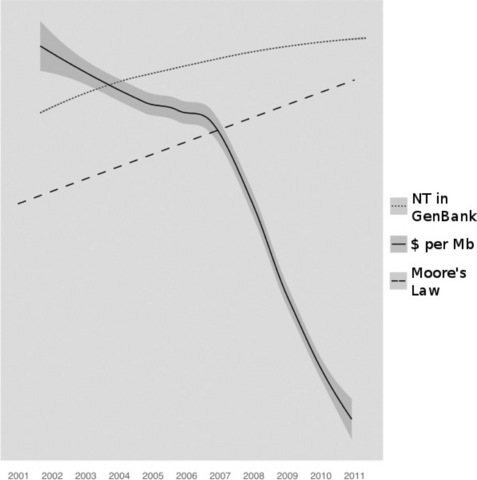
Figure 11.1 Changes in bases of sequence stored in GenBank and the cost of sequencing over the last decade. Series have been altered to fit on a single logarithimic scale. Change of number of nucleotides in GenBank is according to GenBank Release notes ftp://ftp.ncbi.nih.gov/genbank/gbrel.txt. Cost of sequence per MB according to NHGRI at http://www.genome.gov/sequencingcosts/
The human and monetary resources that bioinformatics departments and core services can call on to deal with the data are being stretched ever thinner as the number of projects that make use of these technologies in their departments increases. To add to this difficulty, even if budgets could be stretched to employ more people there is currently a short-fall in the number of qualified bioinformaticians in the job market who can carry out the required analyses. There is not likely to be a change in this situation very soon so it is necessary that service providers and research groups find a way to prioritise the many challenges they face and apply the resources that they have to 'work smarter'. The wide range and flexibility of free and open source tools available now provide a great opportunity for us to create environments and pipelines with which we can tackle the data deluge. In this case study we shall describe how our small core bioinformatics service has implemented a service model that is more scalable and adaptable than previously extant schemes by making use of free and open source software.
11.2 Our service and its goals
The Sainsbury Laboratory (TSL) [3] is a part publicly, part privately funded research institution that concentrates on cutting-edge basic and translational research into plant and pathogen interactions. Conceived by Lord Sainsbury, the former UK Science Minister and funded by The Gatsby Charitable Foundation [4], TSL is a focussed laboratory of about 80 scientists in five research groups. The bioinformatics group was created in 2003 and had expanded to its current size of two full-time members by 2006 when we took delivery of our first Illumina Genome Analyzer (GA) Next Generation DNA sequencing (NGS) machine, since upgraded to GAII and we have expanded with multiple mass spectrometers and an Opera High Content Imaging System. All our high-throughput projects occur continuously, at time of writing we are working on 16 genomics projects concurrently, with 20 people on these projects. Projects can run over 1–3 years (or more) being the main focus of a post-doc's project perhaps because a new model organism needs to have a comprehensive set of genomic resources, or it can be a small component because we need to do a new RNAseq gene expression analysis with an existing model organism. Typically, our workflows would involve going from raw sequence reads to generating a rough draft assembly, which we would annotate de novo or with RNAseq methods or using NGS sequence to identify SNPs in both model or non-model species, which would be verified in the laboratory and developed into markers for disease resistance. We use our new models in genomics analyses including comparative genomics, the genes we predict will be classified and certain important domains and signatures identified to create candidates that may confer disease or resistance to disease for further lab testing.
The hardware we use is sufficient to cover the needs of a group of our size, given our wide interests. Our computer systems comprise 21 TB 'live' storage on a mirrored NetApp [5] device (aside from a substantial archive for older data) with 22 compute nodes with 2–16 processor cores each and from 8 GB up to 128 GB onboard RAM, these all run Debian 6.0. Our bioinformatics service has maintained its small size throughout this period of expansion and our raison d'etre is to provide the rest of TSL with the knowledge, expertise and facility to carry out the bold research that is their remit. Our philosophy on how we carry out this provision has shifted over this period, from being a primarily reactionary on-demand service to being a scalable, department-wide initiative to create a culture of informatics knowledge, that is to bridge the somewhat false gap between the bench scientist and the bioinformatician.
We consider that a successful bioinformatics team helps the department best by ensuring that whatever the biological question or source of the data we are able to continually understand, manage and analyse the data. We take responsibility for providing the bench scientist with the skills and tools to carry out analyses much more independently than in a reactionary service model. We have found that we can execute the bioinformatics work for at least as many projects as we have scientists (not just as many as can be handled by two core informaticians). In this context a large part of the job comes in facilitating that exercise. Partly this is through training – much in the manner that a post doc would look after a new graduate student, rather than very formal tutoring – but mostly through structuring the data and tool organisation so that the biologist does not need to think too much about the computer administration side of the deal and can think about the data and the biological question alone. There are a great deal of free and open source tools that can be applied to this end.
11.3 Manage the data: relieving the burden of data-handling
Much of our data is generated internally on our high-throughput sequencer and image analysis machines, which send the raw data straight to the large central storage device. Actually getting at and using large data sets on a local machine so that they can be analysed in any sort of software is often much more of a trial than we would want it to be. Typically, something like FTP is used to copy the files over a network from some central filestore to the machine with the analysis software. FTP clients and command-line transfer can be powerful but cumbersome, result in unnecessary copies of the file and, often, the biologists are unaware of the concepts required to understand the transfer (it can often be surprising to an informatician how little a typical biologist knows of the nuts and bolts of dealing with computer systems). It is much more practical to integrate the data and transfer as far as possible with the client machine's operating system, and although Windows and Mac OS do provide some functionality for this, they are not much better than FTP programs. Instead we have made use of user space file system drivers, which allow a user to connect to an external filesystem without additional privileges to their machine or the remote machine/filesystem. In this way we have been able to make our central file store accessible to the desktop environment as if it were any other mounted device, like an external DVD drive or a USB stick (Figure 11.2).
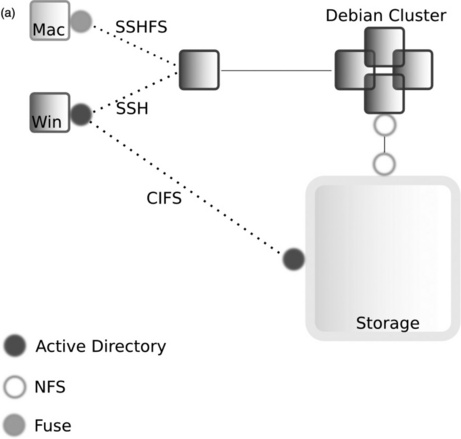
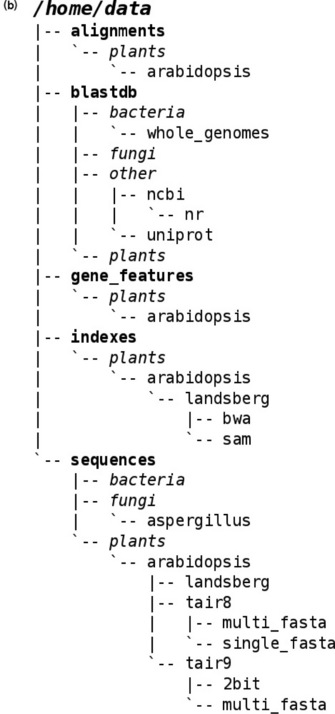
Figure 11.2 Our filesharing setup. (a) Machines and network connections. We use a multiprotocol environment on our servers and file store, which is shared to Windows devices via Common Internet File System (CIFS) [35], to Mac OS X devices via Secure Shell File System (SSHFS) [36] via various routes. Macs are provided with a client program, MacFUSE [37], which allows connection to an intermediary Linux computer via SSHFS. The intermediary Linux machine has the file store directly mounted through Network File System (NFS) [38] and passes a connection to the client. In the Windows environment we provide CIFS configured on the storage device directly allowing the Windows machines to mount it. Authentication for Windows and Mac is done with the Active Directory service and via the Network Information Service for Linux. This configuration has been the most stable in our tests, and allows the user to be flexible about which machine they work with. Early on we attempted to deploy WinFUSE [37] in the Windows environment but found the drivers to be very unstable in our setup. A further consideration in deciding which method to use was our need to access our data on portable devices via Virtual Private Networks (VPN) [39] from off our main site. These protocols provide facility for this behaviour and work as if on-site when a user tries to access remotely. (b) A fragment of our shared folder structure
11.4 Organising the data
Once the data can be seen by the computers they are working on, biologists still need to be able to find the files and folders that they need. We have used a simple but effective trick to create a directory structure for files that will be required by multiple users, such as BLAST [6] databases or GFF files [7], that is easy to navigate and helps to keep itself populated properly. Inspired by the six-degrees of separation principle, we have broad top-level folder names that describe the general data type, for example 'features' or 'sequences', then a subdirectory of broad organism taxon, for example 'plants' or 'oomycetes', then a subdirectory of species before getting data-specific with, for example 'gff' or 'multi-fasta'. This structure can bring most files within four or five clicks of the root data directory (Figure 11.2). We specify the skeleton structure of the data directory but afterwards any user is able to add (and delete) what they like in any of these directories. The structure of the directory is kept sane by requiring users to follow simple instructions for adding a record to a text file in the root of the data directory. We have small scripts that watch and alert us to any discrepancies between the records in the file and the actual contents of the directory. This simple system is much less error-prone in practice than it may seem. In truth the system is mostly about letting the users know in a clear fashion where and how to deposit their data for easy sharing and retrieval, they are usually pretty good about doing this as long as it is clear. The threat of data deletion helps persuade users to stick to the scheme too (although in reality we never delete a file, we move it to a recycling bin and wait to see if anyone asks for it). The frequency with which new files are updated in our experience is sufficiently low to ensure that we are not constantly running around chasing files, we easily manage a couple of hundred shared files in this way. One important caveat is that this sort of directory structure really must be kept for shared files, and not an individual user's working files; assemblies from which many users may predict genes or calculate coverage of RNAseq reads would work well, but a spreadsheet of results derived from these for an individual result may be best left in the user's allotted working space. Also, we do not keep primary data from sequencers and mass specs in these folders, these are kept separate in a read-only folder on live storage for a useful amount of time (which will vary according to project), before being moved to archive. Our data retention policy for our Illumina sequence data is straightforward; we keep what we need to work with and what we need to submit to sequence repositories on publication. In practice we keep the FASTQ [8] sequence files and minimal technical meta-data on the run. Reads are kept on live storage until the allotted space is full and then operate a one in, one out policy, moving the older files to archive. Usually this means we can keep raw reads for around eight to twelve months.
11.5 Standardising to your requirements
We found it necessary to 'get tough' with the way that users format and describe their data. Sequence data have pretty good and straightforward file formats: FASTA and FASTQ are pretty clear, even if some things like quality encodings are sometimes a bit obscure, but most other data types are much more variable and harder to work with and important metadata is always difficult. Bad descriptions and formats make it hard to work with internally, even to the level that we do not know what a file has in it and cannot therefore work with it. Every bioinformatician has had to frustratedly wrangle somebody else's poorly formatted file because it messed up their perfectly workable pipeline. Eventually, lots of the data we collect will have been analysed enough to warrant publication and we will need to submit to public repositories. Typically, the worker who generated the data will have moved on to new projects and getting the right meta-data will be difficult. To prevent these sorts of frustrations and eventual mistakes in submitted meta-data, we require workers to stick to certain standards when creating their data or we refuse to work with it.
We produce specifications for different file and data types too, meaning certain pieces of information must be included, for example we require all our GFF files to include a version number for the feature ontology used, each record to have a certain format for dbxref attribute if it is included. In doing this we found we had to provide a reliable and simple way of describing the data when they make it. At the outset we hoped that existing software would be fine, Laboratory Information Management Systems (LIMS) seem to be the right sort of tool but we have found these systems either far too cumbersome or just lacking in the right features for our needs. Inevitably in developing easy procedures we have had to create our own software, this is probably something that all bioinformatics groups will have to do at some point, even though generic LIMS and data management systems exist, the precise domains you need to capture may be harder to model in these systems than in a small custom tool of your own. We turned to Agile development environments, in particular the Ruby-on-Rails [9] Model-View-Controller paradigm web application framework for producing tools around popular Structured Query Language (SQL) databases (commonly called 'web apps' or 'apps'). Rails makes application development quick and easy by providing intelligent scaffolding and many built-in data interfaces. Most usefully, data-mart style REST [10] interfaces and XML [11] and JSON [12] responses are built-in by default, and others are very easy indeed to implement. Thanks to this it is fabulously easy to share data between tools in this framework. It is useful to note that the Rails project changes significantly between versions 2 and 3, so initiating a project in Rails 3, although giving you the most bleeding-edge code base has somewhat lower community support, for the time being at least. There is lower coverage of Rails 3 in the many blog articles about Rails and in the web forums that coders use to discuss and help each other with coding problems. In these forums most problems you encounter starting out will already have been asked, or will get answered in some fashion after a couple of days. Rails 2 applications are inherently incompatible with Rails 3 applications and upgrading is not straightforward.
Once the app is developed, serving it has its own issues; the in-the-box server Webrick or a vanilla Mongrel setup are not designed for a production environment. The traditional approach to hosting Rails applications is to have a server running Mongrel or even Webrick, the Ruby servers built into Rails, attached to local server ports with Apache [13] to proxy requests to the Rails application servers. This setup helps to avoid the limited concurrent connections and stability problems in Mongrel and Webrick. However, running multiple Rails application servers uses lots of machine resources and is time-consuming to configure and maintain. A far better approach is to allow Apache to run the Rails application code, which we do with the Phusion Passenger module (aka mod_rails) [14]. With this approach applications are only running when they are needed, can be deployed with minimal configuration and multiple Rails applications can be deployed under the same Apache server (each just requiring a separate RailsBaseURI declaration in Apache config). New apps can be deployed in minutes without time-consuming proxy configuration or ongoing maintenance efforts to ensure that individual application servers are running. We enjoy using Rails and do indeed find it is a very productive environment, but it is a little over-hyped, although increasingly easy to code with and prototype an application on your local machine, it can be a struggle to push to the production environment. Not many Sys-Admins are experienced enough with the system to host it easily and some work needs doing at deployment to successfully host an app with many users moving lots of data about, but once the right trick is learned for your production environment it is easy to scale.
For the high-throughput image data that we generate, initially we were using a flat-file archive system on our server, although the rate at which we generate images precludes this being viable for long. We are now moving over to a more versatile Omero server [15]. Omero is an image repository and API produced by the Open Microscopy Environment
Consortium with great mechanisms for storing microscope and other technical meta-data. Omero provides excellent capability for connectivity and there is a wealth of client applications that are able to interface with it. With these applications a user can select images for manipulation, annotation and analysis. Image analysis procedures such as segmentation, object identification and quantification can be performed within the client applications direct on the user's desktop machine pulling data automatically from the Omero database.
11.6 Analysing the data: helping users work with their own data
Once we have our data under control and in our apps/databases, we visualise with external tools. For the majority of our next-generation sequencing experiments, genome browsers are very popular with our users. We completely eschew the use of GBrowse-style browsers [16] that require a lot of setup on an external server and require the bioinformatician to upload (and prepare) data for a user before it can even be looked at. Instead we opt for the very useful and user-friendly SAVANT [17] and Integrated Genome Viewer (IGV) [18] desktop genome browsers. SAVANT works well in most cases, presenting a clean and straightforward interface for viewing the alignment of next-generation reads on reference or custom assemblies, which is mostly what we want. More can be done with IGV, it is particularly suited to filtering and comparing data. Both work well but have some minor network issues, getting either to start from behind a firewall or proxy is initially difficult. On first loading in such an environment SAVANT takes a while to initialise (long enough to make a user think the machine has crashed), patience and turning off auto-update once it is loaded will make subsequent loads much quicker. IGV relies more on files downloaded over the internet and needs details of the proxy to function. Early versions of SAVANT could crash with an out-of-memory error when trying to load in reference sequence, later versions have fixed this problem.
For some applications, such as hosting a next-generation data set to be viewed by collaborators over the web, we have used other web service-style browsers like JBrowse [19] (part of the GMOD project) and AnnoJ. Both of these are fast, flexible and somewhat attractive, but neither is anywhere near as easy to setup as the desktop browsers above. AnnoJ [20] is a web service that renders feature data. It makes requests of another data-providing web service via a URL and some GET parameters in its own non-standard format. The data-providing service must return AnnoJ-readable objects and meta-data in JSON for AnnoJ to render (Figure 11.3). Feature rendering is fast for gene models but somewhat slower for track types like the histograms that show the coverage of aligned reads over contigs. AnnoJ is limited in the feature types it can display and is extremely inflexible with regard to styles, no real documentation on styling the features exists and AnnoJ is closed source, the actual JavaScript must also be retrieved over the internet as a web service. The core library for AnnoJ cannot be downloaded and is 'mini-fied', that is compressed in such a way that download times are reduced but the code in it cannot be read by a human. In truth, we actually began using AnnoJ with help from the author, who was a collaborator of a collaborator, so got a head start on setting it up. Sadly, nowadays, the author seems to have gone quiet on the project. Despite these drawbacks, we still use it. In particular, it has found utility as a quick browser option for our gene feature and assembly versioning database, Gee Fu [21]; as a pure web service it does have that flexibility we see in no other browser (as Gee Fu is a Rails application, it is automatically a web service and together the two provide a very quick way to provide feature data over a network for many users in an easily extended platform). JBrowse is superficially similar to AnnoJ, as it is also a Javascript project that renders gene feature data in a fast and attractive way. The main downside to JBrowse is that the data files (JSON files) have to be pre-generated and are not stored in a database. This includes images representing features, which is fine for multi-use elements like gene models but coverage information represented by histograms is not dynamically generated and PNG files for these must be pre-rendered too. Documentation provided with web applications and tools does not necessarily cover all installation problems that you may have in your particular setup. The FireBug plug-in for Firefox (and the developer tools in Chrome to a lesser extent) are extremely useful for de-bugging the requests made between browsers, CGI scripts/databases and web servers.
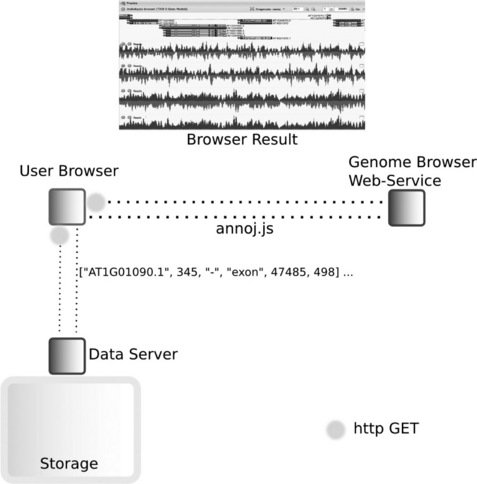
Figure 11.3 Connectivity between web browsers, web service genome browsers and web services hosting genomic data. A user client (web browser) makes a GET request from a URL with certain parameters to, for example, the AnnoJ web service (www.annoj.org), which returns a Javascript library. This then requests genomics data from the web service that hosts the genomics data (e.g. that served by a Gee Fu instance). AnnoJ can render and allow interactions with the genomics data in the web browser
Usability is a constant concern when it comes to the tools that we present to the biologist, and as far as possible we stick to graphical tools. Free and open source software that has a graphical user interface never comes along with iPod-esque levels of ergonomic or aesthetic design finesse, but we have not come across any whose main interface is so terrible that no analysis can be done with it. Phylogenetic analysis software seems to be among the worst culprits for poor usability. The strength of free and open source software is actually in its limitations; quite often the software does not try to do too many things and this makes the workflow within the program straightforward, so most packages are at least usable for their main task. Sadly, programs with graphical interfaces are in the minority. We find that in practice, after a bit of training, the worst symptoms of 'command-line aversion syndrome' can be fought and biologists are not put off the command-line interface, especially for small tasks. To help with usability we have installed a local Galaxy [22] instance, this workflow engineering and tool integration environment has been described as the 'missing interface' for bioinformatics and it is well designed. Biologists can get up and running command-line tools through Galaxy in no time at all.
11.7 Helping biologists to stick to the rules
In our experience, bioinformaticians can be somewhat recalcitrant when it comes to telling the biologist that they must format data in a certain way or follow certain naming conventions. Perhaps this is because they feel that there will be resistance and that the biologists will not appreciate this intrusion into their work. Biologists work according to similar sorts of rules all the time and are quite flexible in their acceptance of these. For example, when carrying out their bench experiments, the molecular biologist will often need to create a piece of DNA that comes from some organism of interest and fuse it to DNA control sequences that perhaps come from a different organism, a chimaeric piece of DNA. To use this it may need to be inserted and activated in a third organism, often bacteria, creating a genetically modified organism with DNA from two donors. It is not too hard to imagine that this procedure requires lots of rules, standard procedures and paperwork so biologists are primed to jump through hoops when getting things done. When we introduced our new rules for data and meta-data standards, we did not believe that we would get much resistance from the biologists, although we were prepared for quite a lot. We armed ourselves with arguments as to what savings we would make in time and convenience and future protection against confusion and data loss and we took these arguments straight to the group leaders. Convincing the project leaders gave us some authority and official backing and made it much easier to get the rules adhered to. We get good uptake of our rules and standards, biologists quickly come to appreciate the reasons why and after a little while (usually after having to deal with someone else's files) are glad that they have been implemented.
11.8 Running programs
With the environment setup the new user can log on and start to do their analyses. We use a Debian-based [23] compute cluster to which users may connect from their local machines, usually Macintosh computers and a small number of Windows machines. Simple shell scripts can be double-clicked mounting all devices that are needed including the NetApp storage device holding our data. Because of the age of the OS, this trick cannot be achieved on our Windows XP machines, on which WinSCP [24] is used instead, but can be done on Windows 7. All data can be interacted with as if on the local machine if needed, and the user has access to the high-performance compute cluster through the automatically connected terminal. Jobs requiring the cluster are submitted and managed with Platform's LSF system, a proprietary system. Within this framework we allow all users full freedom in a public folder, into which they may install and compile whatever software they need. This works well to allow them to try out any solutions they like. Of course, this sort of setup requires that the user has experience with the command-line interface for the majority of analysis software, and, although biologists can be brought quite quickly up to speed with this style of working, in most cases there are now workflow and tool integration pipelines that take away much of the pain a brand new user may feel.
The single most useful piece of software we have installed to this end is Galaxy. Galaxy is a workflow-engineering environment in which a user may easily combine data sets and command-line bioinformatics tools in a graphical user interface to create and save analyses. The environment is very powerful and intuitive to a biologist familiar with the point-and-click paradigm of computer interfaces and they can immediately get down to the work at hand. Other such environments exist, but in our experience Galaxy is the simplest for the user and requires less intervention from us. A further advantage is the extensive training videos that the Galaxy Team provide to teach users (not administrators) how to carry out common analyses. An awful lot of software comes bundled with Galaxy and we have yet to come across a command-line tool that cannot be integrated. However, the bias in the software provided and in the themes of the training videos is very much towards the analysis of next-generation sequencing data.
Administering a Galaxy installation can be quite straightforward, but we found there are a few points worthy of comment. The community is large and a lot of problems will have been encountered and solved before. In testing the Galaxy system in a local install as a newbie then typically it will get installed on a single machine, this will run fine and probably use SQLite [25] for its job's database. The most useful lesson we learned in moving to a production environment was to make sure we switched to a PostGreSQL [26] database. The SQLite was able to cope for a few weeks under test with a limited number of users but reached a point where it started to cause unexpected behaviours and errors in Galaxy (behaviours one would not expect from a slow database), switching to PostGreSQL fixed all previous odd behaviour. Be warned, there is no migration script from SQLite to PostGreSQL in Galaxy and upgrading in this way is not supported at all by the Galaxy team. We had an arduous week testing and re-testing a custom migration script to switch our precious two-man month's worth of work to a new database management system.
According to its development team, Galaxy is always at version 1. This reflects a commitment to backward compatibility that results in daily incremental updates to the codebase on their server, rather than significant new releases. Often these updates will be as little as a few lines. Sometimes many megabytes of code will change. Most importantly, the database schema can change. Galaxy provide database migration scripts between updates, but do not provide scripts for arbitrary jumps, say from schema 27 to schema 77. The practical implication of this is that it is wise to update often. The community at large seem to update on average once every 12 weeks, to provide a good balance between workload and ease of upgrading. Leaving upgrades too long can make Galaxy painful to upgrade as many merges and schema changes and update scripts need to be run and tested sequentially to ensure a smooth running path.
Running Galaxy, essentially a job server-based system, on a compute cluster requires a touch of planning but is made easier by the fact that most cluster systems are supported by reliable libraries. In our cluster Galaxy itself runs on a head-node, which is visible to the outside world and the machines that accept jobs from the queue. We used the free DRMAA libraries from Fedstage [27] compiled against LSF (a Sun Grid Engine version exists too) and merely had to configure job-runners to ensure that Galaxy jobs went into the cluster rather than being executed on the head-node machine.
When dealing with big files, as is inevitable in NGS analyses, it is best to ensure that upload and download do not run in the cluster as the client (web browser in this case) must be able to connect to the machine doing the job. Galaxy generates large output files, which end-users take as their results. Galaxy's facility for allowing users to download data occupies a lot of processing time within the main Python process, which can cause Galaxy to slow and fail when sending data to the web browser. The solution is to use the apache_xsendfile module, which provides a mechanism for serving large static files from web applications. When a user requests a large file for download, Galaxy authenticates the request and hands the work of sending the file to the user to Apache, without needing the Galaxy processes to be involved again. The apache_xsendfile module does not currently have an upload feature. Because we use a closed system we do not provide for upload of large files into Galaxy as this often results in data-duplication (instead users requiring large files to be put into the system must seek the bioinformatician and have the files put into a data library). The Galaxy team recommend the use of nginx [28] as a server for the transfer of large files up to Galaxy. An FTP server solution is also provided.
During analyses, Galaxy creates large data files that can only be disposed of when the user decides that they are finished with. Thus in a production environment Galaxy can use a lot of disk space. Our instance runs comfortably in 1.5 TB of allotted disk space provided that the cleanup scripts are run nightly. The timing of cleanup runs will depend on use but sooner is better than later as running out of disk space causes Galaxy to stop dead and lose all running jobs. When running scripts weekly we found that 3 TB of disk space was not enough to prevent a weekly halt.
11.9 Helping the user to understand the details
With all these new powerful tools at their disposal, it would be remiss of us not to teach the biologists how to understand the settings and how to interpret the output, and, most importantly, what are the technical caveats of each data type. It is quite possible to train biologists to do their own analyses and they can quickly get the hang of command-line computer operation and simple scripting tasks. Surprisingly though, a common faltering point is that biologists often come to see the methods as a 'black-box' that produces results but do not see how to criticise them. It is often counterproductive at early stages to drag a discussion down to highly technical aspects, instead introducing simple control experiments can work well to convince biologists to take a more experimental approach and encourage them to perform their own controls and optimisations. A great example comes from our next-generation sequence-based SNP finding pipelines. By adding known changes to the reference genomes that we use and running our pipelines again, we can demonstrate to the biologist how these methods can generate errors. This insight can be quite freeing and convinces the biologist to take the result they are getting and challenge it, employing controls wherever possible.
Training syllabuses or programmes will vary massively and be extremely site-dependent. The most important thing about the training programme we have implemented is that the people giving the training really see the benefit of working in this sort of service model and therefore really want to do the training. From an enthusiastic trainer all else should flow. We have found that making resources for training constantly available and operating an open-door question policy are vital in preventing any frustration a newbie may otherwise feel when learning a new topic. It goes without saying that web sites are great places to disseminate links to resources including course recordings and 'how-to' screencasts. We have used free video servers including YouTube for shorter videos and blip.tv for longer recordings. Syndication and RSS feeds can be disseminated via iTunes for free. Screen capture software such as iShowU-HD [29] is essential; this software has a free version (although it admittedly prints a watermark onto the video, we have never found this to be intrusive). Users are very fond of the longer videos, particularly when they have access to the accompanying course materials and can work through the course at their own pace later. The most popular training materials are those that are self-contained, that can be taken away and worked on when opportunity presents, such as our own PDFs, which deliberately follow a 'principle-example-exercise' structure and are quite focussed on discrete tasks. The least effective seem to be the longer reference books that aim too wide in scope, the effort required to get much out of these sorts of resources can be somewhat dispiriting to a beginner.
11.10 Summary
With all these free and open source tools and tricks, we have been able to implement a bioinformatics service that is powerful and flexible and, most importantly, clearly accessible to the user at the levels at which the user actually cares. By deploying tools and providing sensible and custom infrastructure in which the user can access what they need without needless layers of user involvement in between, we can lift the burden of data management from a scientist and allow them just to get on with the job of research. Thanks to the flexibility and interoperability of the free and open source tools that are now available, we can put together pipelines and environments for any sort of research our institute is likely to encounter. Using free and open source software in this way frees a bioinformatician from having to perform every last analysis themselves, and thanks to the software and hardware infrastructure the bioinformatician can have much more time to pursue their own research, such as developing new methods. As the approach stands as well for one user as it does for one thousand, then a sensible infrastructure is scalable to the coming demands of our data-flooded field.
It's not all easy when relying on free and open source software. As much of it is developed for other people's purposes, there can be significant shortcomings if your immediate purpose is slightly different from the creators. The first concern when sourcing software is 'does it do what I want?', and all too often the best answer after surveying all the options is 'nearly'. As plant scientists and microbiologists, our model organisms often do not fit some of the assumptions made by analysis software, for example SNP finding software that assumes a diploid population cannot work well in reads generated from an allotetraploid plant or the formats in which we receive data from genome databases are somewhat different from those the software expects. One feature we would love to have but never do is BioMart-style [30] automatic grabbing of data over the web, such software never supports our favourite databases. This reflects the fact that the main source of investment in bioinformatics is from those working in larger communities than ours, but, in general, lack of exactly the right feature is an issue everyone will come across at some point. Typically we find ourselves looking for a piece of software that can handle our main task and end up bridging the gaps with bits of scripts and middleware of our own, one of the major advantages of Galaxy is that it makes this easy.
It is surprising to us that there is lack of useable database software with simple pre-existing schemas for genomics data. There are of course the database schemas provided by the large bioinformatics institutes like EMBL or the SeqFeature/GFF databases in the Open Bioinformatics Foundation [31] projects, but these are either large and difficult to work with because they are tied into considerable other software projects like GBrowse [16] or ENSEMBL [32] browsers or just complicated. Often, the schema seems obfuscated making it difficult to work with on a day-to-day basis. Others, like CHADO [16], have been a nightmare to just start to understand and we have given up before we begin. In this case we felt we really needed to go back to the start and create our own solution, the Gee Fu tool [21] we described earlier. We cannot always take this approach, when we are stuck, we are stuck. It is not in the scope of our expertise to re-code or extend open source software. Our team has experience in Java and most scripting languages, but the time required to become familiar with the internals of a package is prohibitive, with busy workloads we must always pick our battles and sadly the extent of our contribution to Open Source projects is often little more than to report bugs to the project owner. A saving grace is that sometimes we are able to become part of the wider development community and have some influence on the way that software we use gets made or just get inside information on how to use it and how to code with it. Such contacts are worth their weight in gold.
Given such issues, why would we not use commercial software? If you pay, surely this results in better support? The answer is sometimes true, with commercial software providing the only practical solution. Usually this will be the case when buying a new piece of hardware, we are stuck with the vendor's software for running all of our sequencing machines, job management systems and storage devices. There is no open source alternative software that could be relied on for these absolutely critical parts of the pipeline. For the downstream analyses, though, the simple fact is that commercial software is rarely up to the task. In aiming for the largest markets, commercial tools often try to incorporate too many functions. This can often result in the tool being 'jack of all trades, master of none', with results being unsatisfactory or too much of a black box for scientists to be comfortable with. Tying users in to proprietary standards is another annoyance, legacy data in undocumented or proprietary formats that no other software reads makes it impossible to re-analyse in other packages. Science moves fast and new methods appear all the time, commercial software seems rarely to innovate.
Ultimately, this need for speed is why free and open source software will always be a vital component of the software pipelines of most scientific research institutes. The need of the community to innovate could never really be matched by commercial efforts that need to provide solidity and make a return on their investment. As painful as the time and meddling aspect of using open source is, it does help us to keep as current as we need to be. The best middle ground will come from open source projects like Galaxy and Taverna [33], and standard data format descriptions like SAM [34] or Omero-TIFF [15], that help us to tie disparate bits together and make both interoperability and usability of the rapidly appearing and evolving tools much greater where it really counts, with the scientist.
11.11 References
[1] Moore's Law – http://en.wikipedia.org/wiki/Moore's_law.
[2] Illumina Hi Seq – http://www.illumina.com/systems/hiseq_2000.ilmn.
[3] The Sainsbury Laboratory – http://www.tsl.ac.uk.
[4] The Gatsby Charitable Foundation – http://www.gatsby.org.uk.
[5] NetApp – http://www.netapp.com.
[6] Altschul, S.F., Madden, T.L., Schaffer, A.A., Zhang, J., Zhang, Z., Miller, W., Lipman, D.J. Gapped BLAST and PSI-BLAST: a new generation of protein database search programs. Nucleic Acids Research. 1997; 17:3389–3402.
[7] GFF3 – http://www.sequenceontology.org/gff3.shtml.
[8] FASTQ – http://en.wikipedia.org/wiki/FASTQ_format.
[9] Ruby on Rails – http://www.rubyonrails.org/.
[10] REST – http://en.wikipedia.org/wiki/Representational_State_Transfer.
[11] XML – http://en.wikipedia.org/wiki/XML.
[12] JSON – http://en.wikipedia.org/wiki/JSON.
[13] Apache – http://httpd.apache.org/.
[14] Phusion Passenger – http://www.modrails.com/.
[15] Omero – http://www.openmicroscopy.org/site/products/omero.
[16] GMOD – http://gmod.org/.
[17] SAVANT – http://genomesavant.com/.
[18] IGV – http://www.broadinstitute.org/software/igv/home.
[19] JBrowse – http://jbrowse.org/.
[20] AnnoJ – http://www.annoj.org/.
[21] Ramirez-Gonzalez, R., Caccamo, M., MacLean, D. Gee Fu: a sequence version and web-services database tool for genomic assembly, genome feature and NGS data. Bioinformatics. 2011. [in press].
[22] Galaxy – http://usegalaxy.org.
[23] Debian – http://www.debian.org/.
[24] WinSCP – http://winscp.net/.
[25] SQLite – http://www.sqlite.org/.
[26] PostGreSQL – http://www.postgresql.org/.
[27] FedStage DRMAA – http://sourceforge.net/projects/lsf-drmaa/.
[28] nginx – http://nginx.net/.
[29] iShowU-HD – http://www.shinywhitebox.com/ishowu-hd/.
[30] BioMart – http://www.biomart.org.
[31] OBF – http://www.open-bio.org/.
[32] ENSEMBL schemas – http://www.ensembl.org/info/data/ftp/index.html.
[33] Taverna – http://www.taverna.org.uk/.
[34] SAMTools – http://samtools.sourceforge.net/.
[35] CIFS – http://www.samba.org/cifs/.
[36] SSHFS – http://en.wikipedia.org/wiki/SSHFS.
[37] FUSE – http://fuse.sourceforge.net/.
[38] NFS – http://en.wikipedia.org/wiki/Network_File_System_[protocol].
[39] VPN – http://en.wikipedia.org/wiki/Virtual_private_network.