
Extreme scale clinical analytics with open source software
Abstract:
Knowledge is at the root of understanding all symptoms, diagnosing every ailment, and curing every disease. This knowledge comes from the deep studies performed by research organizations and diligent healthcare workers who contribute to documenting and responsibly sharing their observations. Through the American Recovery and Reinvestment Act of 2009 (ARRA [1]), the industry was incented to implement electronic medical record systems that capture more information than ever before. When billions of medical records converge within a secure network, the baton will be handed to analytics systems to make use of the data; are they ready? This chapter explores what the next-generation software infrastructure for clinical analytics looks like. We discuss integration frameworks, workflow pipelines, and 'Big Data' storage and processing solutions such as NoSQL and Hadoop, and conclude with a vision of how clinical analytics must evolve if it is to handle the recent explosion in human health data.
20.1 Introduction
One of the largest problems in clinical analytics is that the immense breadth of available services results in a very diverse set of implementation details. Standardizing every scenario quickly becomes impossible. The future of clinical analytics therefore needs an architecture that admits that the sources of data will never be perfectly normalized. Open source communities have been the quickest to address these types of problems. Architectural patterns created and contributed to the community by the thought leaders in internet-scale computing can be leveraged to solve this problem. In fact, solving these problems with these tools will one day become the cheapest, simplest, and most highly scalable solution.
This chapter will introduce a prototypical architecture that can currently satisfy various simple real-world scenarios but has not yet been fully leveraged. There are several good reasons for this. Most of the trends and capabilities introduced here have emerged in just the past few years. Yet experience suggests that the total cost of development and ownership will be orders of magnitude cheaper when these solutions hit their prime. Figure 20.1 demonstrates a generic information technology view of the components of the stack required to fulfill this domain. Most architects have drawn this picture many times. To the left the integration layer brings in detailed transactional information, not suitable for reporting. In the middle we extract, transform, and load (ETL) these data into a data warehouse, where data can be mined using the many reporting tools available.
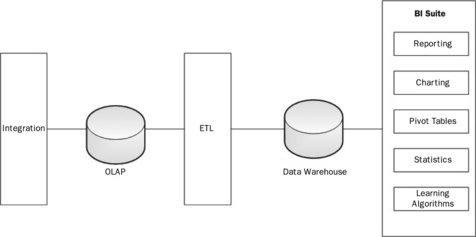
Many architects have also come to understand that the traditional model described in Figure 20.1 is very expensive to scale to extremely large volumes. In response, this chapter will survey many open source technologies that describe a potential solution addressing both clinical requirements and extreme scales. Throughout the text, a simple use-case of researching potential factors of acute heart disease is presented, to provide a sense of how the technology would work in the real world. The example will only lightly touch issues of Health Insurance Portability and Accountability Act (HIPPA) security including the agreements, auditing, and proper practices that need to be in place to allow end-users to operate on the data for purposes of healthcare operations (e.g. large insurance company), or public health (e.g. Center For Disease Control). Although non-trivial, such considerations apply to any technological solution and form a discussion out of scope for the main emphasis of this chapter.
20.2 Interoperability
The first step in clinical analytics is to carefully gather as much meaningful data as possible and process it into a form amenable to downstream analysis. The diagnosis and treatment of patients generates a tremendous amount of data from a large number of sources. A typical hospital will have any number of different systems such as health information systems (HIS [2]), radiology information systems (RIS), computerized physician order entry (CPOE), and electronic health records (EHR). Many hospitals may even have multiple systems from different vendors. How do they make sense of all of this complex health information coming from various different sources?
This was the reason that Health Level Seven International (HL7 [3, 4]) was founded. It is a not-for-profit organization developing standards 'for the exchange, integration, sharing, and retrieval of electronic health information that supports clinical practice and the management, delivery and evaluation of health services' [3]. Its standards attempt to navigate the thin line between enabling interoperability and allowing vendors and hospitals flexibility in a complex domain. This is an important point because the data feeds from the individual systems may require transformation in order to be consistent in the analytical data store. HL7 covers a broad range of topics, including application interoperability at the user interface (UI) level (e.g. Clinical Context Object Workgroup or CCOW) and Medical Logic Modules. The two aspects most relevant for analytics are the messaging standard and Clinical Document Architecture (CDA). HL7 V2.x is still the most widely used set of standards. The V2.x message is a character string with delimiters differentiating parts of the message. Messages are made up of segments as shown in Figure 20.2.
![]() PID identifies this as a patient identifier segment.
PID identifies this as a patient identifier segment.
![]() Segments are composed of fields, which are delimited by the pipe (|) character.
Segments are composed of fields, which are delimited by the pipe (|) character.
![]() Fields one and two are blank, which is why there are three pipe characters in a row.
Fields one and two are blank, which is why there are three pipe characters in a row.
![]() Field three is the patient identifier, which in this example is '921342'. This field may have additional information as to how this identifier was generated.
Field three is the patient identifier, which in this example is '921342'. This field may have additional information as to how this identifier was generated.
![]() Field five is the patient name. This field is of type XPN, or extended person name. This type of field can be further broken down into components (separated by the caret symbol '^' for components and the ampersand '&' for subcomponents). With this type the first component is family name and the second given name.
Field five is the patient name. This field is of type XPN, or extended person name. This type of field can be further broken down into components (separated by the caret symbol '^' for components and the ampersand '&' for subcomponents). With this type the first component is family name and the second given name.
This is an extremely simple example of an HL7 V2.x message. The entire specification for V2.6 messaging spans 27 documents. HL7 Version 3 (V3) has made a number of improvements, including embracing XML for data communication over delimiters. It also went beyond cosmetic changes and developed a semantic ontology for the transmission of medical data between systems. The HL7 reference implementation model (RIM) defines a core set of objects and message life cycles which they intend to use as a base model for any message communication between clinical systems, similar to a set of mathematical axioms.
The RIM is not simply an academic exercise, but is critical to interoperability. This is because in any sort of complex communication, context is vital. In verbal communication, words and phrases taken out of context completely lose their meaning. The same is true in communication between medical systems. For example, consider the medication associated with a patient. Does this mean that the patient is currently taking this medication, or has this medication been ordered for this patient, or does this patient have an allergy to this medication? Simply associating patient and medication together without context is meaningless. The RIM forms the core foundation to give context to these data points.
One of the more interesting standards coming out of HL7 V3 is the CDA, especially for its application in analytics. Previously, most of the clinical information has been kept in narrative form in clinical documents such as history and physicals, operative reports, discharge summaries, and so on. As these documents are in text form, it is difficult to derive meaningful analytics from them. In order to do analytical analysis, these data need to be in a machine-understandable format. Subsequently, the data can be stored in discrete chunks by a computer in a format that has one and only one semantic meaning. The CDA is meant to solve this problem by providing a way to exchange clinical documentation and retain both the narrative text and the machine-understandable format. Figure 20.3 shows an example of a portion of a CDA document.
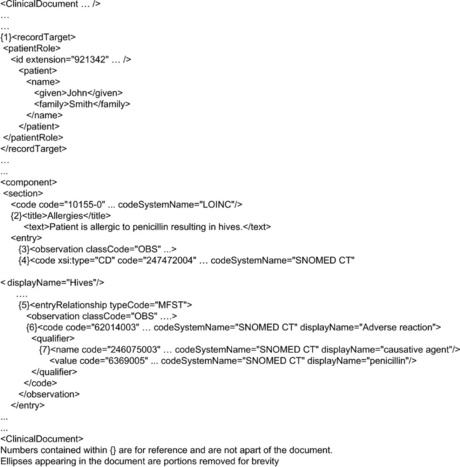
The message is made from a number of components highlighted in the figure:
1. the patient record from HL7 V2.x in the V3 format for CDA;
2. the section of this document has a title of Allergies and a text indicating a patient allergy. This is narrative for human use;
3. the machine-processable portion, beginning with an observation;
4. the observation has an associated code that indicates that the patient contracts hives. CDA relies on external vocabularies for describing specific medical concepts. This example is using a code from SNOMED CT;
5. next, the CDA document describes why the patient gets hives. The entryRelationship relates two entities, with the typeCode MFST meaning manifestation;
6. another observation, this time of an adverse reaction;
7. finally, a name value pair indicating penicillin as the cause.
20.3 Mirth
With both HL7 V2 and V3, it is tempting to build individual scripts or programs to handle each of the different interactions. There are open source toolkits in a variety of languages for parsing and manipulating HL7 messages. For example, the Perl HL7 toolkit [4] could be used to write a script that reads an HL7 orders feed, processes it, and outputs the results needed into an analytics database. The problem is that this sort of solution is very difficult to scale out to meet the needs of a modern hospital for the following reasons:
1. Large effort to write and maintain
![]() Implementers should consider not only the time it takes to write all of those scripts/programs but also maintaining the scripts. This includes keeping some form of version control for each of the scripts and updating them as applications change.
Implementers should consider not only the time it takes to write all of those scripts/programs but also maintaining the scripts. This includes keeping some form of version control for each of the scripts and updating them as applications change.
Individual point solutions usually collapse under their own weight. They are fragile and require so much time and effort to enhance and maintain that they ultimately do not accomplish the fundamental task. To use an analogy from the physical world, a better solution would be a series of pipes to connect the various sources to our analytical database. However, as previously mentioned, HL7 standards have a large amount of leeway in their implementation. Continuing the analogy, these pipes will not necessarily fit together without adaptors.
Mirth Connect [5] is an open source solution that provides the plumbing and adaptors to connect clinical systems to an analytical store. It provides the pipes in the form of what Mirth refers to as channels. The channels are attached to various inputs and outputs via connectors (Figure 20.4). Filters can be added to the channels to allow for filtering out any data that are not relevant. Transformers allow for the selection and transformation of data.
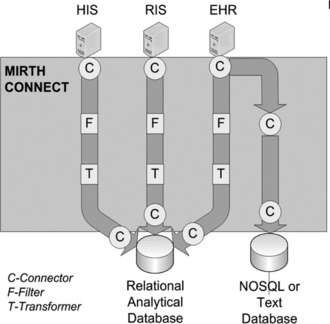
Figure 20.4 Mirth Connect showing the channels from the data sources to the databases. Note that channels can connect to other channels. In the example, the EHR connection is split such that both filtered/transformed and raw data can be inserted into independent data stores
20.3.1 Connector creation
Mirth supports a wide variety of input connectors, from more general protocols such as TCP or HTTP to more domain-specific ones such as HL7 Lower Level Protocol (LLP) and DICOM. Mirth also supports attaching channels to one another via connectors. The input connections support a wide variety of customization and error handling specific to the protocol that is being used, from timeout and buffer sizes for network protocols to automatic file deletion or movement for the file reader. This is detailed work that is often missed when writing custom scripts. The other important aspect to setting up a connector is setting the data types. This awareness of medical data types is what separates Mirth from a more general message processing system. Mirth can process HL7 v2.x, HL7 v3.0, X12, EDI, XML, NCPDP, DICOM, and general delimited text. There is a separate set of data types for the inbound and outbound source connector as well as the destination connectors.
Depending on the purpose of the analytical data store, an implementer may only be interested in a subset of the data coming from the source systems. Mirth allows for the creation of filters to filter out any data that are not relevant. Filters can be created both on the source connector and the destination connector. Filtering at the destination connector is useful if there are multiple destinations with a subset of the data going to each. Filters are broken up into a set of rules, which are connected to each other by boolean operators. Rules can be written either using a Rule Builder or by executing a small Javascript for more complex rules.
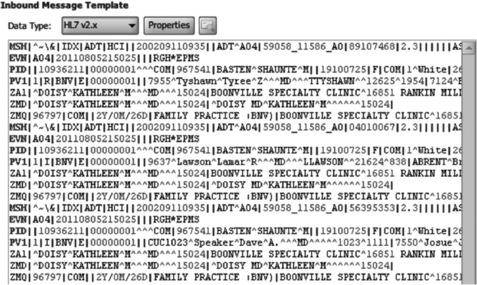
Mirth uses a facility's own sample messages to assist in building filters and transformations. Once a sample message is loaded either from a file or by pasting it into the window, as shown in Figure 20.5, a message tree is built with the message hierarchy from the data type based on the sample data. This message tree is shown in Figure 20.6. Implementers can then drag the data from this tree into either the Rule Builder or Javascript, and Mirth will translate it into the correct variable from the message.
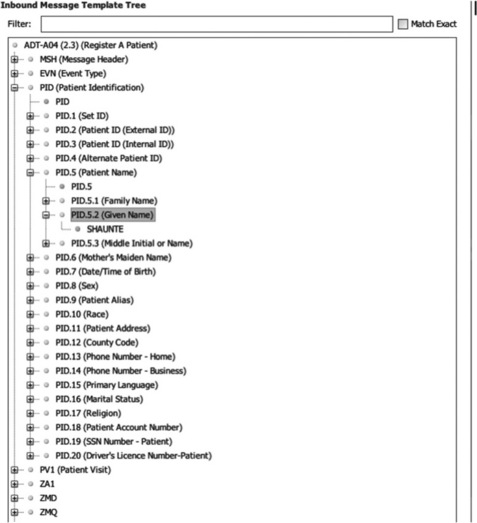
Transformers have a similar interface to filters. Like the filters, the sample input and output messages create a message tree that is used to build a list of transformer steps. There are a couple of different options for the transforms. The Message Builder interface takes an element from the inbound message and puts it in an element in the outbound, with the ability to do string replacement on the element. The Mapper interface is used to map elements to a variable for use later. For analytics, this is useful because fields can be mapped to variables that can then be mapped to database statements. For XML messages, there is the option of executing an XSLT script. Finally, custom Javascript code can be written to perform more complex transformations.
Once the data are transformed, they need to be inserted into the analytical database. If using a relational database, such as MySQL [6], the database writer can be used to insert the data. After inputting the driver and connection information, Mirth can generate sample SQL insert statements. Afterwards, variables mapped during the transform can be used with the SQL insert. If a database is not listed, Mirth does allow the installation of custom database drivers. However, for non-traditional NoSQL databases such as CouchDB [7], this database connection mechanism will not work. Mirth does support the same variety of connection types that the input connector supports and thus, either Javascript or HTTP can be used to communicate with a NoSQL database.
20.3.2 Monitoring
Of course, any integration workflow is unlikely to be permanently problem-free. Mirth does an excellent job in not only providing a solution for implementing the integration, but also monitoring the integration during its lifecycle. The first thing users see when starting Mirth is the Dashboard, which shows all the channels and statistics about the channels. From here, users can drill down into a channel and perform queries on the messages Mirth has processed. Mirth will store messages for a configurable period of time with optional encryption available. It also allows for viewing the raw message, the transformed message, the final message, and any errors that occurred. Finally, alerts may be created to notify individuals via email, specifically customized based on error type and channel where required.
20.4 Mule ESB
As we have seen, Mirth is an excellent solution for integrating medical systems into an analytical data store. However, what about data from sources such as an Enterprise Resource Planning (ERP) system or a spreadsheet containing nursing schedules? These are examples of data that may be relevant to analytical queries but are not necessarily clinical in nature. For the same reasons as before, creating individual point solutions is less favorable than integrated approaches that consistently handle the details around data transport, error handling, monitoring, etc. Enterprise Service Buses (ESB) are commonly used to enable the integration of a heterogeneous set of applications. One of the most popular open source ESBs is Mule ESB [8]. As previously mentioned, Mule ESB is one of the foundational components for Mirth.
ESBs are typically used within a Service Oriented Architecture (SOA), enabling interoperability between a set of loosely coupled services. Each of the services will define a contract, a way of interacting with the service. With HL7 services the contract is predetermined thanks to the inherent standards, but for non-HL7 services this must be created. For example, an administrator may define a contract for querying financial information from an ERP. After defining such services, they are then registered with Mule ESB, which provides the plumbing to connect our services to one another. Mule handles the transport, routing, delivery, and transformation of the message as well handling alerts and monitoring. However, it requires more work in setup and configuration than Mirth because Mule ESB does not have any specialized knowledge of the various systems with which it interfaces.
20.5 Unified Medical Language System (UMLS)
The term heart attack properly refers to a myocardial infarction. However, non-medical personnel often use the term to mean any sudden cardiac arrest, even if it is due to a cause such as long QT syndrome. A medical billing coder may code the event in the ICD-9 [9] vocabulary as 410.02 'Acute myocardial infarction of anterolateral wall subsequent episode of care', whereas a cardiologist may classify the infarction as an 'acute Q wave infarction – anterolateral' which has a SNOMED CT [10] code of 233827001. Obviously, the cardiologist needs a more detailed and descriptive vocabulary than the billing coder. HL7 refers to these different sets of vocabularies as code systems. Where possible, HL7 does not duplicate these code sets but instead relies on the code sets already developed by other organizations. In HL7 V3.x, when using a code it is necessary to refer to the code system from which it originated. For example, take the following XML snippet:
Most of this is self-explanatory, except for the code system. This is an object identifier (OID), which is a code used to refer to the SNOMED CT vocabulary itself. Another dimension relevant to analytics is that systems are not flat but hierarchical in nature. An acute Q wave infarction is a type of acute myocardial infarction, which is a type of acute heart disease, and so forth. To be useful, an analytical query on heart disease will need to contain all records that contain references to any type of heart disease.
The Unified Medical Language System (UMLS) is a project from the US National Library of Medicine (NLM) to bring together various medical vocabularies to enable interoperability [11]. UMLS is organized into a concept hierarchy, starting with a unique medical concept. The unique concept is then related to all known lexical and string variants of the concept. These are then related to individual codes from various clinical vocabularies. Although UMLS is not strictly open source, there is no charge associated with licensing UMLS and the actual data provided can be queried without special tools. However, there may be separate license fees associated with the use of specific terminology sets such as SNOMED CT. The NLM does require that users give a brief report annually of the usefulness of the Metathesaurus.
The UMLS data set is broken up into three areas:
1. Metathesaurus, which contains the vocabularies and relationships;
2. Semantic Network, which contains a set of semantic types (ex. Anatomical Structure, Substance, Finding) and semantic relationships (ex. disrupts, causes, manifestation of), which are used to provide additional meaning to the Metathesaurus;
3. SPECIALIST Lexicon and lexical tools. The SPECIALIST Lexicon adds over 200 000 additional terms from various sources and includes commonly occurring English words. The lexical tools are used to assist in Natural Language Processing.
UMLS bridges the terminology users will use in accessing the analytical data store and the codes contained in the documents. For example, a user wants to find all documents related to 'Acute Myocardial infarction' in a clinical data store with documents coded using SNOMED CT. With UMLS, users can find a mapping from the English term to the SNOMED CT code, and then do a second query to find all SNOMED CT codes whose ancestor is 'Acute Myocardial infarction'. The results of this second query can be used as a filter in the analytical data store.
UMLS does not solve all text matching and text scrubbing problems. Our experience tells us that the last mile of matching is a continuous refinement and build-up of rules and samples that can be matched as time progresses. If made configurable, end-users can populate the queries that help with the mappings and data extraction.
20.6 Open source databases
The next step is data storage. Our use-case poses several challenges on choice of technologies. First, it is becoming increasingly difficult to build a single system that supports the myriad of implementation details of even small regional sets of healthcare providers. CDA is flexible and extensible, so similarly flexible mechanisms to store a complete set of disparate, raw data are required. Second, the volume of data is expected to be extremely large. Medical records, radiology images, and lab or research data are notorious for large file components of high-fidelity information that contain more information than is immediately usable given any immediate questions. These requirements generally wreak havoc on traditional application development. Third, as our understanding of healthcare and the human body evolves, we need to support new questions being asked of old data. The goal, therefore, is to evaluate open source technology's ability to meet the following requirements:
1. ability to store extreme amounts of data in a flexible schema;
2. ability to re-process this data on-demand with new business rules;
3. ability to re-process data to create marts or data-cubes that allow ad hoc analysis on new questions.
The tendency to utilize expensive closed source databases is waning, and more and more people are learning that robust, highly scalable, distributed data storage solutions are available in the open source realm. There has been an even more dramatic shift, though. The ecosystem of application development patterns, using SQL and relying on overly complicated joins of normalized tables, is giving way to the convention and ease of NoSQL databases. The industry has learnt that if the application development paradigms of the early 2000s are re-designed, without relying on SQL, then linearly scalable data storage will be within our reach. In our interoperable analytics architecture we are going to study implementation tradeoffs between four distinct flavors of schema design.
The traditional manner of approaching application development and data storage is through Relational Database Management Systems (RDBMS). These technologies offer widely understood Structured Query Language (SQL) interfaces through application level protocols such as Open DataBase Connectivity (ODBC) and Java DataBase Connectivity (JDBC). We will briefly discuss applying the most popular open source RDBMS, MySQL, to our acute heart disease analytics scenario. MySQL has a long history. Michael Widenius and David Axmark originally developed it in the mid-1990s [12], and it is now owned by the Oracle corporation. MySQL has claimed many millions of installations, it supports over 20 platforms, and is used by some of the largest internet sites in the world. MySQL is a safe choice for open source database storage. PostGresSQL is another mature, stable, and safe choice. Whereas MySQL supports a number of storage back-ends, PostGresSQL is famous for offering pluggable procedural language utilities, which offer some alternative advantages that we will discuss.
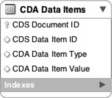
Using a RDBMS to handle our analytical requirements would require traditional data schema design and data transformation. A relational schema would be created that supports storing each and every data field from the clinical document. CDA is quite extensive and flexible, so to cover longitudinal scenarios, across a spectrum of providers and EMR systems, a generalized approach is needed; indeed, a generic table structure that allows new data items to be stored as rows could be created. A meta-data model would then need to be designed and administered to define what each row meant, such as that in Figure 20.7.
Such a data model is extremely flexible in the face of many requirements and an ever-changing landscape of healthcare data. The problem with it is that at large scales it will not perform well, and it will be cumbersome to work with. The variation of the data that would be held in the 'CDA Data Item Value' column and the number of rows produced by un-marshaling the CDA XML will prove to be a challenge for scalability and a productivity hit for developers. It seems that to get the level of flexibility desired for longitudinal medical records sacrifices the very reason for having a relational database!
An alternative design would be to store the entire clinical document directly in the database. Many commercial relational databases provide extensive XML support as a native data type. This allows easy storage, intelligent search, and manipulation of XML using powerful and familiar standards such as XPath and XQuery. MySQL does not support XML data types natively, but does support some basic procedural functions to help translate XML to and from the data model. When storing raw XML in MySQL, the best option is storing it in the TEXT data type and manipulating it with a programming language. Using the TEXT data type allows use of MySQL's full-text search capabilities to find specific content en masse. However, this approach may cause issues with the accuracy of results compared to a search mechanism that understands the differences between the tags, the attributes, and the data. A better alternative for storing raw XML would be a specialized database such as BaseX, or eXist-db. These databases can be paired with MySQL such that the raw XML is stored in an alternative location. However, an easier alternative is to skip the use of a relational database altogether and use a NoSQL database instead.
20.6.1 A NoSQL approach
NoSQL databases offer significant application development productivity benefits due to the ease of access from an object-oriented development environment and due to the lack of rigidity required in the definition of the schema. Specifically, in clinical analytics, they offer the ability to store longitudinal clinical documentation more efficiently as the intersection of many different EMR data models does not need to be pre-established.
Additionally, these databases are ready for the massive scalability and redundancy required to handle an entire region's clinical documentation en masse. Certainly relational databases can scale, but the total cost of ownership with these next-generation databases is demonstrably less. In fact, we would argue that NoSQL databases are the best for both simple agile projects and applications, and for extreme scale or highly distributed data stores. Medium-sized platforms with plenty of rich transactional use-cases and rich reporting will probably remain best suited for a relational database.
The first major success of the NoSQL storage paradigm was by Google. Google built a scalable distributed storage and processing framework called Google File System, BigTable and MapReduce [13–16] for storing and indexing web pages accessible through their search interface. These were all donated to Apache for open source development as a set of Hadoop [17] frameworks. BigTable is simply an extremely de-normalized, flat, and wide table, that allows any type of data to be stored in any column. This schema provides the ability to retrieve all columns by a single key, and each row retrieved could be of a different columnar form. This is similar to pivoting the relational model discussed earlier.
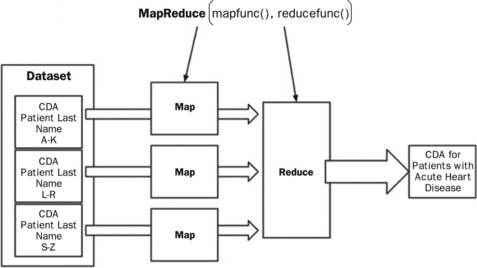
MapReduce is a powerful framework that combines a master process, a map function, and a reduce function to process huge amounts of data in parallel across distributed server nodes. Because the map functions can contain arbitrary code, they can be used to perform extremely expensive and complicated functions. However, due to the framework they must return results via an emit function to a data (or value) reduction phase. The reduction phase can also process the intermediary data with any logic it wishes so long as it produces a singular (but possibly large) answer. Figure 20.8 shows a simple data flow where a map function reviews CDA for large segments of population. Using UMLS one could look for all medical codes that imply the patient has an acute heart disease. Each map function would then put each resulting data set to an intermediary location. The master process would then coordinate the hand-off to reduce functions that then combine the intermediary data set into one final data set.
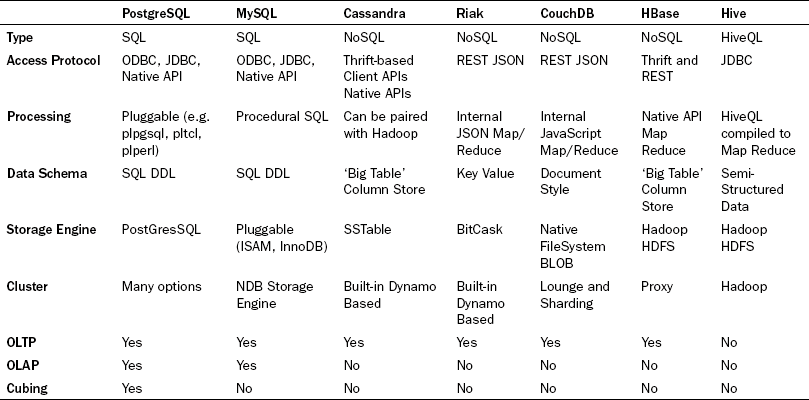
The success of this architectural breakthrough led to many other uses within their product suite. Seemingly in parallel, all the largest major internet sites that handled 'Big Data' had approached this problem by building or utilizing (and subsequently making famous) various products that exist in this realm. Public recognition accelerated when Google and Facebook [18] donated their inventions to the open source community via Apache. Finally, Amazon [19] paid the methodology a final dose of respect by allowing the frameworks to be accessed publicly, for a fee, via Amazon Web Services. Now the landscape is ripe with tools and technologies targeted at the NoSQL and Big Data paradigm. Table 20.1 summarizes the database technologies discussed here, and some of their common characteristics.
Each of the four NoSQL databases store data using a global primary key/value pair. Each key is scoped to a namespace (also called a bucket or a partition), which allows the system to identify each piece of data uniquely. This is logically analogous to the 'CDA Document ID' or the 'CDA Data Item ID' in the 'CDA Data Items' table, in Figure 20.7 . However, the database's intrinsic understanding of this allows each of these engines to distribute the data for native sharding across distributed disks and distributed server nodes. This is similar to implementing table partitioning across the 'CDA Data Item', although in the case of the NoSQL clustering capabilities, it is built in, easy to administer, and native to the basic clustering methodology. This also mandates extremely simple query interfaces for storing and retrieving groups of data. These interfaces do not allow the messy unpredictable joins, and thus provides a very uniform buffering and disk IO usage pattern that allows the databases to be tuned and engineered for high reads. Finally, many of them provide lightning fast writes due the simplification of the locking mechanisms by requiring writes to simply be an append operation while versioning the entire set of data.
With all of these advantages, the tradeoff is a modified, but surprisingly simple, application development architecture. Use-cases become more modular and web interfaces become mash-ups of many different services hitting many different database clusters. Fat use-cases begin to disappear because the complicated joins that produce them cannot be accomplished. (Note: this is also partially true for the 'CDA Data Items' table in the RDBMS example.) The methodology also has a major drawback of not allowing traditional widespread access to the data by non-programmers. One solution to provide traditional SQL access for non-programmers is to use Hive on top of the HBase system. It does not fully replace the capabilities of RDBMS, but at least it gives a familiar entry point.
To further understand the value of these approaches in this domain, we will explore two systems that provide good insight into the power of NoSQL, namely Cassandra [20] and Riak [21]. Cassandra was contributed to Apache from Facebook, and is an example of a NoSQL column store database. Like the others it is still driven primarily by key/value access, but the value is built of a structured but extremely 'de-normalized' schema to be stored under each key, called a ColumnFamily. The most powerful aspect of this being that the number of practically usable columns is not fixed; in fact the maximum number of columns supported is over two billion! Each of these columns can be created ad hoc, on the fly, per transaction. This far exceeds the level of flexibility of new data items that might be expected in clinical documentation. Cassandra takes this one step further and allows for SuperColumns. A SuperColumn is essentially a column that supports additional columns within it. For example, this allows the ability to specify the patient as a SuperColumn, with the first name and the last name being subcolumns. The key/value, ColumnFamily, SuperColumn model provides a nice mix of highly scalable, highly flexible storage and indexable, multidimensional, organized data.
Like most if not all NoSQL databases, Cassandra scales very easily. What sets Cassandra apart is its ability to give the developer control over the tradeoffs of consistency, availability, and partitioning (CAP). The CAP theorem [22], first proposed by Eric Brewer [23] at Inktomi, submits that in any single large-scale distributed system, one can pick any two of the three fundamental goals of highly available, scalable, distributed data storage. The designers of Cassandra prioritized partitioning and availability, and allowed consistency to be selected by the application developer at a cost of latency. The design decision to allow these tradeoffs to be tuned by the developer was ingenious, and more and more architectures are moving this way. Medical use-cases typically experience low concurrency requirements (medical records are updated every few hours rather than every second). Therefore a tolerance to consistency issues should be reasonable.
Cassandra is based on a distributed storage scaling architecture made famous by Amazon, called Dynamo [24]. Cassandra provides clustering and data replication with a peer-to-peer architecture and easily configured parameters (even per query) for the numbers of nodes to successfully respond with a successful read or write. Each node does not need to have the correct replica of each data item. Versions are automatically tracked via timestamps, and, on reads, inconsistent nodes are repaired automatically. These settings can be applied per query and can be tailored based on how critical it is that the data are guaranteed to be the latest or guaranteed to be written.
Riak is another NoSQL database based on the dynamo clustering architecture, and thus the clustering and consistency is similar to Cassandra. Riak is a polished, but young, open source technology produced by Basho that improves on the Cassandra capabilities by offering simpler and easier to understand programmatic access and clustering capabilities. In fact, Riak offers an extremely easy to use RESTful/JSON access mechanism that greatly simplifies web development. Although Riak can support all content types, the native indexing and awareness of JSON for structured data will lead to a natural tendency to standardize on JSON throughout an entire application. For CDA though, this means that an XML to JSON converter must be used to take full advantage of this.
Although Riak's JSON support allows it to support constructs like the Column and SuperColumn features, it furthers this ability by supporting links. Links provide innate relationships between the flexibly structured key/value pairs. The ability to add links to the data supports an ability to model named (or typed) relationships between entities. On top of this modeling, Riak supports link walking within MapReduce functions, which allows semi-relational capabilities. Figure 20.9 shows an example of a simple Riak http query that an application tier might submit to the database. The first portion of the URL points to the Riak Cluster domain name, specifies to use the Riak bucket called 'patients', and specifies to retrieve the patient identified by 'uniquepatientid'. The second part of the http query is a Riak convention that supports walking links. The template for this link walking section is '_,_,_', with an underscore being convention to not filter on this field. The first underscore filters on the bucket, the second portion filters on the link type, and the third portion filters on the actual id. In this example, patient demographics and three CDA documents corresponding to history and physicals are retrieved, using an OID to identify each unique document held by the system. This also highlights the simplicity and power of querying via a RESTful API on flexible data structures.
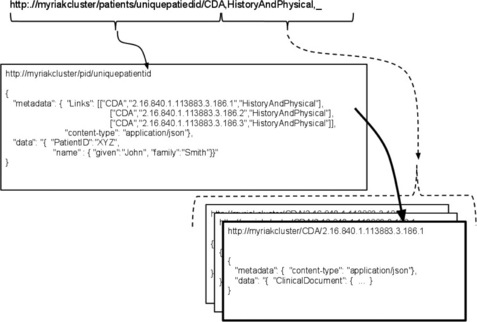
In this case, a MapReduce function would walk these links and inspect each clinical document data segment. Algorithms would then inspect the data for all medical codes, and map each medical code through the UMLS vocabulary set. All documents with indications of acute heart disease and the related data required would then be delivered to the reduction phase, ready for processing via analytics engines.
20.7 Analytics
As discussed above, there are many architectural options for storing CDA in flexible schemas in large scalable distributed databases. A range of transactional methodologies for working with these data are also possible. The next challenge is to make sense of the wealth of content, how do we visualize it, and how do we become confident of the contents of potentially petabyte storage?
Clinical analytics is fraught with complexities in this area, and indeed the market is in its infancy, especially in open source. The mathematical and programmatic foundations are strong and companies like Google and Twitter [25] are bringing meaning to massive amounts of dirty data. A smorgasbord of topics like population health, pay for performance, accountable care organizations, clinical trials, risk adjustment, disease management, and utilization statistics are about to undergo a golden age of understanding, intelligence, and adoption. The rollout and standardization of medical records through initiatives like HL7, IHE, and Health Story are producing immense amounts of structured data exactly for this purpose. It is time to start analyzing these data in aggregate!
Data in aggregate come with a large set of challenges. Mathematicians and statisticians have been hard at work for centuries developing techniques to understand how to interpret small and large sets of data. The following is a short list of common capabilities and methodologies needed when studying clinical analytics.
![]() Linear/non-linear/curvilinear regressions – different levels of standard statistical methods to study the interdependency between variables. Examples: what is the relationship between smoking and lung cancer? What is the relationship between birth weight and health outcomes?
Linear/non-linear/curvilinear regressions – different levels of standard statistical methods to study the interdependency between variables. Examples: what is the relationship between smoking and lung cancer? What is the relationship between birth weight and health outcomes?
![]() Statistical classification – algorithms for specification of new sets based on patterns learned from previous sets of data. Examples: used in natural language processing of medical text. A new disease outbreak has been discovered, what known patterns does it exhibit?
Statistical classification – algorithms for specification of new sets based on patterns learned from previous sets of data. Examples: used in natural language processing of medical text. A new disease outbreak has been discovered, what known patterns does it exhibit?
![]() Clustering – algorithms to identify subpopulations and to study the identities and characteristics of those subpopulations. Example: what are the different lifestyles, cultures, or age groups associated with different types of diabetes?
Clustering – algorithms to identify subpopulations and to study the identities and characteristics of those subpopulations. Example: what are the different lifestyles, cultures, or age groups associated with different types of diabetes?
![]() Pattern-mining – a method of data-mining to find repeatable situations. Example: what behavior patterns exhibit a likelihood of alcoholism?
Pattern-mining – a method of data-mining to find repeatable situations. Example: what behavior patterns exhibit a likelihood of alcoholism?
![]() Dimension reduction – process of removing dimensions to simplify a problem for study. Examples: when determining the relative cost of a disease, remove variables associated with geography or wealth. Uncovering the molecular variation of certain cancers.
Dimension reduction – process of removing dimensions to simplify a problem for study. Examples: when determining the relative cost of a disease, remove variables associated with geography or wealth. Uncovering the molecular variation of certain cancers.
![]() Evolutionary algorithms – understanding impacts of repeated conditions. Examples: what impact on health do certain policy changes cause? Could a certain method of continual treatment have been a contributing factor over time?
Evolutionary algorithms – understanding impacts of repeated conditions. Examples: what impact on health do certain policy changes cause? Could a certain method of continual treatment have been a contributing factor over time?
![]() Recommenders/collaborative filtering – methods to identify likelihood of one group to share common traits with other groups who exhibit certain traits. Example: potential for understanding reactions to drugs based on the reactions of other similar users.
Recommenders/collaborative filtering – methods to identify likelihood of one group to share common traits with other groups who exhibit certain traits. Example: potential for understanding reactions to drugs based on the reactions of other similar users.
But how should analysts bring these algorithms and the massive amounts of flexibly structured data together? This is an exciting field and quite immature, but below we review how the industry has begun to piece together the constituent parts to make this happen. There are several options and the Business Intelligence (BI) stack companies, Pentaho [26] and JasperSoft [27], have begun to assemble SQL and NoSQL connectors, statistics packages, analysis packages, ETL packages, and Cubing and OLAP packages. Table 20.2 shows several options for different capabilities in different stacks and platforms.
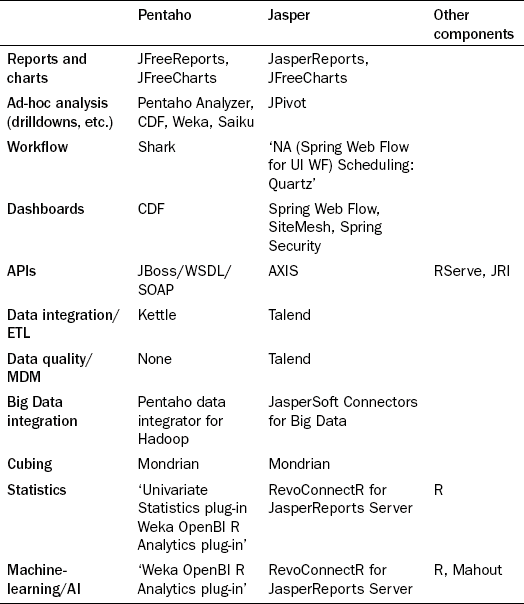
Pentaho Open BI Suite is a complete packaged suite for business-enabled reporting solutions. The community edition is open source and the breadth of functionality is very thorough. The solution is very business-oriented, and its target use-cases are guided by a philosophy of actionable reporting through complete round-trip business processes that supports alerts and scheduling. From a visualization perspective, Pentaho delivers a portal-based product that allows administrators, reports designers, and reports users to define, design, and deliver reports and charts. It has a robust plug-in capability that allows others to replace or add to many of the components currently embedded. A central meta-data repository maps the physical database from the logical visualization tier. The portal and the meta-data model work together to allow users to define reports and charts via JFreeReports and JFreeCharts.
To handle extreme scales of future clinical data, many different slices of the data will be produced, based on the clinical problem being solved. For example, a database whose data model is only focused on the factor of heart disease may be created and loaded with information only from medical records from patients with this condition. Data would be extracted from the flexible data store, subjected to semantic and clinical normalization, and transformed into a view that can more easily be navigated. As discussed above, the desire is to create an architecture that allows the raw CDA to be re-processed based on the current rule set of interest. In the study on acute heart disease, analysts might later find that a new factor exists and might want to re-build the data mart to include this. Thus, the best path is a tradeoff between processing power and finding the perfect data model, and in our experience, the quest for the latter only delays projects.
There are several open source options for ETL. The two predominant ones would be the Pentaho Data Integrator, which is built on Kettle (sponsored by Pentaho Corporation), or Talend, which is used by JasperSoft. The Pentaho Data integrator seems like a very good option for this problem set. Not only has it been proven to be a solid choice for relational mapping, it seems to lead the pack in support for Hadoop and MapReduce integration. This framework allows for producing new mappings or rule sets to evaluate against raw data sources, and economically scaling this across a cloud-based compute cluster. We would recommend the following staged process:
1. UMLS selection of all code sets indicative of acute heart disease;
2. map selection of raw data set from NoSQL;
3. MPI normalization (or other if not focused on patient centricity);
Talend would be another good choice for this, although its native support for NoSQL databases and MapReduce processing is not very strong. JasperSoft integrates Talend into their suite for ETL, Master Data Management, and Data Quality. This partnership forms a strong data management solution. JasperSoft has recently released a set of NoSQL connectors for native reporting directly from NoSQL databases; however, it is unclear how well this works or scales.
Once the data are in the required form, they can be analyzed. There are a few really good open source options for this. The R Programming Language is an open source statistics, mathematics, and visualization toolset, on par with SAS and Stata capabilities. Its for-profit sponsorship comes from a company called Revolution Analytics [28]. The basics of R support datafile manipulation, text manipulation, probability, math, statistics, set manipulation, indexing, and plotting functions. The R community have created numerous frameworks that form a large suite of capabilities. Two important frameworks used by Open BI to produce a Pentaho plug-in are RServe, a TCP/IP server to R the environment, and JRI, a Java to R language interface. Some plug-ins and utilities for MapReduce and Hadoop have also been created; however, many are not very active. With the Java R Interface it is easy enough to include these into NoSQL MapReduce programs. Both Pentaho and Jasper provide R plug-ins for advanced statistical analysis within their portals. Although R is arguably the most mature technology in this category, Pentaho sponsors Weka [29]. Weka is a set of Java libraries that perform various statistics, machine-learning, and predictive algorithms. Weka is a strong, well documented, but separately built utility. We expect to see powerful integrations with the Pentaho suite in future.
With the capabilities of the Hadoop suite under its wing, one would fully expect Apache to embrace the statistics and machine-learning algorithms, which are indeed provided by Mahout [30]. Written to integrate with MapReduce algorithms, Mahout is a very promising statistics and machine-learning library. However, currently it does not yet have broad coverage of standard algorithms. The trend is clear, as we get further away from the standard stack, available solutions begin to thin out. To fill out the stack it is critical to consider online analytical processing (OLAP) technologies that support the ability to build cubes. Cubes are multidimensional data structures that support pre-computed aggregations and algorithmic slices of data. The only viable option for open source OLAP databases is Mondrian [31], sponsored by Pentaho, and it has a broad user base. Mondrian is also used by JasperSoft. For bringing content from cubes into web-based pivot tables, one should consider Saiku [32], which has beautiful usability, supports RESTful OLAP Queries, and a Pentaho plug-in.
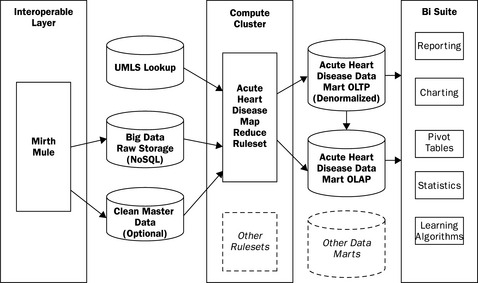
20.8 Final architectural overview
This chapter gives an overview of the state of the technology industry when it comes to scaling clinical analytics using open source software. Reviewing the architecture in Figure 20.10, we observe that there are several standard toolsets on the back-end that have risen to become standards. Mirth, UMLS, and MySQL are mature and capable. Moving to the right through the figure shows products and/or integrations that are younger but promising. NoSQL and MapReduce are proven by the giants, but they do require capital, engineering sophistication, and effort to make use of them. Some of the open source BI tools are mature, whereas others are not, and it is not clear which integrations will be successful and active in the community.
Seamless generalized use-cases across this architecture still require a large amount of engineering and are best left to the product companies. Most information technology organizations should continue to select narrow deployments for their BI tools, but should start to utilize some of these toolsets to begin to understand how they best fit into their organizations. If an application requires adherence to 21 CFR Part 11 validation, one must tread carefully as the abilities of these tools may cause an insurmountable testing challenge, something discussed in more detail in Chapter 21 by Stokes. Focusing on narrow use-cases that may turn out to exhibit an immediate return and an amazingly low total cost of ownership is always a good approach.
Applications in a position for high-growth volume and a potential for constant performance ceilings should deploy in the cloud and be prepared with tools that scale up with ease. Prioritize the ability to be agile at large scales. Accept that failures will occur and that mistakes will happen and use tools that will allow for recovery from issues. We believe, as many of the largest scaling internet companies do, that the open source toolsets discussed here meet that mark.
A final note on the Semantic Web, discussed in detail in the chapters by Wild (Chapter 18) and Bildtsen et al. (Chapter 19). Although perhaps not immediately apparent, in many respects these two technologies are compatible. Analytics can help gather insight into trends or population conditions that can help steer clinical research. The Semantic Web is seen as the technology that will allow us to codify artificial intelligence that is gleaned from the raw data. Eventually, semantic-based rules could be embedded into our MapReduce or machine-learning statistical utilities to speed up the data selection and interpretation.
20.9 References
[1] http://www.irs.gov/newsroom/article/0,id=204335,00.html
[2] http://www.emrconsultant.com/education/hospital-information-systems.
[3] http://www.hl7.org/newsroom/HL7backgrounderbrief.cfm.
[4] http://hl7toolkit.sourceforge.net.
[5] http://www.mirthcorp.com/community/mirth-connect.
[7] http://couchdb.apache.org.
[9] https://www.cms.gov/icd9providerdiagnosticcodes.
[10] http://en.wikipedia.org/wiki/SNOMED_CT.
[11] http://www.nlm.nih.gov/research/umls/Snomed/snomed_main.html.
[12] http://www.mysql.com/.
[13] http://code.google.com/opensource.
[14] http://labs.google.com/papers/gfs.html.
[15] http://labs.google.com/papers/bigtable.html.
[16] http://labs.google.com/papers/mapreduce.html.
[17] http://hadoop.apache.org.
[18] https://developers.facebook.com/opensource.
[19] http://aws.amazon.com/what-is-aws.
[20] http://wiki.apache.org/cassandra.
[21] http://wiki.basho.com.
[22] http://www.cs.berkeley.edu/brewer/cs262b–2004.
[23] http://en.wikipedia.org/wiki/Eric_Brewer_(scientist).
[24] http://www.allthingsdistributed.com/2007/10/amazons_dynamo.html.
[25] http://twitter.com/about/opensource.
[26] http://community.pentaho.com.
[27] http://jasperforge.org.
[28] http://www.revolutionanalytics.com.
[29] http://www.cs.waikato.ac.nz/ml/weka.
[30] http://mahout.apache.org.
Cloudera Hadoop. Available athttp://www.cloudera.com/company/open-source/. Accessed August 23, 2011.
Couchdb Wiki. Available at: http://wiki.apache.org/couchdb/. Accessed August 23, 2011.
IHTSDO: International Health Terminology Standards Development Organisation. Available at: http://www.ihtsdo.org/. Accessed August 23, 2011. No-SQL Reference. Available at: http://nosql-database.org/. Accessed 12/11/11.