
And oftentimes excusing the fault
Doth make the fault the worse by excuse.
King John, William Shakespeare
CONETNS
13.1 Introduction and Device Classification
13.2.1.1 The Rocker Switch Mechanism
13.2.1.6 Switching Devices Used below 0.5 A
13.2.2.2 Thermostatic Controls
13.2.2.3 Electro-Mechanical Relay
13.3 Design Parameters for Static Switching Contacts
13.3.1 Small-Amplitude Sliding Motion
13.3.2 Contact Force and Contact Materials
13.3.2.1 Contacts at Current Levels below 1 A
13.3.2.2 Contacts at Current Levels between 1 and 30 A
13.4 Mechanical Design Parameters
13.4.1 Case Study (1): Hand-Operated Rocker-Switch Mechanism
13.4.1.1 Moving-Contact Dynamics of a Rocker-Switch Mechanism
13.4.1.2 Design Optimization of a Rocker-Switch Mechanism
13.4.2 The Opening Characteristics of Switching Devices
13.4.2.1 Moving Contact Dynamics at Opening
13.4.3.2 The Coefficient of Restitution
13.4.3.3 Impact Mechanics for a Pivoting Mechanism
13.4.3.4 The Velocity of Impact
13.4.3.8 Design Parameters for the Reduction of Contact Bounce
13.5 The Measurement of Contact Wear and Contact Dynamics
13.5.1 The Measurement of Contact Surfaces
13.5.2 Three Dimensional (3-D) Surface Measurement Systems
13.5.3 Case Study (2): Example of Volumetric Erosion
13.5.4 The Measurement of Arc Motion and Contact Dynamics
13.6 Electrical Characteristics of Low-Current Switching Devices at Opening
13.6.1.1 Arc Voltage Characteristics
13.6.1.2 Voltage Steps below 7 A
13.6.1.4 Opening Speed and Arc Length
13.6.1.5 Case Study (4): Automotive Systems
13.6.2.1 Ag and Ag/MeO Contact Erosion/Deposition
13.6.3.1 Typical Waveforms and Arc Energy
13.6.4.1 Point-on-Wave (POW) Studies Using Ag/CdO Contact Materials
13.7 Electrical Characteristics of Low Current Switching Devices at Closure
13.7.1 Contact Welding on Make
13.7.2 Reducing Contact Bounce
13.7.4 Influence of Velocity during the First Bounce
13.7.5 Bounces after the First
13.7.6 Summary of Contact Bounce
13.8.3.2 Reducing Contact Bounce
13.8.3.3 Arcing during the Bounce Process
13.1 Introduction and Device Classification
In this chapter, consideration is given to the events occurring when switching low current, typically up to 30 A, at voltages below 300 V. Switching devices used in this range are normally mass produced and are generally optimized for a low number of component parts. It has been shown in the previous chapters that the phenomena associated with switching contacts and stationary contacts can be both complex and difficult to predict. The weakness and potential for failure of the electrical contact interface stems from the extreme operating conditions implicit with the interface. Some of the major mechanisms leading to failure are chemical corrosion owing to the environment, arc erosion, material transfer in the plasma developed between the contacts at opening and closing, and mechanical wear owing to sliding, rolling, and fretting motions. Often the overall wear can be a complex interaction of these processes, the study of which has necessitated an interdisciplinary approach. In addition to the electrical contact phenomena, a switching device will also be influenced by the mechanical action of the mechanism used. The mechanism used in a low-current device can often appear to be simple; however, in-depth studies reveal complex mechanical dynamic characteristics during switching.
Low-current switching devices are used in a range of products, for example; vehicles, domestic appliances, and consumer electronics. There are many variants of the low-current switch; however, in general there are two main groups, hand-operated devices and actuated devices. The former group includes devices such as rocker and push-button switches while the latter includes limit switches, thermostatic controls and electromagnetic relays. Devices used in the automotive sector operate at dc voltages between 12 and 300V, while in the consumer market the supply is usually the local distribution voltage. Other consumer products, such as keyboards and electronic devices, generally operate below 12V dc.
The automotive sector has seen rapid changes from the traditional 12–14V dc power supply. There was a period between 1990 and 2000 where a 42V replacement was considered. This was found to be limiting and is discussed here. Innovations that are more recent have seen the introduction of battery voltages for hybrid systems of 144V, and 288V; and of 345V for pure electric vehicles. Some systems use a convertor/inverter with an output of 650V ac. The area of automotive power systems is a rapidly evolving area; the fact remains that dc voltage levels are increasing above the traditional 12–14V level.
The evolution of low-current switch design has resulted in smaller devices with smaller operating forces and in the optimization of contact materials for particular applications. However, the reduction in size at a given current loading is limited by ergonomics; a hand-operated switch cannot be reduced in size to the point where the hand is unable to effectively operate the device. The size of a switch used to isolate a distribution voltage supply is also dominated by the need to maintain isolation distances between the conductors (see Section 9.3) and also the need to switch both the live and neutral conductor simultaneously. The isolation requirement has a direct influence on the contact gap used in a switch, and as will be seen in Section 13.4, the gap will also have a direct effect on the switching dynamics as well as the arc erosion characteristic.
The arc drawn when the contacts open causes contact erosion, but often the most severe operating condition is experienced when switching onto loads with a high inrush current. A current several times the rated operating current can flow as the switch contacts close to make the circuit. Contact bounce with high current can lead to welding of the contacts as well as severe arc erosion. We therefore need to understand the dynamics of the contact mechanism both at opening and closing (referred to here as “make” and “break” operation).
This chapter starts (Section 13.2) by describing various types of device that are used to switch low current. The aim here is to describe the general operation of a device and not to describe the design of specific mechanisms or devices. Static contact characteristics are considered in Section 13.3, with a subsection discussing the selection of contact force and the importance of small micro-motions on the switch contacts. Section 13.4, considers the closing operation, referred to as the “make” and the opening operation, referred to as the “break.” Section 13.5, considers new approaches to the measurement of the mechanical characteristics of surfaces and to mechanism dynamics. The final sections (Sections 13.6 and 13.7), consider the electrical perspective to consider the contact erosion and wear resulting from arcing. To elaborate on the issues discussed, there are a number of numbered case studies within the sections.
The majority of switches are designed such that the motion of the moving contact is ideally independent of the actuation method. With a hand-operated switch, the hand is used to move the switch to a position where a snap-action mechanism takes over the moving contact motion. This is also the case with a limit switch, although the actuation will be produced by a system-dependent movement, for example a thermostatic control switch will operate on a very small displacement generated by an expansion chamber, or other temperature-sensitive transducer. The ideal independence between the moving contact and the actuator is difficult to achieve and in many devices, the moving-contact dynamics is often affected by the actuation. In an electromechanical relay, the moving-contact dynamics is often a result of the interaction of the moving-contact system and a solenoid.
The following subsections give a brief overview of some typical types of devices used in low-current switching. These are considered in two categories, firstly, hand-operated mechanisms and secondly, actuated mechanisms.
In this section, a range of hand-operated switching devices are described. Most have a wide range of variants, including single-pole (a single switch), double-pole (two switches in parallel controlled by a single actuator), change-over, and on-off configurations. In addition, momentary actions (a switch, which is held closed by a hand) and lamps (to indicate a condition) can be added. In switching a domestic supply voltage, the single-pole configuration is used to switch a live conductor only and is, therefore, normally used in appliances which are mobile and can be disconnected from the supply. The single pole configuration is also commonly used in wall-socket and lighting switches. A double-pole configuration is used to switch both a live and neutral conductor and is normally used in appliances, which remain connected to a supply. The change-over configuration is generally used to switch between circuits.
13.2.1.1 The Rocker Switch Mechanism
The rocker switch is the most widely used hand-operated switching device utilized in the low-current range (1–16 A); it is also used widely in applications below 1 A. It is commonly used in consumer products, and for general-purpose switching, for example, lighting circuits and computer power-supply switches. The switch mechanism is designed to have a snap action. A typical design is shown in Figure 13.1 Rocker switches can be designed in two basic configurations, make-up and make-down. In the make-down arrangement, the main fixed contact is mated with a moving contact which is moved downwards to close the switch. The design illustrated in Figure 13.1 has a make-down mechanism, which is shown schematically in Figure 13.2. Figure 13.1 can be used to identify the component parts.
A snap-action is used such that the moving blade contact moves independently of the hand forces after the toggle position has been reached. The toggle position corresponds to the center-line of the switch, shown in Figure 13.2. The switch is shown in a change-over configuration, with the main fixed contacts on the base of the switch; the current path is therefore through either of the main contact pairs depending on the rocker position and the central pivot contact. The contact force is provided by the spring-loaded plunger, which is also used as part of the snap-action mechanism, such that when the plunger is over the central pivot the moving contact can move under the force provided by the spring. The switch can be modified for the on-off configuration, shown in Figure 13.3, where in this case the main contact on the right is removed and replaced with a stop.
Figure 13.4 shows a make-up change-over arrangement. In the make-up arrangement, the contact force applied to the moving contact acts upwards. In this case, the fixed main contacts come through the base of the switch and lie above the moving contact. The change-over configuration can also be obtained using a combined make-up and make-down configuration, shown in Figure 13.5. A further design of rocker-switch mechanism is shown in Figure 13.6. This shows a “hair-spring” moving contact, which can be used both with and without a spring-loaded plunger. In the case of the “hair-spring” device the contact force is provided by the mechanism, and no additional spring is necessary.
The simplicity of the mechanism and the small number of parts in the assembly, eight in the case of the single-pole switch shown in Figure 13.1, is a major factor in the production of such switches. The rocker-switch design dominates the hand-operated switch market because of its inherent flexibility.
The rocker-switch design has been in use for many years and has evolved through empirical developments. Mathematical models of the switch dynamics have been developed and resulted in improvements in some of the operational characteristics. A model is presented in [1,2,3]. In common with most hand-operated devices, the switch has two areas of electrical contact, the main switch contacts, and the interface between the moving contact and support, referred to as the pivot interface in Figure 13.1. It is common for arc erosion to occur at both these interfaces.
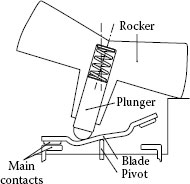
FIGURE 13.1
Schematic of a “make-down,” “change-over" component parts identified. The blade is the moving contact.
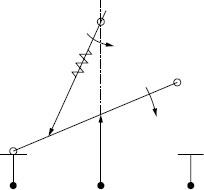
FIGURE 13.2
Rocker-switch layout corresponding to the “change-over” mechanism shown in Figure 13.1, showing the spring and direction of movement when the switch is actuated in one direction.
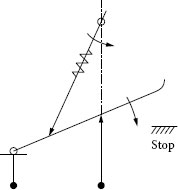
FIGURE 13.3
Rocker-switch layout for an on-off configuration, showing the main contact on the left. The blade or moving contact would be shaped to provide the contact gap required.
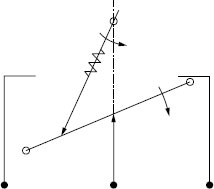
FIGURE 13.4
Rocker-switch layout corresponding to the “change-over,” “make-up” configuration, showing the spring and direction of movement when the switch is actuated in one direction.
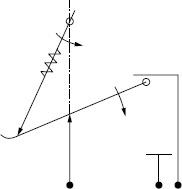
FIGURE 13.5
Rocker-switch layout corresponding to the “change-over,” “make-up” and “make-down” configuration, showing the spring and direction of movement when the switch is actuated in one direction.
A typical lever switch arrangement is shown in Figure 13.7; it is similar to the rocker switch, although the hand operation is applied to a lever rather than the rocker actuator, shown in Figure 13.1. The internal mechanism of the device is often similar to a rocker switch.
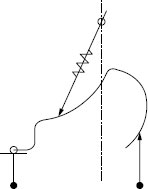
FIGURE 13.6
Rocker-switch layout for an on-off “hair spring” configuration, showing the main contact on the left. The blade in this case is flexible, and spring such that when the contacts are made the contact force is supplied from the blade deflection. The pivot point is offset to the right of the rocker pivot point.
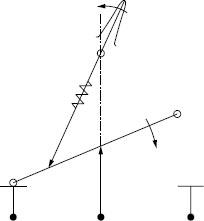
FIGURE 13.7
Rocker-switch layout corresponding to the “change-over” mechanism shown in Figure 13.1, showing the spring and direction of movement when the switch is actuated in one direction. In this case the rocker shown in Figure 13.1 is replaced with a lever actuator.
The slide switch is often used to switch between two conductors and is generally used at the lower end of the low current range; usually for a voltage, or functional selection applications switching electronic signals typically 10−2 A, 5 V. It is not often used as an isolating switch, and is referred to as a micro-gap switch since the separation between live parts is less than that required for isolating a supply voltage. Figure 13.8 shows a typical schematic diagram of a switch mechanism. The principal switching action of the device is a sliding or wiping action. Arcing can occur between the contacts, which are usually lubricated.
The rotary switch is a similar design to the slide switch and is again often used for functional selection, or voltage selection applications. The device can be designed for isolation requirements.
A push-button switch arrangement is shown in Figure 13.9. In this case, Figure 13.9 shows a simple arrangement where the contacts are mated as the push-button is pressed; the latching action is provided by the elasticity of the spring contacts, and the contacts are released by pulling the contacts apart. The latching action can be made more effective using a cam design, where a follower moves with the actuation of the push-button and latches into the closed position. To release the switch, the button is pushed which then releases the latch, allowing the contacts to open. These switches are generally used for on-off operations, and require two sets of main contacts in an arrangement similar to that used in contactors, with a bridge moving contact. The double-pole configuration can be accommodated but the changeover configuration is not generally used. Push-button switches are generally larger and have a greater number of parts than the equivalent rocker switch. The use of the cam type follower is not so robust as the rocker-switch design and is more prone to mechanical failure. This type of switch is often used where the push-button action is more desirable than the rocker-switch action. Its selection is thus often related to ergonomic design considerations.
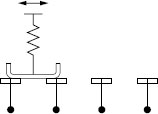
FIGURE 13.8
Slide-switch layout showing four terminals and a sliding bridge contact.
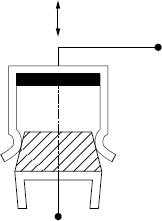
FIGURE 13.9
A simple push-button device with two terminals. The device makes contact when the upper contact is pushed into contact with the lower conductor.
13.2.1.6 Switching Devices Used below 0.5 A
There are a large number of devices used to switch current less than 0.5 A. At the low-current and low-voltage levels associated with switching electronic circuits, the applications can range from mobile phones, computer keyboards, electronic piano keys to membrane switches; [4,5]. In general at the low-current level typical of electronic switching there is no arcing, although a molten metal bridge may be formed [6], see Section 9.4.2. At these current and voltage levels, gold and other precious metal alloy contact materials can be used and with a robust mechanical design, devices are able to operate over millions of switching cycles [7]. As the current level increases above the minimum arc current level, silver-based contact materials are used.
A typical device for electronic switching is the membrane switch as shown in Figure 13.10. Upon hand actuation, the two parallel conductors are forced together. This type of switch offers an ultra-thin profile; both tactile and non-tactile soft touch operations can be designed into the arrangement. The contact material is often a carbon film while the lower surface can be a PCB coated with a gold layer [5].
Actuated switches can be separated into two categories. They can be triggered by small movements, for example, limit switches and thermostatic controls; or by an actuator, for example the electromechanical relay, where the contact motion is controlled by a solenoid. Developments in piezo-ceramics and memory metals have resulted in new possibilities [8].
Two typical arrangements are shown in Figures 13.11 and 13.12. For such switches to operate reliably, it is necessary that the external device operates with an accurately controlled movement and force. Although such switches may have mechanical and electrical lives in excess of 1 million operations, there are certain areas where this characteristic by itself is not a sufficient guarantee of certainty of operation. One such application is the guarding of machine tools. If the springs break in the device, there is no certainty that the elements of the switch will not produce a conductive path. In some systems, it is desirable that the guard should be able to start and stop the machine rather than merely act as a safety interlock; for this function some manufacturers use the “forced break” switch shown in Figure 13.12. This category of switching device, along with many of the others, can suffer from wear at both the main and pivoting contacts [9,10].
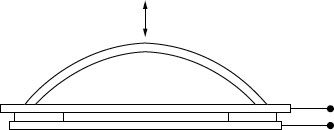
FIGURE 13.10
The membrane switch, showing a section through a device. The upper dome can be plastic or rubber which when pushed will force the upper contact surface to deform and make contact with the lower surface.
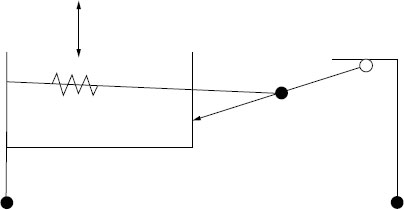
FIGURE 13.11
A limit switch layout in an on-off configuration. As the sprung-loaded element is forced down by an actuator the element will toggle the moving contact about the pivot opening the circuit.
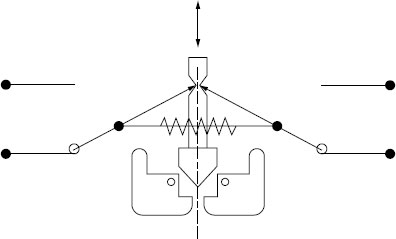
FIGURE 13.12
A limit-switch mechanism with a safety latch. As the central actuator is forced down the pair of moving contacts will pivot to the new position, and the actuator will latch requiring an upward force to release the latch.
13.2.2.2 Thermostatic Controls
These mechanisms are essentially mechanical bi-stable devices which when heated or cooled provide movement. There are a number of methods which can be used, for example a bimetal strip can be used which when heated deforms to either make or break a circuit, another method uses a thermal transducer to actuate a bi-stable sprung mechanism. In the latter example the mechanism produces instability in the neutral plane, hence the mechanism will not remain in a position where the force holding the contacts together is zero. The non-linear velocity characteristics produced by this toggle mechanism have been analyzed using high-speed photography and show velocities of 0.16 m s−1 [11,12,13]. The design of switches for use in thermostatic controls is usually influenced by the requirement to operate from a slowly moving, thermally actuated prime mover. To obtain adequate speeds for producing well defined points of closure and interruption, the switch contacts are often arranged in a snap-action bi-stable type of mechanism shown in Figure 13.13.
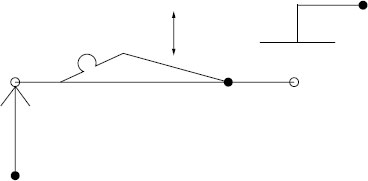
FIGURE 13.13
A thermostatic control switch, where the actuator action acts down upon the self-sprung cantilever; as the force is applied the element changes shape to move the contact upwards to make the circuit.
13.2.2.3 Electro-Mechanical Relay
The electromechanical relay is usually operated by an electromagnetic solenoid. A microprocessor can be used with a solid-state device to operate a relay coil which switches the relay contacts. The underlying principle also applies to contactors, which normally operate at a switching current above the range considered in this section. Current-limiting circuit breakers also use a solenoid action to operate a mechanism at high-speed to enable circuit protection (see Chapter 14).
There are many designs of relay configuration [14,15]. It was often suggested that the onset of power electronics would remove the requirements for electro-mechanical relays; experience has shown this to be far from the case. The electro-mechanical relay exhibits two critical characteristic, which are not possible to replicate in the faster power electronic devices; the open circuit breakdown voltage is very high, with no current leakage; and the closed circuit losses are small, while the contact resistance remains low. The electromechanical relay is still a critical component of many systems, and will remain so.
13.3 Design Parameters for Static Switching Contacts
In the closed circuit condition, the main requirement is for a low contact resistance path to minimize the voltage drop across the interface and thus reduce the heat dissipation in the contact. When switching contacts are closed the contact interface can be described by the equations which govern all electrical contacts (see Chapter 1); and from these equations, estimations can be made of the force required to maintain a stable contact resistance and to prevent the contacts separating unintentionally [16].
13.3.1 Small-Amplitude Sliding Motion
A sliding action can occur at a contact interface when there is a small degree of motion either before or after a switching operation. Sliding can also occur when contacts are closed as a result of external vibrations, or temperature fluctuations. The influence on the contact interface is considered in Section 1.5. When the contacts are closed the sliding motion is normally considered to act tangentially to the surface, and results in a change of contact area, which can lead to fretting wear of the contacts (see Chapter 7). Motion vertical to the surface will result in a reduction of contact force, and can usually be accommodated by the selection of a suitable contact force.
The motions, which can occur prior to the contact opening, fall into the same category as with the fretting motions, and are sometimes used to produce a lateral force to break any contact welds, which may have occurred. Wiping motion during the closing phase of a switching process will result in the two contact surfaces rubbing together at the instant the arc is extinguished. The surfaces will thus be at a high temperature, and small areas of molten metal may be present, which can result in an increased wearing of the contact surfaces. This effect can also help produce lower weld forces, and rupture contaminating films.
13.3.2 Contact Force and Contact Materials
13.3.2.1 Contacts at Current Levels below 1 A
The main consideration in the selection and design of contacts for use in light-duty applications (less than 1 A) is that the contact resistance should be kept as low as possible. At low-current levels overheating of the contacts seldom occurs, making the electrical conductivity of the material of less importance. Arcing effects can also be less significant. The mechanical force, which can be applied, is usually restricted by the physical size of the device. To ensure that the contact pressure is as high as possible the correct design of the contact shape is important, flat contacts are not normally used. Flat contact surfaces can trap dust particles between the surfaces. The use of a hemispherical or domed contact against a flat contact is a common arrangement. The materials used for light-duty applications are selected primarily for their resistance to tarnishing under a range of conditions. Alloys of platinum, palladium, and gold are used.
13.3.2.2 Contacts at Current Levels between 1 and 30 A
In the range between 1 and 30 A, contact materials are selected which match a good current-carrying capacity to a reasonable resistance to tarnish and arcing. The shape of the contacts used is of importance in ensuring low contact resistance and adequate dissipation of heat from the contact surface; and as with the low current, flat contacts are usually not satisfactory. The spherical radius of a domed contact is often selected as it gives the best compromise between the high contact pressure obtained with a small radius and the superior heat dissipation from the contact area that can be achieved with a large radius. Contact materials used in this range are covered in Section IV of this book, and are generally silver-based alloys. Silver-nickel (80/20) and (90/10) is used extensively in the range, but in the case where there is the possibility of a high inrush current as the contacts make, and contact bounce occurs, silver cadmium oxide was used, but its application has been limited in some jurisdictions for health related issues and been replaced by silver tin oxide.
To estimate the contact force requirement for a given contact system, consider the contact resistance. This has been shown in Equation 9.39 to be given by;
(13.1) |
The normal force (F) is shown to have a significant influence on the contact resistance. To estimate a static contact force, assume the contact spot temperature T to be the main parameter. If it is also assumed that the rate of corrosion is temperature-dependent, and with current passing through the contacts an elevated temperature will develop in the area of the constriction, it has been shown that the temperature at the contact interface can be approximated to [17]:
(13.2) |
Where, T is the temperature (in degrees Kelvin) at the center of the constriction, Vc is the potential drop across the constriction at a room temperature of 22°C, and the contact volt drop is given by
(13.3) |
Let us assume that for every 10°C rise in the contact spot temperature there is an approximate doubling of chemical reaction rates, which will greatly affect the reliability of the contact; then if 10 mV is taken as a critical volt drop across the contacts it can be shown that this will produce a 10°C rise in the contact region. Using Equations 13.2 and 13.3, the minimum contact force can be calculated for a given current rating. The force calculated is the minimum force for the assumptions made and does not account for external vibration, which can also lead to the contacts separating; thus, if a contact system is to be used in an environment with external vibrations, acceleration effects will need to be taken into account in evaluating a suitable contact force. At current levels outside those considered in this chapter additional contact force can be required to overcome electromagnetic repulsion forces (Section 10.4).
13.4 Mechanical Design Parameters
Mechanism dynamics are important in determining the reliability and endurance characteristics of a device. The dynamic response will have a direct relationship to the arc characteristic, affecting the duration of the arc, and contact erosion. The electrical contact materials used are also important as they provide the stable electrical contact interface when the contacts are closed and provide protection against arcing during both “make” and “break” operations. The contacts also offer protection against contact welding when contacts close. The selection of contact materials will be discussed in Section IV. The circuit parameters are also important, for example, an inrush of current during switch closure can have a large influence on the contact performance. In this section consideration is given to the mechanical characteristics of devices and the influence on make and break contact dynamics. The mechanical action can be split into two categories, the opening and the closing operation, but with many of the devices covered the actuation controls both actions.
13.4.1 Case Study (1): Hand-Operated Rocker-Switch Mechanism
The opening velocity profile of a hand-operated switch can be related to the nature of the hand actuation of the device. Even snap-action devices, which are designed to provide a fast opening independent from a hand operation, are affected by the nature of the operation. The hand operation, and how this affects contact velocity, can depend upon the way in which a switch is operated. The force required to switch the device depends upon the mechanism, the spring stiffness and the angle of operation; however, the force applied can be greater than the force required to switch the device. The operating force can be categorized into three types of action, described as soft, normal, and hard. These terms are defined as follows: the soft action requires control of the switch by operating it as slowly as possible. The hard operation requires a sudden abrupt action. Normal operation can be described as an application of force where the operator reacts to the stiffness of the mechanism and adjusts to toggle the switch. These criteria are applicable to all types of hand-operated snap-action devices. It can be assumed that in normal use, switches are operated to fall within the category of normal operation.
It has been shown that the hand operation can have a direct effect on the dynamics of a switch [1,2,3]. Using a test circuit it is possible to identify the dynamic events in a switch operation, [2]. This can be useful in identifying the mechanical characteristics of a device prior to electrical testing. Figure 13.14 shows a response using the circuit with a mechanism prone to bounce during hand operation. The figure applies to a standard changeover switch with a configuration similar to that shown in Figure 13.2, operated by hand. It shows the separation of the main contacts and the following impact of the second contact pair, between A and B. The time of this motion is defined as the change-over time (c/o). Immediately after the impact, a separation occurs at the pivot interface shown in the lower trace at C, and this is followed by a period during which both the main contact and pivot contacts bounce. Using this method the mean normal hand-operated change-over time can be evaluated, and the average velocity obtained; this has been used in an investigation of the average velocities between 0.5 and 1.0 ms−1. The pivot bounce time is the total time of separation between C and F. The method demonstrates a simple means of obtaining important information on the dynamic events in a switching system. Much of the details shown would not normally be observable using high-speed photographic techniques.
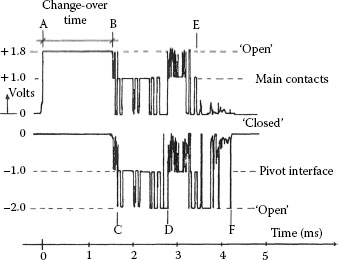
FIGURE 13.14
A typical switching event in a hand-operated rocker switch. The upper trace shows the events occurring at the main contacts, and the lower trace shows the events at the pivot interface.
In general, the opening characteristics of hand-operated devices are dominated by the spring forces that need to be overcome to operate the device, thus with a large spring force the hand operation will need to be more forceful and the mechanism will therefore move faster.
13.4.1.1 Moving-Contact Dynamics of a Rocker-Switch Mechanism
In order to understand and improve the design of a switch it is possible to develop mathematical models of the mechanisms. Once a model of a mechanism has been developed and verified it can then be used to optimize the performance, for a given parameter. A full analysis of a rocker switch is given in [2], using the geometry of the rocker switch mechanism shown in Figures 13.1 and 13.2. The model defines the interaction of the moving rocker assembly α (the angle between the vertical and the spring-loaded plunger position) with the rotation of the moving contact β (the angle between the horizontal and the moving contact position). The interaction of the two parts is complex and depends upon the frictional characteristics of the spring-loaded plunger and the interaction with the surface of the moving contact, identified in Figure 13.1 as the blade. The mathematical model of the mechanism consists of six nonlinear simultaneous differential equations, which are solved numerically.
Figure 13.15 shows the response of the moving contact with the angular velocity of the rocker as a parameter . The faster the rocker motion the greater the value , therefore, the faster the change-over time of the switch. The change-over time can be identified as the time between the onset of motion and the impact of the main contacts. With a rocker velocity of 100 rad s−1 the change-over time is shown to be 2.25 ms. The moving contact (blade) accelerates from rest where the blade starts at a small negative angle, to the point of impact where the blade angle is defined by the dotted line at 0.21 radians. The slope of the line at impact gives the velocity of the contacts at impact, which increases with the rocker velocity.
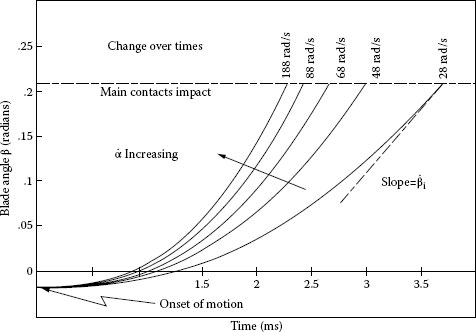
FIGURE 13.15
The response of a mathematical model of a rocker switch, showing the variation of the moving contact position with time, with the velocity of the hand-operated rocker actuator as a parameter.
13.4.1.2 Design Optimization of a Rocker-Switch Mechanism
It has been identified that when the make-down configuration rocker switch is operated by hand there is a complex mechanical event, where both the main and pivot contacts can bounce, as shown in Figure 13.14. By consideration of the mechanism shown in Figure 13.2, it can be identified that when the main contacts make, the inertia of the moving contact will allow it to continue moving in the same direction; the moving contact will then separate from the pivot. At the same time the restitutional effects at the main contacts will cause the main contact to bounce. This will be particularly the case in the change-over configuration, where the moving contact inertia will be higher. In the make-down, on-off configuration shown in Figure 13.3, the pivot will have less tendency to separate, because of the lower inertia. In the make-up configuration shown in Figure 13.4, the main contact impacts with the fixed contact. In this case, the moving contact is unable to continue moving in the same direction at the pivot interface, therefore the bounce that occurs at the main contact is the main dynamic event. The parameter that best describes the likelihood of bounce other than the geometry of the device is the kinetic energy in the moving contact, since it is the kinetic energy that needs to be dissipated in the switching action to bring the system to rest. The bounce of electrical contacts will be discussed in detail in the next section, but it can be observed here that the bounce of impacting contacts will be related to the magnitude of the kinetic energy at impact KEi given by
(13.4) |
where Ib is the inertia of the moving contact, and βi the velocity of the moving contact at the point of impact with the fixed contact, shown in Figure 13.15.
To reduce the kinetic energy at impact then there are three main solutions:
1. Reduce the inertia of the moving contact
2. Reduce the impact velocity of the contacts
3. Increase the absorption of the energy of impact in the materials
13.4.2 The Opening Characteristics of Switching Devices
In this section, consideration will be given to the mechanical events that determine the opening characteristics of low-current switching devices.
Limit switches and relays are examples of devices, which are actuated by a controlled movement, thus the dynamics of these devices are governed by the nature of the actuator. In this case, the switch can be modeled and tested with greater accuracy than with the hand-operated devices since the actuator will have more predictable characteristics. In practice, the actuator can be a wide range of devices, for example, electromagnetic circuits in relays and residual current devices and thermal displacement devices in control switches.
13.4.2.1 Moving Contact Dynamics at Opening
The nature of an opening velocity profile depends upon the system considered. A simple mathematical model of moving contact dynamics can be given by assuming that there is an actuating device, which provides a constant force to a moving contact, which is pivoting about a fixed point A, in Figure 13.16. The figure shows the actuator force Fe acting to open the contacts, and the force F0 from a spring acting against this to provide the static contact force when the contacts are in the closed condition. The moving contact is shown to have a position α relative to the horizontal, and the moving contact velocity is thus given by . The dynamics of the mechanism can be given by
(13.5) |
where
J = moving contact inertia
= moving contact position
Fe = force of actuator
F0 = static contact force
he,h0 = the distance of the force Fe and F0 from the pivot point
To simplify the dynamics, it can be assumed that the static contact force is small compared to the other forces, then Equation 13.5 can be simplified to assume no static force and a constant applied force, Fe;
(13.6) |
From Equation 13.6, the contact displacement as a function of time can be determined, and will show a linear acceleration, with the contact velocity increasing from zero at rest when the contacts are closed, to a maximum value as the moving contact hits an end stop.
In this section, consideration is given to the mechanical events that determine the closing or make characteristics of devices used for low-current switching. The effect of current on the process will be considered in Section 13.7.
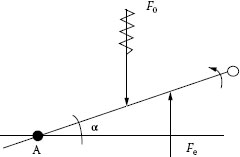
FIGURE 13.16
The opening dynamics of a pivoting switch mechanism, with the actuator force Fe and the static spring force F0.
Electrical contact bounce occurs in most switching contacts. In the general case, when two solid objects collide, there is inevitably a rebound, which in the case of electrical contacts, if the circuit conditions permit, results in the generation of arcs. With arcing occurring during contact bounce, each bounce becomes a fast break-and-make operation, during which the arc is not usually extinguished, unless an ac zero occurs. The events occurring during the impact of electrical contacts thus reflect some of the events at the opening of the contacts. Often there are a number of bounces following the initial impact which, with associated arcing, can lead to severe erosion of the contacts. In most circuits, the current rise at impact is delayed by the effect of circuit inductance, thus reducing the energy dissipated by the arc and thus the arc erosion; conversely during the break operation transients occur which cause arcing. On switching a capacitive circuit, however, a high inrush of current can occur. Other devices can also give a high inrush, for example incandescent lamps, and electric motors. The high inrush of current can cause current as high as ten times the normal circuit current to pass through the interface during the bounce and arcing stages. The impact of electrical contacts in the closing process can be considered from the mechanical events which occur in the impact of solids. This can then be taken further to understand the effects of current on the process; and this is covered in Section 13.7.
When two solids collide, there is a complex interaction of forces. To understand the events occurring in the electrical contact interface during impact, it is important to provide an understanding of the events, which govern mechanical impact. Mechanical impact is a general area applicable to many areas of mechanics. The study of impact between colliding solid bodies received its first theoretical treatment in 1867, by St Venant, who suggested that the total period of collision was determined by the time taken for an elastic compression wave to move through the solid and be reflected back. Experimental results show this theory not to be perfectly true and the evidence suggests that for small bodies the collision process is dependent upon the deformations occurring in the area of contact. Consequently for small bodies of the order of a few centimeters in length the problem of the compressive wave can be ignored. The physical explanation of impact and rebound can then be applied to the events occurring at the points of contact. Using these assumptions, the events occurring during impact were dealt with by Bowden and Tabor [18], who separated the impact process into four main stages.
1. The elastic deformation in the areas of contact
2. The partial plastic deformation when the local pressure exceeds 1.1 times the yield point of the materials
3. Full plasticity until the whole of the incident kinetic energy at impact is consumed by the collision
4. Release of the elastic stresses resulting in the rebound
A full analysis of the four phases involved in the collision process is complicated and difficult. Early research into this area studied the quasi-static behavior of contacts. Goldsmith and Yew [19], and Tabor [20] and concluded that extrapolation of the results to the dynamic impact process could be carried out on the basis that the difference between the dynamic and static yield stress and static dynamic energy dissipation are often within 25–50% for a number of common metals. These early tests encouraged the belief that a useful if only qualitative insight into bounce could be gained by quasi-static load tests [21].
Experimental investigations in the field of impact have been performed for a variety of purposes. Many have been conducted with the object of assessing the validity of a proposed theory or the accuracy of an assumed model of material behavior, for example, proving the Hertz law of contact or the study of viscoelastic wave propagation. Other efforts have been directed toward the collection of empirical information in the areas of cratering and penetration [22].
In the impact process applied to electrical contacts, one contact would normally be stationary. The kinetic energy of the moving contact is then absorbed at the interface, or in support structure. During the release stage, the moving contact is given back a degree of the energy, which results in a separation. With a spring acting on the moving contact, the contacts will again impact until all of the incident kinetic energy of the first impact is dissipated. The application of current to the interface during the impact process and the following bounces adds a further dimension of difficulty to the mechanical considerations.
13.4.3.2 The Coefficient of Restitution
To give analytical understanding of the events, a simple mathematical model can be developed to represent contact mechanics, based upon a system of masses, springs, and dampers, representing the elasticity of the contact surfaces. Consideration can be given to the coefficient of restitution e, and the conservation of linear momentum. With reference to Figure 13.17, the following definitions can be made. The velocity of the moving contact is identified in the figure as ui and the velocity of the contact after the impact process as u1 where “1” is used to indicate the first impact.
The coefficient is defined as the ratio of the impact velocity with the separation velocity, where the separation velocity can be defined as:
(13.7) |
or for the more general case where there are a number of impacts during a bounce process;
(13.8) |
Figure 13.18 shows the terms used in defining the bounce and impact events, which occur as electrical contact make, where there are multiple impacts and bounce events.
In a simplified analysis, e is often taken as a constant; however, it can be shown that e is a function of the impact velocity:
(13.9) |
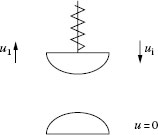
FIGURE 13.17
The closing event of contacts with an impact velocity ui and a separation velocity u1 after the impact event.
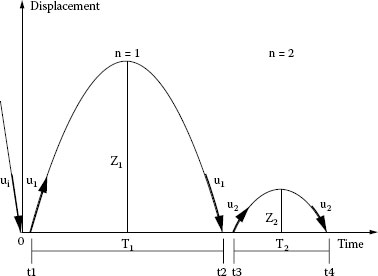
FIGURE 13.18
The notation used to describe the contact bounce process, in this case with two bounces after the first impact.
Often the coefficient of restitution is considered a material constant, and as such can be used to produce some useful relationships in describing contact bounce. However, in reality, the concept of restitution is used because of its attractive simplicity, and it would be more conceptually satisfactory to summarize the results in terms of energy dissipation. The coefficient of restitution has been shown to be a function of impact velocity and to some extent is affected by surface hardening, resulting from the work hardening of the contact surface [23]. In the case of electrical contact the event is also affected by arcing between the contacts.
The value for e can be determined from the bounce times as shown in the following analysis, with reference to Figures 13.17 and 13.18, which give the notation used; the mechanics of bounce without the passage of current can be described as follows, assuming e to be a constant:
(13.10) |
Assuming negligible gravitational effects, and a constant applied force,
(13.11) |
where Zn and Tn are the maximum height and duration of the nth bounce.
13.4.3.2.1 The Coefficient of Restitution as a Function of Velocity
It has been shown from the consideration of a hard ball of radius r1 mass m, falling from a height of h1 with velocity ui on to a fixed surface, and rebounding to a height h2 with velocity u1 [18], that
(13.12) |
where
(13.13) |
where E is Young’s modulus, taken as the same value for both sets of contacts, and p is the dynamic yield pressure.
Combining Equations 13.8, 13.12, and 13.13, it can be shown [23] that the impact event can be described by
(13.14) |
Equation 13.14 can only be solved using numerical methods; however, simplifications can be made to render the function more usable for design purposes. To a first approximation, since e is always <1, and if k is small, ignoring the powers of e in the brackets as they are much less than one, [23], then Equation 13.14 can be simplified to give
(13.15) |
Using these equations, it is possible to relate the amplitude of a specific bounce to the duration of the bounce. For a given impact, velocity and assuming e to be a material constant there exists a unique relation between the time of bounce and the maximum displacement. These equations do not, however, allow for the vibrations in the fixed contact or the presence of a current or an arc between the contacts. They also do not take into account possible changes in the contact surfaces that can result from the arcing between bounces (see Section 10.6).
13.4.3.3 Impact Mechanics for a Pivoting Mechanism
Figure 13.19 shows the geometry of a pivoting contact system, with the terms used to define a bounce characteristic given in Figure 13.18. In this case the angle defining the position of the moving contact is α, and h is the position of the spring, while h′ is the position of the contacts from the pivot point.
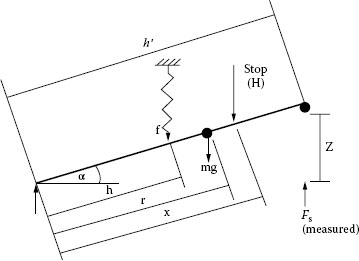
FIGURE 13.19
The closing dynamics of a pivoting mechanism, where H is the stop position corresponding to the maximum contact gap, f is the spring force bringing the contact together, and Fs is the static contact force after the event.
The dynamics of the impact events are on the basis of the following assumptions:
1. There are no frictional losses.
2. There are no elastic vibrations in the contact support or contact arm.
3. There are no electromagnetic delaying forces.
4. The impact is dominated by surface effects and not by stress wave propagation.
5. The contacts are released from the stop position (H), and fall under the influence of the spring force f, with a spring stiffness of K.
6. The contact force when the mechanism is stationary is Fs.
13.4.3.4 The Velocity of Impact
If the angle (α) is small, then
(13.16) |
which can be solved (24) to give
(13.17) |
Therefore, the velocity of impact therefore increases with both the initial setting H and Fs. Thus the greater the contact force used to hold the contacts in the closed position, and the greater the contact gap used in the device, the greater the velocity of impact. The analysis can be taken further to consider the impact and bounce events.
Equation 13.16 can be used to solve for the bounce times, for example T1, the bounce duration of the first bounce [24]:
(13.18) |
A simplification of this equation can be made if the bounce heights are small and the spring force remains constant; then the first bounce time is given by
(13.19) |
With a known static contact force, Fs, inertia J, and pivot arm length, h’, the duration of the first bounce can be predicted, if the velocity at which the contacts open after the first impact is known.
In the case of the pivoting mechanism used in this analysis the constant k given in Equation 13.13 needs to be modified [24], and is given by
(13.20) |
In the case of both the pivoting contact system, and the system described in Equation 13.13, k will increase with an increase in p and the radius r. Both Equations 13.13 and 13.20 show that the surface profile of the impact area is significant and that the radius r needs to be investigated further since on a worn electrical contact the radius would be expected to be dominated by the worn contact surface and not the initial radius of the contacts. Equation 13.14 can be solved numerically to give e as a function of changes in velocity of impact for the pivoting mechanism, with k as a parameter, as shown in Figure 13.20 for a range of velocities. The figure shows that at low velocities e = 1, but as the velocity of impact increases e reduces. Also e is shown to be a major function of k, and reduces for a given impact velocity as k decreases. A reduction in k could be interpreted as a reduction in p, the dynamic yield pressure, or r, the radius of the contact surface. At high values of impact velocity e could be taken as a constant, and also at the velocities shown in the figure if k is small.
The use of Equation 13.8 to describe the bounce process involves a discontinuity for the last impact. This is irrespective of e being taken as a constant or not, since the equation will fail, because un cannot go to zero; indeed as the velocity, un–1, decreases e tends to unity, suggesting that the bounce will go on to infinity since uu = un–1. Hence to model the process more precisely, energy equations should be used [21], giving
(13.21) |
for a moving contact of mass m, where ∈ is the energy lost during the impact process.
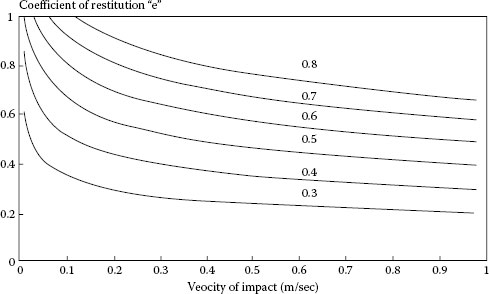
FIGURE 13.20
The coefficient of restitution as a function of impact velocity, based upon Equation 13.14, with k (0.3–0.8) as a parameter.
It can be shown, using Equation 13.19 that if e = constant, then
(13.22) |
from which the total bounce time can be approximated using the binomial expansion, to give
(13.23) |
If, however, , then this equation can be rewritten as
(13.24) |
Hence, the total bounce times can be evaluated from Equations 13.23 and 13.24. Figure 13.21 shows an example characteristics, when e = 0.4, and k = 0.3. This shows that the total bounce time decreases as the static force increases. An increase in the static contact force could therefore be proposed as a method of reducing contact bounce, but the increase of the force will have a secondary affect in the increased impact forces as the contacts close, which wil result in increased deformation of the contact surface. The figure also shows that the contact gap from which the mechanism is released, H, will increases the bounce duration.
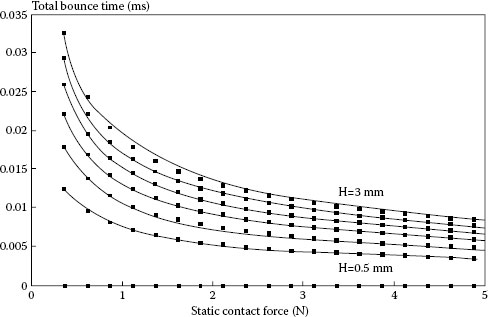
FIGURE 13.21
The total bounce time versus the static contact force, based upon Equation 13.23, with the drop height H (0.5, 1, 1.5, 2, 2.5 and 3mm) as a parameter.
For two contacts of radius r, and mass m, where one contact is stationary, the impact times can be given (24) as
(13.25) |
Hence the impact time is shown to be independent of the velocity of impact. A re-evaluation of the impact time for the pivoting mechanism gives
(13.26) |
where
(13.27) |
and
(13.28) |
Hence, in the form of Equation 13.26 the impact time is shown to be a function of the impact velocity.
13.4.3.8 Design Parameters for the Reduction of Contact Bounce
It has been shown in Section 13.4.1 that contact bounce can be reduced by the control of a number of parameters, for example, reduction of impact velocity, reduction of moving contact inertia, energy absorption at the contacts or in the contact structure, and by increasing the contact force in a given mechanism. The selection of the parameter which best suits a given situation or device varies. For example, the control of the electromagnetic actuator can be used to reduce the impact velocity and thus reduce the contact bounce, but this would be a costly addition to a rocker-switch mechanism, and most other low-current switches. In general to reduce contact bounce in low-current hand-operated devices the choice of mechanism is important, as discussed in Section 13.2, followed by an understanding of the switching dynamics.
13.5 The Measurement of Contact Wear and Contact Dynamics
The previous sections have considered the mechanical operation of switching devices; consideration is now given to the electrical performance in terms of the interaction of arcing on the performance of these devices. As discussed in Chapters 9 and 10, the arcing process has a direct effect on the switching surfaces, in that the plasma interaction with the contacts results in material transfer. In addition to this, the plasma interaction with the surrounding gases also has an important effect of the surfaces of the electrodes. In many of the studies undertaken the mass change of the electrodes are often used to determine the wear processes. In this section the volumetric change of the electrode surfaces is introduced. It will be shown that this new method is a powerful tool for determining the evolution of wear on electrical contact surfaces. The methods discussed are equally applicable to connector wear, but the focus in this section is on the application to arcing surfaces.
13.5.1 The Measurement of Contact Surfaces
A study of wear and erosion performance of switching devices is essential in the prediction of switching device life. It is also fundamental in the development of new and improved switching contact materials. Much of the published research literature in the field of electrical contact studies is focused on these issues. To constrain the scope the main focus here is on devices types typically used in domestic and light industrial applications. Testing of commercial devices is normally defined by international and national testing specifications which are numerous. The testing regime is unique to a particular classification of device, and it is not possible to generalize these test. In studying the fundamental phenomena underlying the commercial devices and testing methods, a number of investigation have been reported. In general these investigations depend on the methods of reducing the number of experimental variables and designing a test method to reflect the condition to be investigated. In these studies, a controlled experimental condition is used, for example constant contact opening velocity. The contact materials are mounted in the test apparatus and evaluated for erosion after a fixed number of switching cycles. In the majority of the application the contacts are removed from the test system and evaluated for erosion by consideration of the mass change of the contacts. This method does not give an indication of the surface condition. For example, a contact surface can exhibit a zero mass change when the surface has been severely eroded; also the mass change will not reflect that some mass will be lost to the surrounding contact holders. This has in the past been known to cause errors when comparing different sets of result from different authors. To overcome the limitations of the mass change method a number of recent papers have focused on the evaluation of the contact surface using a range of contact and non-contact methods. These methods are referred to as Volumetric Methods, [25,26,27,28,29,30,31,32,33].
Surface profile can be measured in both 2-D and 3-D. Using a 3-D technique, a measurement of the change in volume above and below a datum, can be obtained, generating data on the distribution of mass on a contact surface. Figure 13.22, shows a schematic diagram of a typical eroded switching contact where mass has accumulated above the new (datum) surface in some areas and below the surface in other areas. The figure identifies the volume (V+), above the datum and (V−), below the datum. The net volume change of the surface is then (ΔV),
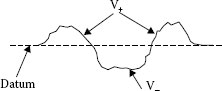
FIGURE 13.22
2-D Erosion profile of an electrical contact
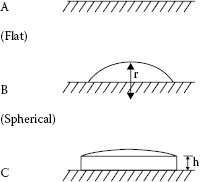
FIGURE 13.23
Typical low voltage electrical contact shapes where h = 0.5mm.
(13.29) |
In addition to this a volume calculation (V) can be made relative to a fixed datum surface such as the material on which the contact surface is mounted. In Figure 13.23 surfaces B and C are examples of surfaces where the latter measurement can be made.
13.5.2 Three Dimensional (3-D) Surface Measurement Systems
Stylus and Laser-based metrology instruments have been used to investigate the surface profiles of eroded contacts. In early work on this method, [11,29], multiple 2-D stylus scans were used to investigate the erosion of contact surfaces and comparisons were made between the mass change and volume change. In [11], a study of the erosion of Ag-CdO contacts in low current switching, below 16 Amps, was presented. It was shown that the volume could be calculated above and below a curved contact surface.
Surface profiling using non-contact laser probes have been used to study contact erosion, [25,26,27,28]. In [26,27], a measurement method was developed on the basis of the non-contact measurement of an eroded surface using an auto-focus laser. This showed that an electrical contact welded to a substrate could be analysed and it was demonstrated that the near vertical surfaces of a typical electrical contact used in low voltage relays, type C in Figure 13.23, could be measured and the resultant data array of the surface used for the evaluation of the volumetric erosion (V) relative to the base. There follows a brief description of generic measurement systems.
A stylus profilometer operates by accurately monitoring the vertical movement (Z axis) of a stylus of known radius (e.g. 2 μm), as it moves across a surface, (X axis). The stylus system is very slow in collecting data, as the contact nature of the measurement requires the stylus has to move slowly to maintain contact. Typical measurement times are between 1–2 hours.
Non-contact measurement systems depend upon the use of light incident upon the surface to be measured. These methods are in all cases much faster than the contact systems with typical measurement times of the order of a few minutes. These methods can be separated into the following groups, Confocal Laser Scanning Microscopy, Laser Ranging Non-Contact probes, Interferometry, and White Light probes. Laser ranging systems require the movement of the sample, or probe. With the scanning microscope, height data is gathered as series of equi-spaced, parallel slices, with each slice containing evenly spaced measurement points. With the laser ranging probes there are two common measurement techniques, using auto-focusing, and triangulation. With the auto-focus laser system a 1–2 μm spot is projected onto a surface, and the quality of the focus of the reflected beam assessed by a photo-diode array. An auto-focus controller drives a servo-system attached to the objective lens, adjusting its position until a best focus is achieved. By monitoring the movement of the focusing servomotor the displacement of the surface from the probe can be determined. Typical resolution is 10 nm with a range of 0.6 mm. With a triangulation probe a laser is directed at a surface, and the position of the reflected beam on a photo-diode array determines the displacement between the probe and the sample. The spot size will vary with the height, and is normally 20–30 μm, limiting the ability to measure surface detail. With interferometry a monochromatic light source (typically a laser) is passed through a beam splitter causing light to be directed onto a sample surface and reflect back onto a reference optical flat. The two beams recombine and the interference pattern formed is incident on a CCD array, connected to a computer with image processing facilities. White Light probes offer a similar resolution and spot size to the auto-focus systems but with a lower gauge range of 0.3 mm. The probe uses a White Light source which is focused on the surface though an optical fibre/lens system. The reflected light is the processed using a spectrometer, allowing the surface position to be detected. A review of the types of process measurement process is provided in [28].
13.5.3 Case Study (2): Example of Volumetric Erosion
To demonstrate the volumetric erosion measurement, an experiment is conducted using conventional Ag/Ni automotive relay contacts in a relay test fixture. The samples are cycled for 3000 switching cycles at 14.8 V, 10.2 A, in a resistive circuit. Figure 13.24 shows the resultant cathode surface and Figure 13.25 the anode surface. In both cases the underlying surface form is removed to provide the datum for the evaluation of the volumetric wear. To increase the accuracy of the volumetric wear process it is important to remove the roughness of the surrounding surface as this will generate significant errors in the evaluation. There are a number of methods for achieving this, [30,31]; although the most accurate is to use a data removal method, based upon the known 3D surface roughness of the datum surface, [34]. Resultant data is shown in Table 13.1. The net change in volume of both cathode (1.355 × 10⁻³ mm2) and anode surface (1.367 × 10⁻³ mm2) are similar. It is well know that the volume calculation should be adjusted for density changes in the material transfer for are relationship to mass, however a number of researchers have shown that for most electrical contact applications the volumetric method is sufficient, [11,35]. Figure 13.26 shows the interaction of the two surfaces using selected 2D data lines, identified in Figures 13.24c and 13.25c. Figure 13.26 shows the cross section through the pip formation on the cathode, superimposed on crater formation section from the anode surface. The difference in the two surfaces arises from the deposition on the anode surface shown Figure 13.25b. A 3D method has been developed using a replication methods, [36].
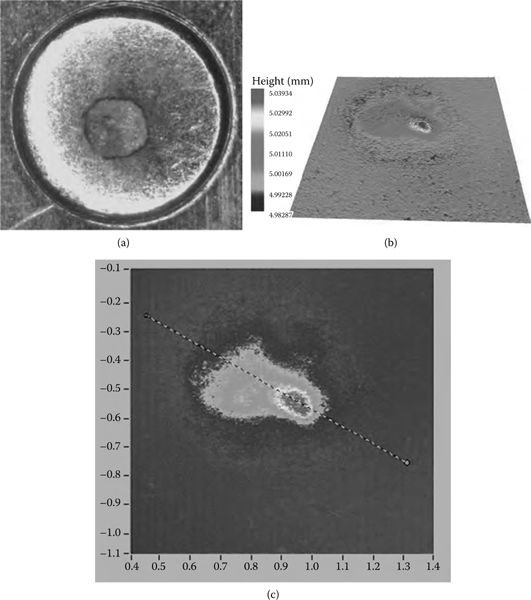
FIGURE 13.24
(a), Micrograph of the Cathode surface, (b) 3D surface data using TaiCaan XYRIS 4000CL, 90,000 data, over 1mm by 1mm, with the underlying spherical surface removed; (c) plan view of the 3D data with a cross section selected.
(For the cathode from Figure 13.24b and anode from Figure 13.25b)
13.5.4 The Measurement of Arc Motion and Contact Dynamics
In order to understand the influence of the moving contact on the reliability of contacts, it is necessary to monitor moving-contact dynamics. High speed video has the ability to frame at high speeds, allowing detailed studies of the arc, [37], and the associated mechanism dynamics. Optical fiber arrays have also been developed and used in the study of mechanism motion. The optical fiber method is a low-resolution solid-state imaging system, where the images can be stored in computer memory; using this method images can be formed at the rate of 1,000,000 frames per second [38,39].
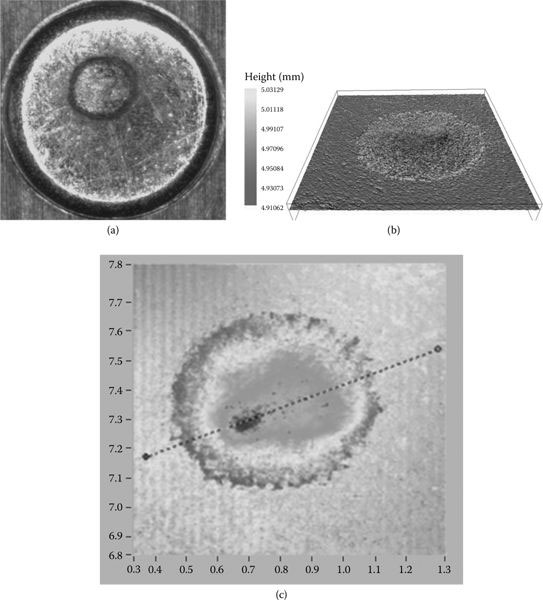
FIGURE 13.25
(a), Micrograph of the Anode surface, (b) 3D surface data using TaiCaan XYRIS 4000CL, 90,000 data, over 1mm by 1mm, with the underlying spherical surface removed; (c) plan view of the 3D data with a cross section selected.
TABLE 13.1
Determining Volumetric Erosion
|
Cathode Surface × 10−3 mm2 |
Anode Surface × 10−3 mm2 |
Volume Above Datum (V+) |
1.526 |
0.833 |
Volume Below Datum (V−) |
0.171 |
2.200 |
Net Volume Change (ΔV) |
1.355 |
1.367 |
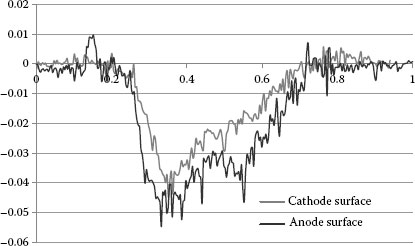
FIGURE 13.26
2D surface data using the cross sections shown in Figure 13.24c and 13.25c; aligned to show the interaction of the anode and cathode surfaces.
13.6 Electrical Characteristics of Low-Current Switching Devices at Opening
Having considered the types of switching devices in the low-current range and the mechanical characteristics of switching systems, consideration is now given to the electrical characteristics: this will include discussions of arc characteristics, arc energy, contact wear and erosion (see also Chapters 9 and 10). In this section, consideration is given to the arc characteristics at opening and in Section 13.7 consideration will be given to the events at switch closure.
In dc circuits where the supply current is well below the limiting arc current Ilim (0.01–0.06 A see Section 9.5.4) a showering arc can be formed and is described in Section 10.2.4. Above the minimum arc current in a dc circuit, arc voltage increases with an increase in the contact gap until the current is reduced to a current at which the arc can no longer be sustained, see Section 9.7.2; the arc will then extinguish. For a slowly moving contact the arc voltage can be determined at a given contact gap by use of the “Holm graphical method” [17]. In this method quasi-static curves of arc voltage and current for a particular contact gap of the type shown in Figures 9.37 through 9.39, can be used to define the contact gap at which an arc will extinguish in a given circuit. The arc length (d) can be approximated by the following empirical equation [40,41]:
(13.30) |
Where,
d = the contact gap (mm)
A = a constant
m = 1 to 2
n = 0.5–1
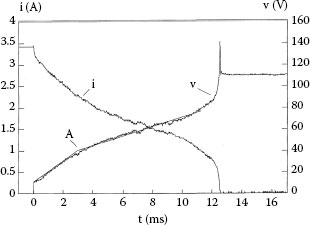
FIGURE 13.27
Typical arc voltage and current waveforms, for an opening velocity of 0.4 m s−1, I = 3.3A, V = 110 V dc, and L/R = 1 μs.
The constants can be obtained experimentally, and vary with arc length and contact material. For a resistive dc circuit the contact gap (d) can be defined in terms of the supply conditions:
(13.31) |
Where, V and I are the supply voltage and current. Equations 13.30 and 13.31 depend upon the quasi-static nature of the opening contacts, and are not accurate in normal switching conditions where the arc is a transient event. In addition to this, in most opening events the contact velocity u0 is neither constant, nor quasi-static (see Section 13.4.2). The empirical relationships defined in Equations 13.30 and 13.31, are a useful tool for modeling the switching performance of low voltage systems.
13.6.1.1 Arc Voltage Characteristics
Typical arc voltage and current waveforms are shown in Figure 13.27, for a break operation with a constant opening velocity, u0 = 0.4 m/s, I = 3.3 A, V = 110 V dc [41]. The figure shows that the arc extinguishes after 12.6 ms; with a linear velocity this corresponds to an arc length of 5.04 mm.
13.6.1.2 Voltage Steps below 7 A
At a current below 7 A, arc voltage waveforms can be observed to exhibit step rises as the contacts are opened. Figure 13.28 shows a typical arc voltage waveform, [42]. At higher current (>7 A) the arc voltage increases smoothly. Early investigations [43,44,45], revealed the presence of only two steps. The first step corresponds to the minimum arc voltage. Boddy and Utsumi [46] proposed that the second step is owing to a transition from a metallic discharge medium to an arc burning in the ambient gas (see Section 10.3.5). The critical distance at which the metallic to the gaseous phase transition takes place is determined by the condition that the concentration of metal vapour falls below the value necessary for the maintenance of the discharge because of the diffusion of the ambient gas into the metal vapor. The critical distance rc, [46], depends on the circuit current I and the pressure p of the ambient gas as well as the ionization potential Vi of the gas as follows:
(13.32) |
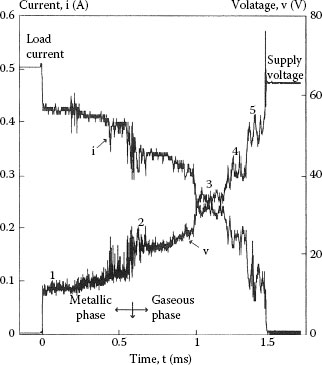
FIGURE 13.28
Arc voltage and current showing a case with five voltage steps, I = 3 A, V = 65 V, and opening velocity 0.5 m s−1.
Where, α = 0.4–0.5 and β = 1.0–1.1 for small molecular weight gases like air, N2, Ne, He, etc. However, for large molecular gases, like SF6 and CC12F2, β = 0.5, which is may be owing to their electronegativity and to the ability of these gases to undergo numerous chemical reactions in the arc leading to a varying arc atmosphere in both time and space. The critical distance was found by Boddy and Utsumi to be independent of opening velocity of the contacts [46].
To provide an example of the arc voltage current characteristics for silver cadmium oxide contacts, [41], Figure 9.39 shows the variation of the instantaneous arc length with the instantaneous arc current and voltage. These curves are obtained by compiling a large number of waveforms, for a range of break current. The contact speed was kept constant at 0.05 m/s to simulate a quasi-static operation. An empirical formula is derived from the waveforms relating the arc length to the arc voltage and current, on the basis of Equation 13.30.
(13.33) |
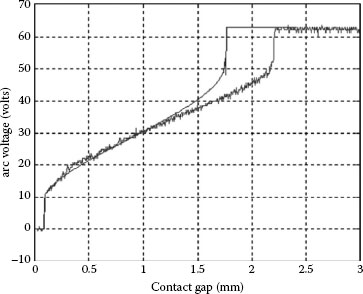
FIGURE 13.29
Model of the arc voltage on the basis of the quasistatic empirical relations. For a 64V dc 9A, resistive load. Experimental data contacts opening velocity of 0.1 mm/sec.
The values of m1, n1, and A depend on the length of the arc. For a short arc, d < 1.5 mm, the values are as follows, for AgCdO contacts:
The 1.5 mm break point has been selected for the purpose of drawing comparisons, but is otherwise arbitrary. The break point can be identified in Figure 13.27, point A, as the point where the voltage waveform changes slope. For an arc longer than 1.5 mm and up to 7 mm the following values have been obtained:
The empirical relationships defined in Equations 13.30 and 13.31, and modified here in Equation 13.33 are a useful tool for modeling the switching performance of low voltage system. Figure 13.29 shows an example where the coefficients are used to generate a model of the arc voltage, using a computer based numerical method to calculate the arc voltage for a given supply condition and contact gap, using the Newton-Raphson method. On the basis of this analysis, Figure 13.29 shows the resulting predicted arc voltage for the quasistatic model of the arc. It shows that for the 64 V, 9A resistive dc. Load that the arc model is able to model the initial stages of the arc voltage. However as the gap increases the simulation is unable to predict the resulting arc voltage for a contact velocity of 0.1 m/sec. The contact gap at arc extinction is 2.2 mm for the experimental data at 0.1 m/sec opening velocity, while the quasi-static model predicts a gap of 1.7 mm.
13.6.1.4 Opening Speed and Arc Length
Figure 13.30 shows the variation of arc current and voltage with the contact gap for three different opening speeds, for silver cadmium oxide contacts [41]. The contact gap at which the arc extinguishes, the total arc length dx, increases with the opening speed. Increasing the current increases the effect of the opening velocity. This demonstrates the limitations of the quasi-static arc characteristics. The quasi-static curve should only be used as an indication of the arc characteristics in dc circuits. The model used to determine the data in Figure 13.29 is used here to predict a contact gap at arc extinction of 5.13 mm. In Figure 13.30 the quasi-static value (0.02 m/sec) is 4.5 mm. Interestingly the extinction gap for (0.1 m/sec) is 5.0 mm; thus, the overestimation of the gap using the model brings the gap closer to the gap when the contacts are opened at a more realistic speed.
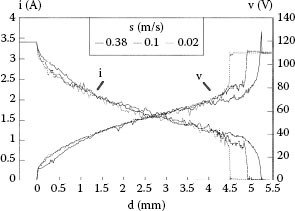
FIGURE 13.30
Instantaneous arc voltage and current versus contact gap for different opening velocities, V = 110 V, I = 3.3 A, and L/R = 1 μs.
13.6.1.5 Case Study (4): Automotive Systems
The automotive sector has seen rapid changes from the traditional 12–14V dc power supply to a period in the 1990s-2000 where a 42V replacement was considered, but was found to be limiting. The key driver for the increase in the supply voltage is the increase in power requirements. This trend shows no sign of abating as the automotive sector moves more and more toward electrically driven sub systems, such as ABS and fuel pumps; and also to hybrid and fully electrical drive systems. In both a European forum and the American consortium of car manufacturers and their suppliers, the members agreed to a new standard of a new power network of 42 VDC, in 1998–99, [47,48]. The increase in a supply voltage from 12–14V dc to 42V dc has a number of consequences in terms of the switching systems, foremost is the fact that the supply voltage of 12–14V dc is close to the minimum arcing voltage for a resistive load for the materials used, thus minimizing the consequences of arcing. In simple terms opening a circuit with a 12–14V supply will cause minimal arcing. Opening a circuit with a 42V dc will produce arcing and as a consequence increase reliability issues and cause a significant fire risk if live conductors are damaged during an impact event. After many years of research, of which a few representative paper are provided here, [32,47,48,49,50,51,52], the outcome was that at the time of writing this in 2012 the majority of automotive systems are still dominated by the 12–14V dc power supply. The conclusion to this episode is that engineers need to consider the consequences of switching dc power systems as a priority.
Recent innovations have seen the introduction of battery voltages for hybrid systems of 144V, 288V, and of 345V for pure electric vehicles; some systems use a convertor/invertor, with an output of 650V ac. This is a rapidly advancing area and the fact remains that the dc voltage levels are increasing above the traditional levels, [53].
There have been many investigations into erosion of electrical contacts, and as discussed elsewhere in this book (see Section 10.3 and particularly 10.3.5) the erosion characteristics depend upon a number of parameters, which include the supply conditions, the environment, the contact materials and the mechanical characteristics of the device [54,55,56]. In general, the erosion or deposition of contacts is defined in terms of the mass changes of the contacts, and contact resistance measurements. The mass measurement must however be treated carefully as it is possible for a contact to exhibit a zero mass change where there has been both erosion and surface deposition on the same contact. Investigations have considered surface analysis as a means of measuring and quantifying erosion, as discussed in section 13.5.
13.6.2.1 Ag and Ag/MeO Contact Erosion/Deposition
The dc erosion characteristics of low-current switching is shown in Figure 13.31, for a controlled test apparatus with silver cadmium oxide contacts where the contacts were opened at a constant velocity [41]. The erosion has been defined in terms of mass change at the anode and cathode; these are shown to be linear functions of the number of operations (see Section 10.6). The erosion can therefore be specified as an erosion rate. Figure 13.32 shows the erosion per operation of both anode and cathode contacts as a function of the circuit current. For the conditions stated in the figure the contact erosion rate is reduced as the contact velocity increases. Thus, in dc circuits there is an advantage in opening the contacts at high velocity. There are however consequences of a fast mechanism in that on making the contact there is likely to be more contact bounce, as a result of the increased kinetic energy in the system (Equation 13.4).
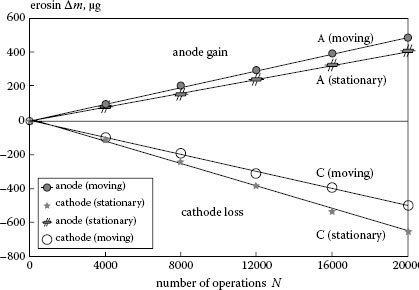
FIGURE 13.31
The dc erosion of Ag/CdO contacts with the number of operations, for a range of opening velocities with moving anode and fixed cathode cathode, and moving cathode and fixed anode, for V = 62.5 V dc, I = 4 A and opening velocity 0.1 m s−1.
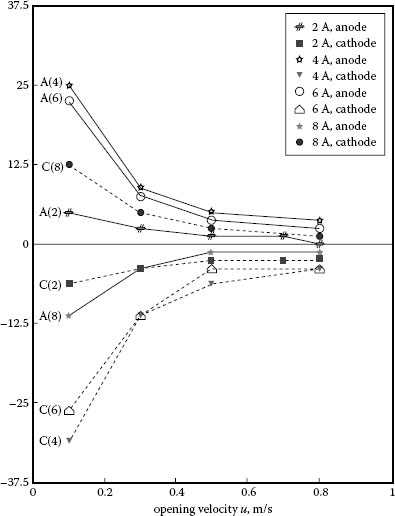
FIGURE 13.32
Erosion per operation, with opening velocity, for V = 62.5 V, moving anode in all cases.
In low-current dc switching with silver contacts below 4 A [57], it has been shown that at a current below 0.4 A material transfers from the anode to cathode and at higher current, above 0.4 A, the material transfers is reversed. In the current range 1–100 A there have been many investigations [40,42,55,58,59,60]. Figure 13.33 shows results of mass transfer per operation for a range of silver-based contact materials [40,60]. In Figure 13.33a, the materials tested all show material transfer increasing with current, and the direction of the transfer from the cathode to the anode, in Figure 13.33b silver cadmium oxide results show that at lower direct current (1–8 A) material transferred from cathode to anode, whereas at higher current (8–40 A) material transferred from anode to cathode.
It has been reported that the polarity of erosion between anode and cathode can vary with a large number of parameters [54] and that a change in one parameter can often lead to conflicting results.
In the automotive application, dc erosion is particularly important [61], although the majority of studies have concentrated on the erosion studies of the switching contacts in operating devices; where often the make operation is dominant in terms of reliability, and where both the de-gassing of the plastic housing and silicon contamination can have an important influence.
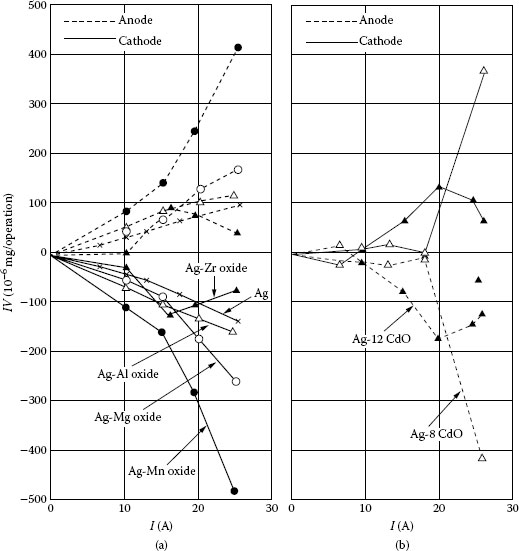
FIGURE 13.33
Erosion per operation for (a) a range of contact materials and (b) Ag/CdO [40].
To summarize, the following applies to dc arcs:
1. Very short arcs (less than a few microns depending on the contact material, activation, oxide layers etc) which occur when breaking very low current, typically below 0.4 A results in anodic erosion (from anode to cathode).
2. For arcs longer than a few microns where (1) above does not apply the erosion is cathodic (from anode to cathode) even for relatively short arcs. Increasing the arc length and/or current can change the arc transfer in some materials from cathodic to anodic.
On switching an ac circuit, the polarity of the contact will change with the supply frequency, the events controlling the arc erosion will, therefore, change with the changing the polarity of the contacts. The point at which the contacts are open will normally be a random event, and the arc will usually extinguish at the current zero, see Chapter 9.
13.6.3.1 Typical Waveforms and Arc Energy
To compare the arc voltage and current characteristics with the dc case, Figure 13.34 shows arc voltage with contacts opening at the same point of the ac waveform [56], defined as the point-on-wave, POW, for Ag/CdO, with a test current of 5.6 A, resistive load. The figure shows the contacts opening 1 ms after the current zero (a = 1 ms), producing an arc duration of nearly 9 ms for a 50 Hz ac supply. The figure shows that as the contact velocity increases the arc voltage increases at a given time, because the arc length will be greater; the arc is also shown to extinguish slightly earlier at the higher velocities. Similar waveforms have been obtained at different values of point-on-wave, POW, and with a range of current. The current always extinguished just before the first current zero after the ignition of the arc and no re-ignitions are observed in the range of reported velocities (0.1–0.8 m/s). Arc re-ignitions are observed at the much lower velocities of 0.01 m/s. Since the current waveform varies slightly with the contact opening velocity, the increase in arc voltage with contact opening velocity results in an increase of the arc energy. This is illustrated in Figure 13.35, which shows the variation of the arc energy per operation with the moment of contact opening a and contact velocity. The results shown in Figures 13.34 and 13.35 are for the ideal case with a linear opening velocity, and a variable maximum contact gap. The gap at which the arc extinguishes is governed by the velocity of the contacts and the POW at which the contacts start to open. In a commercial device the contact gap would be fixed. In all cases the arc energy is shown to reduce with the period of arcing, in Figure 13.35. Curves 1, 2 and 4 show the effect of current on the arc energy at a velocity of 0.3 m−1 s. This shows the arc energy increasing with the current. More significantly curves 3, 4, 5, and 6 show the effect of the velocity. As the opening velocity increases for a given current and arc duration the arc energy increases.
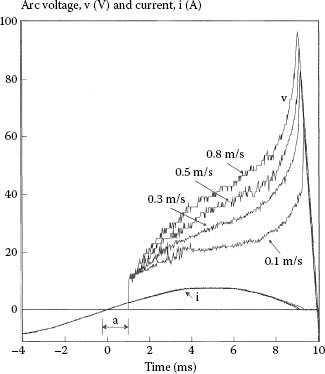
FIGURE 13.34
The influence of opening velocity and arc voltage and current, V = 240 V, 50Hz ac, I = 5.6 A, a = 1 ms POW.
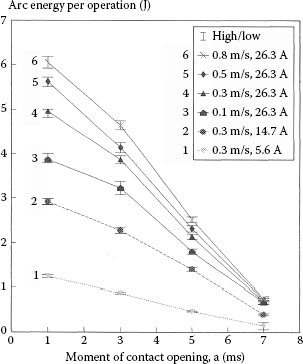
FIGURE 13.35
The influence of POW, opening velocity and current on arc energy, for V = 240 V, 50 Hz.
-4 -2 0 2 4 6 8 10 Time (ms)
The contact gap at which an ac arc will extinguish, dx, assuming there are no restrikes can be evaluated from the following equation:
(13.34) |
where f is the supply frequency, a the point on the ac current waveform the contact open at, and u0 the linear opening contact velocity. In the case with a contact velocity of 0.5 m−1 s and an ac supply of 50 Hz, with the contact opening at a = 1 ms, that is 1 ms after the preceding current zero, then the arc gap at extinction will be 4.5 mm. In most cases in the current range considered, the arc will extinguish before the maximum contact gap is reached in the device.
In ac circuits the polarity of the contacts at opening is a random event and in general little net transfer is usually observed, however, if the contacts are unsymmetrical (made of two different types of materials) net transfer from one contact to the other may be observed [62,63]. Net material transfer in ac circuits may also occur if the switch had a preferred point-on-wave (POW), in which case the polarity of the electrodes is fixed, this would be similar to dc erosion.
Holmes and Slade [64,65] studied the formation of pip and craters in ac circuits (220 V, 5.1 A, resistive load) using silver contacts at a rate of 1.5 operations/minute. A distinctive erosion pattern is observed with a pip and crater forming on both electrodes (each electrode has a crater beside a pip), the pip fitting into the crater of the opposite electrodes. It is shown that the rate of build-up of these erosion structures is a function of the average arcing time per switch operation. To explain these phenomena of double pip and crater formation, studies have been carried out using rectified ac. In this case, there is always a pip on the anode and a corresponding crater on the cathode. Based upon the rectified ac results Slade and Holmes explain the double pip and crater formation to be as a result of a similar mechanism to that of rectified ac transfer of material from the cathode to anode. However, in the ac case as the electrodes change polarity, the arc roots also change their position on the surface of the contacts when the polarity changes. This results in the double pip and crater formation.
13.6.4.1 Point-on-Wave (POW) Studies Using Ag/CdO Contact Materials
The aim here is to identify the influence of switching parameters on the ac arc, the variables considered are the POW, the point on the ac current waveform where the contacts open relative to the preceding current zero, the current and the velocity of the moving contact.
Figure 13.36 shows results of erosion studies [59], for a laboratory-based experiment using Ag/CdO contacts. The purpose here is to demonstrate how erosion polarity can be affected by some of the key parameters. The key parameters in ac erosion are:
1. The supply
2. The environmental conditions
3. The point at which the contacts are switched and the frequency of switching
4. The contact materials
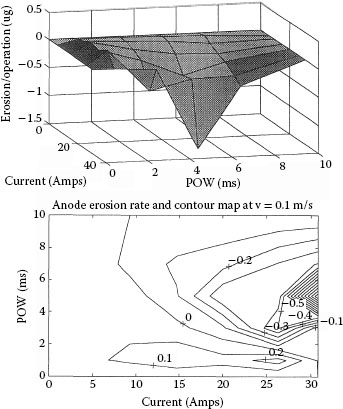
FIGURE 13.36
Anode erosion per operation for Ag/CdO contacts, with current and POW for V = 240 V, 50 Hz, and an opening velocity of 0.1 m s−1. Upper figure shows the erosion vertically as a surface, lower figure shows the same data as a contour map.
Of these parameters the experiments show variation in the POW and the supply current. The contacts are opening at 0.1 m−1 s and have a POW between 0 and 10 ms in a 50 Hz supply, thus the contact will always be the same polarity. Figure 13.36 shows a three-dimensional surface representing the erosion and deposition of the anode contact, for a range of current and POW. The erosion rate is plotted vertically in the upper graph. The figure shows that under most conditions shown the anode will lose material, indicated by the negative erosion. The exception to this is at a low POW (1 ms), where the anode gains material for the range of current investigated. The erosion at 0 and 10 ms point on wave is zero. The erosion rate peaks at 5 ms POW for the highest current in the range tested. In the lower graph the same data is presented as a contour map of the surface. This is particularly useful in identifying the point at which the erosion changes from positive to negative as a function of current. This is shown as the line (0) in the figure; as the supply current increases the cross-over point occurs at a lower POW. Thus, for low current the anode will gain material while at higher current the anode losses material.
For the same experimental conditions, Figure 13.37 shows the cathode erosion. The upper graph shows that under most conditions the cathode gains material. The exception is again at 1 ms POW, where the cathode losses material for the current range investigated. The contour map in the lower graph is again useful in identifying the cross-over from cathode gain to cathode loss. The figure is almost a mirror image of Figure 13.36, and shows that at low current the erosion is a cathode loss while at high current the erosion will be dominated by cathode gain. The degree of erosion varies with POW; with a commercial device the POW is generally a random process. The degree of mass transfer can be seen from the figures to increase with the current, and at the low current considered here the change of a contact from an anode to a cathode generally results in an effective elimination of any net transfer from one contact to the other. Both contacts, however, suffer from a change in the contact surface as a result of the arcing, which may lead to parts of the contact surface suffering more than other parts of the surface. In addition to this as the current increases there is more likelihood of mass being lost to the surrounding environment as droplets of molten metal are expelled from the arc roots. erosion at higher current will be considered in the next chapter.
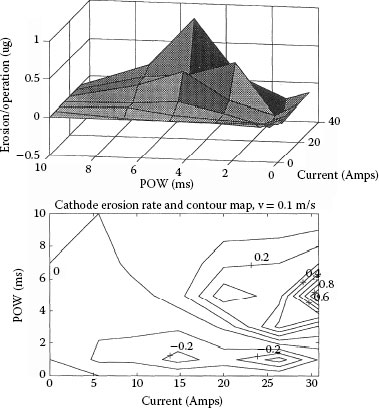
FIGURE 13.37
Cathode erosion per operation for Ag/CdO contacts, with current and POW for V = 240 V, 50 Hz, and an opening velocity of 0.1 m s−1. Upper figure shows the erosion vertically as a surface, lower figure shows the same data as a contour map.
13.7 Electrical Characteristics of Low Current Switching Devices at Closure
The mechanics of closing switch contacts have been considered in Section 13.4.3; the purpose of this section is to consider the effect of arcing on the bounce mechanics. For this purpose the “make” operation of low current contacts can be considered to occur in three distinct phases, [23,24]:
1. The pre-impact event
2. The first bounce with arcing
3. The bounces after the first bounce
When contacts open during a bounce, an arc may be initiated if the circuit conditions permit. This arc is similar to drawn arcs which occur during contact opening (see Chapters 10 through 12 and Section 13.5). Arcing changes the mechanical bounce characteristics, primarily as a result of heating of the contact surface. When a contact closes, a pre-impact arc is often formed for a short period prior to the first impact; this has small influence but the first impact is essentially a mechanical impact process. After the first impact period the contacts start to separate and the first bounce occurs. The first bounce produces an arc if the circuit conditions permit. An example voltage waveform is shown in Figure 13.38 for a dc supply, in the figure the voltage characteristic is shown off-set from the displacement data, the voltage shows the contacts closing at t = 0, the first impact occurs and the voltage rises to the minimum arc voltage, then as the contacts separate and come back together, the arc voltage is shown to rise, and to fall back to the minimum as the contacts come back together for the second impact. In the case of the dc supply the arc voltage reaches only a low voltage since the contact gaps during the bounce process are often small. Figure 13.38 shows the bounce characteristics of the same system used in Figure 13.39, but with a low voltage and a signal current supply, 2 V, 5 mA. This allows for a comparison between the mechanical bounce and the bounce with current for the same system conditions. The pre-impact arc is not observed since the duration is small compared to the overall event. A comparison of Figures 13.38 and 13.39 shows that the first bounce duration in both cases is similar; however, the bounce with arcing has a characteristic arc voltage. After the first bounce with arcing the surface of the contacts is heated such that when the contacts close for the second impact they will close on a molten metal surface; this will significantly influence the impact mechanics and allow more energy to be absorbed by the surface. The result of this process is that a bounce occurring after the first bounce will have a reduced duration and the whole process is over earlier than it would be with pure mechanical impact.
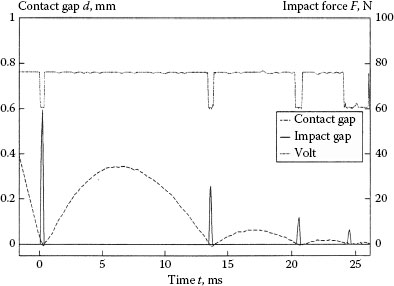
FIGURE 13.38
Mechanical make operation, showing the contact gap, contact force, and contact voltage as a function of time. The voltage is 2 V high and 0 V low.
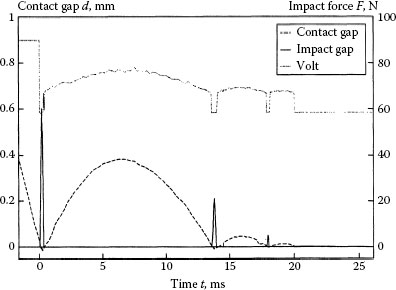
FIGURE 13.39
Make operation with arcing, showing the contact gap, contact force, and arc voltage as a function of time.
13.7.1 Contact Welding on Make
When contacts close, if the current is sufficient the arc roots are heated to their melting point, which can cause welding when the contacts re-close after a bounce. This dynamic welding is a danger to switching devices especially if the contacts close with a high inrush of current. The fact that the contacts have welded may only be discovered much later when the contacts are required to open. There are two solutions to this problem: the first is to reduce the contact bounce and the second is to use contact materials which are able to reduce the tendency to weld. Aggregate materials, for example Ag/C, Ag/CdO and Ag/SnO2 are used to overcome dynamic welding problems because their welding tendency is much less than pure silver, owing to a weaker structure.
13.7.2 Reducing Contact Bounce
The reduction of contact bounce can often be achieved by design as shown in Section 13.4.1, where a rocker switch was optimized to reduce moving-contact kinetic energy. In low-current devices cost is often a major design factor, thus no other elaborate bounce reduction methods can be used as these would increase the cost of the device, thus simple solutions are often sought. With rocker switch mechanisms the impact bounce can be reduced as already discussed by the reduction of the moving contact kinetic energy through a reduction in the moving-contact inertia, also by reduction of the impact velocity or by selecting a preferred switch arrangement (Section 13.4.1). In many low-current systems a combination of both approaches would appear to be the most satisfactory. In rocker-switch mechanisms the hair-spring system and the make-up arrangement are both beneficial in the reduction of contact bounce. In larger systems, for example contactors, control of the contact velocity can be shown to provide significant benefits to both the closing and opening characteristics.
When switching contacts close there is often a short-duration arc which occurs prior to the actual impact of the contacts; this arc is referred to as the pre-impact arc. The pre-impact arc can be seen to occur at voltages as small as 50 V, which is much lower than the minimum sparking voltage defined by Paschen’s law (see Section 9.3.2). This suggests that low-voltage, pre-impact arc is initiated by field emission.
A typical arc voltage characteristic is shown in Figure 13.40; this shows that the pre-impact arc is full arc which is initiated and continues to burn in metal vapor from the contacts themselves. The duration of the arc is shown to be in micro-seconds and is thus much shorter than the typical bounce duration which is often of milli-second duration. The duration of the pre-impact arc is not very repeatable, but experiments over a large number of impact events allow an understanding of the influence of contact velocity and supply voltage. Figure 13.41 shows the influence of impact velocity on the pre-impact arc time Tp, and shows that as the velocity of impact increases, the duration of the pre-impact arc reduces. This is shown to be affected by the supply, where a higher voltage gives a longer duration for the same impact velocity. The data presented here has been averaged over a large number of test conditions, [23]. As the contacts come together the greater the velocity the smaller the pre-impact arc, then the smaller the influence on the first impact. This is confirmed in Figure 13.42, which shows the evaluation of the coefficient of restitution for the first impact, eu for a range of impact velocities, with and without current. The curves presented are regression fits taken over a large number of data samples. At the low impact velocities (eg 0.1 m−1 s) it is shown that the pre-impact arcing sufficiently softens the surface to reduce e1 from 0.5 to 0.32 a reduction by 64%. At the higher impact velocities the reduction becomes marginal.
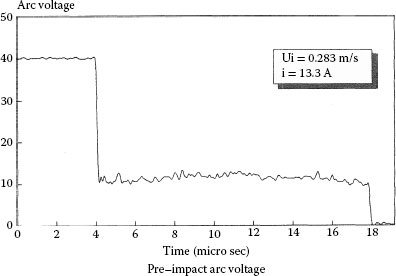
FIGURE 13.40
Pre-impact arc voltage for a system closing at 0.283 m/sec with a current of 13.3 A. The pre-impact arc time, Tp, is 14 μsec.
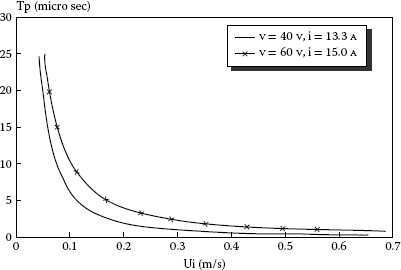
FIGURE 13.41
The effect of contact make velocity (ui) and supply on the pre-impact arc time (Tp) in μsec.
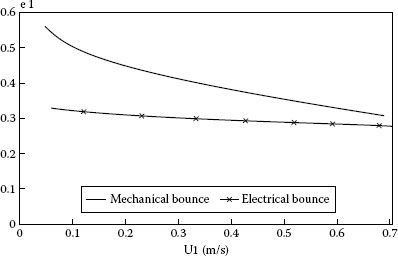
FIGURE 13.42
The effect of the pre-impact arc on the coefficient of restitution for the first impact event (e1) as a function of impact velocity (ui) and a comparison with a purely mechanical impact.
13.7.4 Influence of Velocity during the First Bounce
For the purpose of this section results are discussed from an experimental study of a pivoting contact mechanism shown in Figure 13.19. The values shown are thus specific to that mechanism; however, these results can be extrapolated to the more general case with arcing during the make process in manufactured devices. With the pre-impact arc occurring as contacts close there will be a small effect on the first impact process; this has been investigated in terms of the influence on the coefficient of restitution. Figure 13.43 shows a characteristic which is representative of the impact dynamics for both mechanical and electrical bounce during one contact closure. The mechanical bounce is defined as a bounce without arcing while the electrical bounce is defined as a bounce with arcing. The top trace shows four points corresponding to the evaluation of the coefficient of restitution e, during each impact for a single mechanical closure; with four impacts during the contact bounce process. The initial impact of 0.4 m−1 s gives a coefficient of e1 = 0.45, which then increases with the subsequent impacts. The increase in the coefficient of restitution between consecutive impacts shows that the value is a function of the impact velocity; the curve closely follows Figure 13.20, but in this case the surface will change between impacts, leading to work hardening which will tend to alter k in Equation 13.13. The curve shows that as the velocity of impact decreases e increases, producing more elastic behavior.
The lower curve shows the changes in e under the same initial conditions with the same contacts, but with a 15 A dc current passing between the contacts. The initial impact velocity of 0.4 m−1 s produces a lower coefficient of restitution for the first impact e1, than with the mechanical impact, as a result of the pre-impact arc discussed in Section 13.6.1. The following two impacts show the value of e decreasing. There are three impacts, compared to the four in the results without arcing. The relationship between the coefficient and the impact velocity can be defined by an empirical relationship:
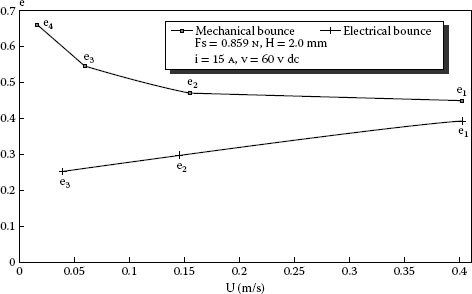
FIGURE 13.43
The variation of the coefficient of restitution during a single make event, with and without current flow.
(13.35) |
This relationship gives e as a function of velocity for the current of 15 A, for the particular contact conditions used in the experiment. The reduction in e can be explained with reference to Equations 13.13 and 13.20, since the second impact will occur on a softened surface. The degree of softening will be a function of the arc energy dissipation, but the impact mechanics will be primarily affected by the solid surfaces rather than the liquid metal interface, hence reducing p, the dynamic yield pressure. The third impact will occur on a surface heated further, leading to a further reduction in p and k, as defined in Equation 13.13.
Although the first impact event is influenced by pre-impact arcing it can be argued that, with reference to Figure 13.43, the reduction in ex is small compared to the effects after the first impact and bounce. The first bounce time can then be given with a reasonable approximation by Equation 13.24, in the form
(13.36) |
The evaluation of k can be established for a new contact from materials data; however, with a worn contact the value would be expected to change, as a result of changes in the surface roughness affecting the radius used in Equation 13.13. However, this only assumes that r changes and does not account for the heating effects on the contact materials. With contacts tested from new, it has been shown that the first bounce actually increases with wear, [24], which suggests that the changes in r are not important, and the impact mechanics depends more on the macro-surface characteristics rather than the micro-surface. Hence to a first approximation we can assume the k value used for the new contacts. Then in Equation 13.14, we can substitute for k, in doing so only the first and last terms become significant. In a further approximation, we can get a solution for e, shown in Equation 13.15, this can be substituted into Equation 13.35 to give the first bounce time T1
(13.37) |
In most situations, the first electrical bounce will account for most of the arc erosion. If the arc voltage can be assumed constant, for a small contact gap during the bounce, the design process should focus on the reduction of T1.
13.7.5 Bounces after the First
To account for the subsequent bounces, we can make two further assumptions: firstly that there are usually less than three electrical bounces, and secondly that the values of e can be expressed in the form of Equation 13.35, e.g.
(13.38) |
Then, by substitution into Equation 13.24 and 13.36,
(13.39) |
13.7.6 Summary of Contact Bounce
In this section, the phenomenon of contact bounce at make has been considered with respect to the low-current range. It has been shown that mathematical models can be developed for the analysis of the impact process and that this can be taken further from experimental observations to include the effect of current on the process. It has been shown that if the contact bounce follows the pattern where the first bounce is the largest and the subsequent bounces are smaller, then the event will be dominated by the first bounce. In many commercial systems the bounce process may not follow this pattern as the bounce may be affected by nonlinearities, such as the elastic properties of the main contact support structure or the interaction of a contact bridge arrangement. In low-current hand-operated switching devices the bounce may be made complex by the nature of the moving contact; for example, the characteristic shown in Figure 13.14 is highly nonlinear as a result of vibration affects.
In this section, the key elements from this chapter are summarized, and based upon the description of switching devices given, some design recommendations are offered. The design points are only general, as specific recommendations by definition would be unique to the device under consideration.
From the consideration of rocker-switch mechanisms, the impact of the moving contact during a make operation is very important to the successful operation of a switch.
In the case of the make-down configuration, it has been shown that a moving contact with a relatively high inertia will result in a separation at the pivoting contact as the main contact closes. The change-over configuration shown in Figure 13.2 will be particularly susceptible to this. In the make-down, on-off configuration shown in Figure 13.3 the pivot will have less tendency to separate, because of the lower inertia. In the make-up configuration shown in Figure 13.4, when the main contact impacts the moving contact is unable to continue moving in the same direction at the pivot interface, therefore the bounce that occurs at the main contact will be the main dynamic event. The parameter that best describes the likelihood of bounce other than the geometry of the device is the kinetic energy in the moving contact, since it is the kinetic energy that needs to be dissipated in the switching action to bring the system to rest. With an objective to reduce the kinetic energy at impact there are three main solutions:
1. Reduce the inertia of the moving contact
2. Reduce the impact velocity of the contacts
3. Increase the absorption of the energy of impact in the materials
In most devices, the opening velocity will be dominated by a nonlinear acceleration profile, which will depend upon the nature of the actuating method. In the case of an electromechanical relay, for example, it is the pull-in characteristic of the solenoid, or the release of the solenoid under spring forces.
In general, the erosion or deposition of contacts is defined in terms of the mass changes of the contacts and contact resistance measurements. The mass measurement must however be treated carefully as it is possible for a contact to exhibit a zero mass change where there has been both erosion and surface deposition on the same contact.
For dc conditions the contact erosion rate is reduced as the contacts are opened more quickly. There are, however, consequences of a fast mechanism in that on making the contact there is likely to be more contact bounce, as a result of the increased kinetic energy in the system.
To summarize, the following applies to dc arcs. Very short arcs (less than a few microns depending on the contact material, activation, oxide layers etc.) occur when breaking very small current results in anodic erosion (from anode to cathode). For arcs longer than a few microns the erosion is cathodic for relatively short arcs. Increasing the arc length and/or current can change the arc transfer in some materials from cathodic to anodic.
In ac circuits, the polarity of the contacts at opening is a random event and in general at low current very little transfer is usually observed; however, if the contacts are unsymmetrical (made of two different types of materials) net transfer from one contact to the other may be observed. Net material transfer in ac circuits may also occur if the switch operation has a preferred point-on-wave (POW), in which case the polarity of the electrodes is fixed; this would be similar to dc erosion. Both contacts will suffer from a change in the contact surface as a result of the arcing, which may lead to parts of the contact surface suffering more than other parts of the surface. In addition to this, as the current increases there is more likelihood of mass being lost to the surrounding environment as droplets of molten metal are expelled from the arc roots.
It has been shown that contact bounce can be reduced by control of a number of parameters: for example, reduction of impact velocity, reduction of moving contact inertia, energy absorption at the contacts or in the contact structure, and increasing the contact force in a given mechanism. The selection of the parameter which will best suit a given situation or device varies. For example, a damped actuator could be used on an electromagnetic actuator to reduce the impact velocity and thus reduce the contact bounce, but this would be a costly addition to most low-current switches.
The “make” operation of low-current contacts can be considered in three distinct phases:
1. The pre-impact events
2. The first bounce with arcing
3. The bounces after the first bounce
With arcing occurring with a high in-rush of current during the bounce process here is significant heating of the contact surface, resulting in the possibility of welding. There are two solutions to this problem: the first is to reduce contact bounce and the second is to use contact materials which are able to reduce the tendency to weld. Aggregate materials like Ag/CdO and Ag/SnO2 are used to overcome the dynamic welding problems because their welding tendency is much less than pure silver, owing to their weaker structure.
13.8.3.2 Reducing Contact Bounce
The reduction of contact bounce can often be achieved by design. In low-current devices cost is often a major design factor, thus no other elaborate bounce reduction methods can be used as these will increase the cost of the device, thus simple design solutions are often sought. With rocker-switch mechanisms the impact bounce can be reduced as already discussed by reduction of the moving-contact kinetic energy through a reduction in the moving-contact inertia, also by reduction of the impact velocity or by selecting a preferred switch arrangement. In many low-current systems a combination of both approaches would appear to be the most satisfactory. In larger systems, for example contactors, control of contact velocity can be shown to provide significant benefits to both closing and opening characteristics.
13.8.3.3 Arcing during the Bounce Process
It has been shown that mathematical models can be developed for the analysis of the impact process and that this process can be taken further by the consideration of experimental observations, to include the effect of current on the process. It has been shown that if the contact bounce follows the pattern where the first bounce is the largest and subsequent bounces are smaller, then the event will be dominated by the first bounce, since the subsequent bounces will be reduced by the influence of arc heating the surface and dissipating subsequent bouncing. In many commercial systems the bounce process may not follow this pattern as the bounce may be affected by nonlinearities such as the elastic properties of the main contact support structure or by the interaction of a contact bridge arrangement.
The author of would like to acknowledge a team of researchers with whom I have supervised and directed over the years on research in the field of electrical contacts; a real honor and privilege; these include Dr’s Jonathan Swingler, Paul Weaver, Suliman Abu-Sharkh, Peter Jeffery, Kersorn Pechrach, Esa Yunnus, Alan Sumption, Christian Maul, and Wu Leung Ng. I would also thank my family and friends.
1. JW McBride, D Mapps, PJ White. Design optimisation of rocker-switch dynamics to reduce pivot bounce and the effect of load current in modifying bounce characteristics. IEEE Trans Components Hybrids and Manuf. Technol. CHMT9 (3): pp258–264, 1986.
2. JW McBride, D Mapps, PJ White. The influence of rocker switch dynamics on contact erosion. IEEE Trans Components Hybrids and Manuf. Technol. CHMT11 (1): pp137–144, 1988.
3. JW McBride. The accelerated testing of hand operated switches. Proceedings of the 14th International Conference on Electrical Contacts, Paris, pp61–67, 1988.
4. R. Hienonen, T. Saarinen. Reliability test on Membrane switches. Proceedings of the IEEE Holm Conference on Electrical Contacts, pp561–571, 1984.
5. J Praquin, C Gautherot, J Rivenc, N Benjemaa, R Elabdi, JBA. Mitchell, E Carvou. Influence of contact resistance in carbon-gold contacts in automotive keypad switches. Proceedings of the IEEE Holm Conference on Electrical Contacts, pp323–328, 2010.
6. Y Hayashi, M Baba, T Hara. Study on bridge phenomena of Sn-Rh and Rh-Sn-Rh contacts for dry reed switch. Proceedings of the IEEE Holm Conference on Electrical Contacts, pp541–547, 1978.
7. H Grossman, M Huck, G Schaudt, FJ Wagner. Make and break properties of electrodeposits. Proceedings of the IEEE Holm Conference on Electrical Contacts, pp551–560, 1984.
8. PM Weaver, K Pechrach, JW McBride, Arc root mobility on piezo-electrically actuated contacts in miniature circuit breakers. IEEE Trans Components Packaging Technol, 28, (4), pp734–740, 2005.
9. TJ Schopf, WF Rieder. The reliability of bearings in the current path of switches. Proceedings of the 17th International Conference on Electrical Contacts, Nagoya Japan, pp725–733, 1994.
10. M Maeda, M Kinoshita, T Yoshimura, K. Genma. Effects of joints on contact reliability in miniature precision snap-action switches. Proceedings of the 36th Holm Conference on Electrical Contacts (15th ICEC), pp358–369, 1990
11. DJ Mapps, PJ White. Performance characteristics of snap-action switches with silver-cadmium-oxide contacts. IEEE Trans. on Components, Hybrids and Manuf. Technol. CHMT 4 (1): pp237–242, 1981.
12. DJ Mapps, PJ White. Investigation of available toggle switches for thermostatic control systems. Proc. Inst. Electrical Engineers part B 128(5): pp237–242, 1981.
13. PJ White, DJ Mapps. Zero current synchronization of opening switch contacts. IEEE Trans Components Hybrids and Manuf. Technol CHM-9 (3): pp252–257, 1986.
14. ML Gayford. Modern Relay Techniques. STC Monograph No 1. London: Butterworth, 1969.
15. RL Peek, HN Wagar. Switching Relay Design. New York: Van Nostrand, 1955.
16. W Ren, H Liang, Y. Chen, L Cui, L Wang, Y Kang. Mechanical and electrical characteristics of the electromagnetic relay under vibration and shock environment. Proceedings of the IEEE Holm Conference on Electrical Contacts, pp1–47, 2009.
17. R Holm. Electric Contacts. Berlin: Springer-Verlag, 4th Edition, Reprinted 2000.
18. FP Bowden, D Tabor. The Friction and Lubrication of Solids. Oxford: Clarendon Press, 1964.
19. W Goldsmith, CH Yew. Stress distribution in Soft Metals owing to static and dynamic loading by a steel sphere. J Appl. Mech. 31: pp635–646, 1964.
20. D Tabor. The Hardness of Metals. Oxford: Clarendon Press, 1951.
21. P Barkan. A study of the contact bounce phenomena. IEEE Trans on Power App and Systems PAS-86 (2): pp231–240, 1967.
22. W Goldsmith. Impact. London: Edward Arnold, 1960.
23. JW McBride. Electrical contact bounce in medium duty contacts. IEEE Trans. Components, Hybrids, Manuf. Technol 12 (1): pp82–90, 1989.
24. JW McBride, SM Sharkh. Electrical contact phenomena during impact. IEEE Trans. Components, Hybrids, Manuf. Technol 15 (2): pp184–192, 1992.
25. JW McBride, KJ Cross, SM Sharkh. The evaluation of arc erosion on electrical contacts using 3D surface profiles”. IEEE Trans. Components, Hybrids, Manuf. Technol 19 (1): pp87–97, 1996.
26. JW McBride. The volumetric erosion of electrical contacts. IEEE Trans. CPT Vol. 23 (2): pp211–221, 2000.
27. JW McBride. A review of volumetric erosion studies in low voltage electrical contacts. Technical Report of IEICE2001-45, pp1–8, 2001.
28. JW McBride. A review of surface erosion measurements in low voltage switching devices. International Conference on Electrical Contacts, Zurich, Switzerland, pp462–470, 2002.
29. J Wolf. Erosion and material transfer measurement with the aid of a surface analyser. Holm Conference on Electrical Contacts, pp69–74, 1979.
30. D Zhang, M Hill, JW McBride. Evaluation of the volumetric erosion of spherical electrical contacts using the defect removal method. IEEE Trans. Components. Packag. Manuf. Technol 29 (4): pp711–717, 2006.
31. JW McBride, M Hill, D Zhang. A feature extraction method for the assessment of the form parameters of surfaces with localised erosion. Wear 256 (3–4): pp243–251, 2004.
32. J Swingler, A Sumption, JW McBride. The evolution of contact erosion during an opening operation at 42V. Proceedings of the Fifty-First IEEE Holm Conference on Electrical Contacts, pp346–351, 2005.
33. JW McBride, AP Sumption, J Swingler. On the evaluation of low level contact erosion in Electrical Contacts. Proceedings of the 50th IEEE Holm Conference on Electrical Contacts and the 22nd International Conference on Electrical Contacts, pp370–377, 2004.
34. BODDIES software analysis tool, TaiCaan Technologies Ltd, 2012. Available at http://www.taicaan.com/software_eng.html.
35. M Hasegawa, K Izumi, Y Kamada. New algorithm for volumetric analysis of contact damages with laser microscope data. International Conference on Electrical Contacts, pp337–342, 2006.
36. M Reichart, C Schrank, G Vorlaufer. Investigation of material transfer by 3D precision alignment of topographical data of electrical contact surfaces. IEEE Holm Conference on Electrical Contacts, pp313–318, 2008.
37. JJ Shea. High Current AC Break Arc Contact Erosion. IEEE Holm Conference on Electrical Contacts, pp22–47, 2008.
38. JW McBride, PM Weaver. Review of arcing phenomena in low voltage current limiting circuit breakers. IEE Proc. – Sci. Meas. Technol. 148 (1): pp1–7, 2001.
39. JW McBride, A Balestrero, L Ghezzi, G Tribulato, KJ Cross. Optical fiber imaging for high speed plasma motion diagnostics: applied to low voltage circuit breakers. Rev. Sci. Instrum. 81 (5): 055109-[6pp], 2010.
40. M Sato. Studies on the silver base electrical contact materials. Trans Nat Res Inst. Metals 18 (2): pp65–83, 1976.
41. JW McBride, SM Sharkh. The influence of contact opening velocity on arc erosion. Proceedings of the 16th International Conference on Electrical Contacts, UK, pp395–100, 1992.
42. JW McBride, SM Sharkh. Arc voltage fluctuations at low current. Proceedings of the Electrical Contacts ISECTA, Alma Alta, pp216–220, 1993.
43. EW Gray. Voltage fluctuations in low-current atmospheric arcs. J Appl. Phys. 43 (11): pp43–46, 1972.
44. EW Gray. Some spectroscopic observations of the two regions (metallic vapour and gaseous) in break arcs. IEEE Trans Plasma Sci. PS-1 (1): pp30–33, 1973.
45. DJ Dickson. A von Engel. Resolving the electrode fall spaces of electric arcs. Proc. Roy Soc. A300: pp316–325, 1967.
46. PJ Boddy, T Utsumi. Fluctuation of arc potential caused by metal-vapour diffusion in arcs in air. J Appl. Phys. 42 (9): pp3369–3373, 1971.
47. T J Schöpf, WF Rieder. Consequences for automotive relays of a 42VDC power network in vehicles. IEEE Trans. Components, Packaging Technol. 23: pp177–182, 2000.
48. TJ Schoepf. Electrical contacts in the automotive 42 VDC PowerNet. International Conference on Electrical Contacts, Switzerland, September, 2002.
49. N Ben Jemaa, L Doublet, L Morin, D Jeannot. Break arc study for the new electrical level of 42 V in automotive applications”. Proc. 47th IEEE Holm Conf. Montreal, pp50–55, 2001.
50. E Carvou, N Ben Jemaa. Electrical arc study in the range of 14-112VDC for automotive power contacts. International Conference on Electrical Contacts, pp28–33, 2006.
51. J Swingler, JW McBride. Micro-arcing and arc erosion minimization using a 42 volt DC hybrid switching device. IEEE Trans. Components, Packaging Technol. 31 (2): pp425–430, 2008.
52. J Sekikawa, T Kubono, Motion of break arcs driven by external magnetic field in a 42V resistive circuit. IEICE Trans. Electron E91-C (8): pp1255–1259, 2008.
53. A Vassa, E Carvou, S Rivoirard, L Doublet, C Bourda, D Jeannot, P Ramini, N Ben Jemaa, D Givord. Magnetic blowing of break arcs up to 360 VDC. International Conference on Electrical Contacts, pp96–100, 2010.
54. AE Guile. Arc-electrode phenomena. Proc. IEEE Rev 18 (9R): pp1131–1154, 1971.
55. LH Germer. Physical processes in Contact Erosion. J Appl. Phys. 29 (7): pp1067–1082, 1958.
56. JW McBride, SM Sharkh. The effect of contact opening velocity and the moment of contact opening on the ac erosion of AgCdO contacts. IEEE Trans Components, Packaging Manuf. Technol 17 (1): pp2–7, 1994.
57. ZK Chen, H Mizukoshi, K Sawa. Contact resistance characteristics of Ag material in breaking low-load DC arcs. IEEE Trans Components, Packing, and Manuf. Technol Part A 17 (1): pp113–120, 1994.
58. DJ Mapps, PJ White. Performance characteristics of snap-action switches with silver-cadmium-oxide contacts. Proceedings of the IEEE 26th Holm Conference on Electrical Contacts, pp177–183, 1980.
59. SM Sharkh, JW McBride. Arc erosion in AC and DC circuits. Proceedings of the 17th International Conference on Electrical Contacts (ICEC’94), Nagoya, Japan, pp569–576, 1994.
60. M Sato, M Hijikata, I Morimoto. Influence of oxides on materials transfer behaviour of silver base contacts containing various metal oxides. Trans. Japan Inst. Metals 15 (6): pp399–407, 1974.
61. CH Leung, A Lee. Electric contact materials and their erosion in automotive DC relays. IEEE Trans Components, Packing, and Manuf. Technol, Part A 15 (2): pp46–153, 1992.
62. M Lindmayer, KH Schroder. The effect of unsymmetrical material combination on contact and switching behaviour. IEEE Holm Conference on Electrical Contacts, pp265–271, 1978.
63. I Neveri. Proper pairing of different contact materials for increasing the reliability of low-voltage switches. Proceedings of the International Conference on Electrical Contacts, Japan, pp301–307, 1976.
64. FA Holmes, PG Slade. The erosion characteristics of Ag contacts and the effect of adding a small percentage of W. IEEE Trans Parts, Hybrids and Packaging PHP-13 (1): pp23–30, 1977.
65. FA Holmes, PG Slade. Suppression of pip and crater formation during interruption of AC circuits. IEEE Trans Components Hybrids and Manuf. Technol. CHMT-1 (1): p59–65, 1978.