9
Cell Tracking and Deep Tissue Imaging
Cell labeling, both specific and nonspecific, discussed in the previous chapter belongs in part to the field of cell therapy, defined as “administration of live whole cells or maturation of a specific cell population in a patient for the treatment of a disease” [1]. Cell therapy is an emerging field in the medical research as a promising treatment option for human injuries and diseases [2]. While the first use of cells for therapeutic purposes can be traced to the nineteenth century [3], much is still lacking in our knowledge of the therapy, including the biodistribution, pharmacokinetics, and pharmacodynamics of transplanted human cells in vivo [4]. Such knowledge is essential for detailed understanding of the cells’ development, fate, and contribution to regenerating tissues prior to clinical trials.
The advent of nanotechnology in the 1980s (Section 1.1) makes it possible to produce innovative fluorescent markers to solve this long‐standing cell tracking issue. High expectation has been raised for using functional nanomaterials to overcome limitations inherited in conventional therapeutic and diagnostic approaches [5]. However, in this type of application, it is critical to ensure that the cell labeling technique is robust and safe to use. Inorganic fluorescent nanoparticles such as quantum dots have been considered as a potential candidate owing to their superior optical properties [6]. But there is always a concern about the inherent toxicity of this cadmium‐based compound [7], which may impede its real‐world applications in nanomedicine. As a new star in the field, fluorescent nanodiamonds (FNDs) with their superlative optical properties and excellent biocompatibility provide a favorable and appealing alternative [8–11]. In this chapter, we discuss the research and development of FNDs as cell trackers and their use in deep tissue imaging. The first step in cell tracking with this new technology is the uptake of FNDs by cells.
9.1 Cellular Uptake
9.1.1 Uptake Mechanism
We have discussed in Section 8.1 how a cell can be labeled with FNDs by endocytosis. Cellular uptake by endocytosis is an energy‐expending process and the major pathways include clathrin‐mediated endocytosis, caveolar‐type endocytosis, phagocytosis, and macropinocytosis [12]. During endocytosis, the engulfed nanoparticles are pinched off from the cell membrane and then enclosed within the membrane‐bound endosomes, through which they are carried into the cell interior along a network of tubulovesicular membranous structure [13]. For cultured mammalian cells, almost one‐half of the endocytic uptakes can go through non‐clathrin processes. Although it has been reported that some nanoparticles may slip through cell membrane and/or directly penetrate into cells, the mechanism is still difficult to confirm.
To optimize the cell labeling conditions for FNDs by endocytosis, it is necessary to know their exact uptake mechanism. Chang and coworkers [14], as well as other research groups [15–19], have methodically examined the uptake mechanism and pathways for FNDs through a battery of metabolic and cytoskeletal inhibitors, with their functions listed in Table 9.1 [20]. In this series of experiments, cells were first treated with inhibitors for 30 minutes, washed, and then incubated with FNDs for 3 hours. After another thorough wash to remove free FNDs, cells were harvested and the amount of the internalized FNDs was determined by flow cytometry (Section 8.1). Figure 9.1a displays a typical result for HeLa cells nonspecifically labeled with bare FNDs. It was found that preincubation of the cells with sodium azide and 2‐deoxyglucose and phenylarsine oxide blocked the FND uptake down to a level comparable to that of control cells without the FND treatment. In contrast, preincubation with filipin resulted in a level of FND uptake similar to those without the inhibitor treatment. The observations strongly suggested that the FND uptake was through an energy‐dependent clathrin‐mediated endocytosis and the claveolae‐mediated pathway was not involved in the uptake process. Cytochalasin D [21] and nocodazole [22] were next tested for their effectiveness in blocking the cellular uptake of FNDs. As seen in Figure 9.1a, pretreatment of the cells with these two chemicals decreased the FND uptake close to the control cell level, an indication that both microfilaments and microtubules also played important roles in the endocytic process.
Table 9.1 Biochemical and physiological actions of some representative endocytosis inhibitors.
Source: From Ref. [20]. Reproduced with permission of Springer.
| Name of inhibitors | Biochemical and physiological actions |
| Sodium azide and 2‐deoxyglucose | Depletion of intracellular ATP |
| Phenylarsine oxide | A clathrin inhibitor |
| Filipin | A claveolae‐specific inhibitor |
| Cytochalasin D | An inhibitor of actin‐dependent endocytosis through exerting its effect by depolymerizing the cellular actin microfilament network |
| Nocodazole | An inhibitor of microtubule‐dependent endocytosis through effective blocking of tubulin self‐assembly |
Figure 9.1 Flow cytometric analysis of the mechanism of FND uptakes by (a) human HeLa cells and (b) murine 3T3‐L1 pre‐adipocytes. Cells were preincubated with various inhibitors for specified time, followed by incubation with FNDs for three hours before cell harvest for the analysis. PAO, phenylarsine oxide; CytD, cytochalasin D; Noco, nocodazole. The first two columns in each figure represent control experiments.
Source: Reprinted with permission from Ref. [14].
With HeLa cells as the model cell line, the above results indicate that the cellular uptake of FND is (i) energy dependent, (ii) claveolae independent, (iii) clathrin‐mediated, and (iv) involving an intact cellular microfilament and microtubule architecture. To examine whether the uptake mechanism of bare FNDs was cell‐type specific, a well‐established murine pre‐adipocyte cell line (3T3‐L1) was chosen for a comparative study. Analogous to the cases of HeLa cells, preincubation with a combination of metabolic inhibitors, sodium azide, 2‐deoxyglucose, and phenylarsine oxide, reduced the FND uptake level to that of control cells (Figure 9.1b). In addition, treatment with filipin did not appreciably influence the internalization of FNDs, whereas the pretreatment with cytochalasin D and nocodazole led to a modest decrease of the FND uptake by 3T3‐L1 cells. It led to the conclusion that the overall FND uptake mechanism and pathways were similar to each other between these two different types of cell lines. However, more work involving other kinds of cells is needed before any final conclusion can be made on the specificity in the mechanism of FND uptake.
9.1.2 Entrapment
Once internalized by cells, FNDs are primarily trapped in endosomes and lysosomes. A lysosome is a membrane‐bound organelle containing hydrolytic enzymes that can degrade virtually all kinds of biomolecules. The pH value of the lysosome lumen is approximately 4.8, optimal for the enzymes involved in the hydrolysis [23]. Although the pH is low and the enzymatic activity is high within these cellular compartments, the internalized FNDs should stay intact therein because of their extreme chemical inertness. A number of colocalization studies of FNDs and endosomal/lysosomal markers by confocal fluorescence imaging have confirmed the occurrence of the entrapment (Section 8.2.1), while a report claimed that some prickly FNDs could undergo quick endosomal escape due to the shape effect [19, 24]. Tested over a wide range of cancer and stem cells, including human cervical cancer cells [25], human liver carcinoma cells [19, 24], mouse pre‐adipocytes [14], mouse lung stem/progenitor cells [26], mouse primary neurons [27], and human mesenchymal stem cells (MSCs) [28], neither entrapped nor escaped FNDs have shown any measurable cytotoxic and detrimental effects. Indeed, FND is a user‐friendly agent for cell labeling applications.
In a recent study, Liu et al. [29] investigated in detail the molecular endocytic mechanisms and cellular trafficking pathways of 100‐nm FNDs in cells. The research focused on the autophagy pathway, a key mechanism for decomposing cellular components or foreign pathogens [30]. Although studies have shown that FNDs can be taken up by cells and subsequently trapped in endosomes and lysosomes, their intracellular processing through selective autophagy [31] has not been known. To address this question, the research team first fed adenocarcinomic human alveolar basal epithelial cells (A549 cells) with bare FNDs and then isolated protein–FND complexes from the cell lysates by modified sucrose density gradient centrifugation. Based on the Western blotting analysis at different time points, the FND particles were found first coated with ubiquitin (Ub), which is a 76‐amino acid protein, and then bound to the autophagy receptor p62, which interacts with ATG8 (autophagy‐related protein 8)/LC3 (light‐chain 3) to enter the selective autophagy pathway. In addition, the selective autophagy receptors OPTN and NDP52 were also involved in the decomposition of the ubiquitinated particles. The FNDs were finally deposited in lysosomes during cell division. Figure 9.2 displays a model of how Ub‐coated NDs can be conjugated with autophagy receptors, a process essential for the nanoparticles to enter the selective autophagy pathway. It is expected that a detailed understanding of the molecular mechanism of the cellular uptake will greatly facilitate the use of the carbon‐based nanomaterials as cell tracking devices and drug delivery vehicles for biomedical applications (Chapter 13).
Figure 9.2 Schematic illustration of a proposed model on how Ub‐coated FNDs bind with autophagy receptors when entering the selective autophagy pathway, leading to entrapment in the lysosome.
Source: Reprinted with permission from Ref. [29]. Reproduced with permission of Taylor & Francis.
9.1.3 Quantification
In Figure 9.1, data collected from flow cytometric measurements show that a substantial amount of FND particles can be taken up by HeLa cells in the absence of serum. However, it is known that flow cytometry provides only a relative measure for the degree of cell labeling. What is the absolute amount of FNDs entrapped in cells? Su et al. [28] applied the magnetically modulated fluorescence (MMF) technique discussed in Section 6.2.4 to address this issue. In this proof‐of‐principle experiment, FNDs were first coated with human serum albumin (HSA) by physical adsorption (Section 4.2.1) and then fed to A549 cells and HeLa cells at the particle concentrations of 10–200 μg ml−1. The cellular uptake was later quantified by laser‐induced fluorescence after removal of untaken HSA‐FND particles in the medium. To conduct the analysis, a standard calibration curve was first prepared by plotting the measured fluorescence intensity against the FND concentration gradient. The amounts of internalized FNDs were then determined from the fluorescence intensity measurements for the FND‐labeled cells (1 × 10⁶ cells ml−1) after sonication in water for one hour to break up their plasma membrane in a cuvette. For A549 cells incubated with 100 μg ml−1 HSA‐FND at 37 °C for 4 hours, an average weight of 6.0 pg (or ~3.2 × 10³ particles) was measured for the internalized FNDs. The weight decreased monotonically as the HSA‐FND concentration was reduced, until eventually reaching to zero (Figure 9.3a). The result was in good correlation with flow cytometric analysis of the same cells incubated under the same conditions (Figure 9.3b). Compared with A549, HeLa cells were able to take up twice more particles, reflecting a distinguishable difference in the endocytic behavior between these two types of human cell lines.
Figure 9.3 Detection and quantification of FNDs in cells and tissues. (a) Dose‐dependent uptakes of HSA‐coated FNDs by A549 cells and HeLa cells in culture, analyzed by MMF. (b) Comparison of the uptakes of HSA‐coated FNDs by A549 cells, analyzed by both MMF and flow cytometry. (c) Normalized fluorescence spectrum of FNDs (5 μg ml−1) in an acid digest of pig liver tissue (black) and its FFT spectrum (red) after demodulation at f = 2 Hz. The asterisk denotes the Raman peaks of water. FFT, fast Fourier transform.
Source: Adapted with permission from Ref. [28].
The high detection sensitivity provided by the magnetic modulation method also enables researchers to quantify the amount of FNDs in organs and tissues. In the same experiment as discussed earlier, Su et al. [28] spiked FNDs (25 μg) in a sample solution (5 ml) prepared by digestion of pig liver tissue (1 g) in a concentrated HNO3/H2O2 mixture at 140 °C for several hours. Fluorescence intensities were then measured directly for the FNDs in the tissue digests without extraction or other separation procedures to avoid loss of the particles during otherwise required centrifugation or filtration treatments [32, 33]. Due to the nanomaterial’s chemical robustness, FNDs could still preserve their unique magneto‐optical properties, allowing the magnetic modulation to recover their fluorescence signals from the acid digests at a concentration as low as 1 μg ml−1. The recovery rate was more than 90%, despite the fact that the spectra were overwhelmed by the Raman peaks of water, residual chemicals, and cell lysates (Figure 9.3c). It should be noted that such a high level of quantitative analysis would not be possible with molecular fluorophores like organic dyes and fluorescent proteins because of their lack of chemical stability in strong acids.
9.2 Cell Tracking
9.2.1 Tracking In Vitro
In using nanoparticles as a cell tracking device, it is preferable to label the cells with a high‐density ensemble of the agents. The reason is that when cells divide, the amount of nanoparticles in each labeled cell will decrease by half, a destined fate that could potentially impede any long‐term cell tracking. Consider a cell with a doubling time of 24 hours in culture [34]. It is possible to conduct the tracking up to 10 days if the cell is initially labeled with 1024 (or 210) FND particles that can be detected individually in cellular compartments by confocal fluorescence microscopy (Section 7.1). Figure 9.4a displays snapshots of a real‐time tracking of some internalized FNDs through the cell cycle of a FND‐labeled HeLa cell by bright‐field/epifluorescence microscopy [24]. These particles were predominantly entrapped in lysosomes for disposal but, surprisingly, no significant exocytosis of the lysosomal FNDs was found during cell proliferation. The result could be rationalized by the FND’s chemical inertness and high biocompatibility, and that particle excretion was an energy‐expending process. A combination of these unique features made it possible for the research team to track continuously the fate of the FND‐labeled HeLa cells over eight generations by flow cytometry (Figure 9.4b), confirming the long‐term labeling and tracking capabilities of the FND‐based platform for cell division, proliferation, and differentiation studies.
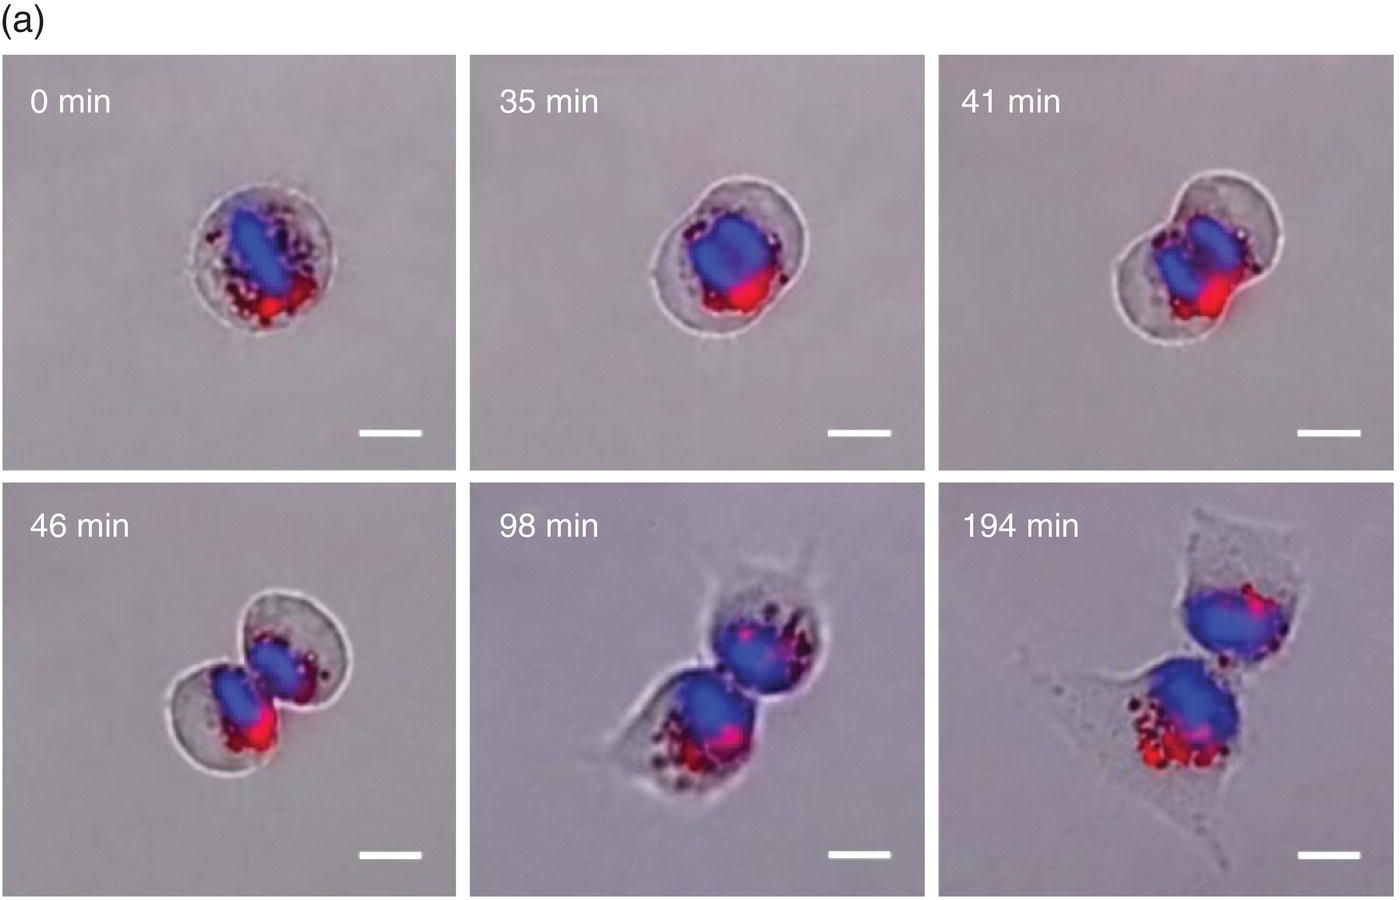

Figure 9.4 (a) Time‐lapse images of a FND‐labeled HeLa cell undergoing division, acquired by differential interference contrast and epifluorescence microscopy. (b) Long‐term tracking of FND‐labeled HeLa cells over eight days by flow cytometry. The fluorescence intensity of each cell decreases exponentially with time due to cell proliferation.
Source: Adapted with permission from Ref. [25]. Reproduced with permission of John Wiley & Sons.
The FND‐enabled technology, derived mainly from the particle’s extraordinary properties, soon finds applications in the studies of slow‐proliferating and quiescent cancer stem cells (CSCs), which have long been considered to be a source of tumor initiation [35]. In the past, there was a lack of effective tools among the traditional materials for CSC identification and isolation even in vitro. Now, being both chemically and photophysically stable, FNDs become an excellent choice to serve the purposes for long‐term tracking. Prior to the cell finding/tracking experiments, Lin et al. [36] first carried out genotoxicity tests with comet and micronucleus assays for human fibroblasts and breast cancer cells to confirm that FNDs neither caused DNA damage nor impaired cell growth (Section 5.1). They then employed AS‐B145‐1R breast cancer cells as the model cell line for CSCs and compared in parallel the performance of FNDs and the commonly used cell trackers, carboxyfluorescein diacetate succinimidyl ester (CFSE) and 5‐ethynyl‐2′‐deoxyuridine (EdU). Their results indicated that the nanotechnology‐based method was capable of quantitative analysis of the FND‐labeled cells by flow cytometry and also outperformed CFSE and EdU in the comparative long‐term tracking capability (Figure 9.5). It is anticipated that further integration of the FND‐enabled cell tracking platform with the functional assays of protein markers will greatly enhance our knowledge of the properties of CSCs both in vitro and in vivo.
Figure 9.5 Comparison of the long‐term tracking capability of EdU, CFSE, and FND. The assays were conducted for the mammospheres generated from AS‐B145‐1R cells labeled separately with EdU, CFSE, and FND and then dissociated for flow cytometric analysis with a 4‐day period for 20 days.
Source: Reprinted with permission from Ref. [36].
9.2.2 Tracking In Vivo
Stem cells are a group of undifferentiated biological cells with the ability to self‐renew and differentiate into various specialized cells [23]. These cells are delicate and fragile, and their properties including growth rate and differentiation capacity are prone to the interference by fluorescent labeling and gene transfection. Therefore, an ideal method for tracking stem cells must be biocompatible and nontoxic, require no genetic modification, have single‐cell detection sensitivity, and permit quantification of cell numbers at any anatomic location [37]. FNDs are among the few nanomaterials that can fulfill just about all these requirements listed in Table 9.2.
Table 9.2 Characteristics of an ideal imaging technology for stem cell tracking during clinical trial.
Source: From Ref. [37].
| Number | Characteristics |
| 1. | Biocompatible, safe, and nontoxic |
| 2. | No genetic modification or perturbation to the stem cell |
| 3. | Single‐cell detection at any anatomic location |
| 4. | Quantification of cell number |
| 5. | Minimal or no dilution with cell division |
| 6. | Minimal or no transfer of contrast agent to nonstem cells |
| 7. | Noninvasive imaging in the living subject over months to years |
| 8. | No requirement for injectable contrast agent |
Wu et al. [26] pioneered the application of the FND labeling technique to track the engraftment and regenerative capability of lung stem cells (LSCs) transplanted into mice. In vitro experiments first verified that the FND labeling did not eliminate the properties of the LSCs extracted from neonatal mouse lung tissues to self‐renew and differentiate into type I and type II pneumocytes. The FND‐labeled LSCs were then injected into lung‐injured mice via intravenous administration. Finally, mice were sacrificed and organs were collected at different time points to search for the injected LSCs by fluorescence microscopy. However, as commonly encountered in tissue section imaging, the high‐level autofluorescence noises in the background prevent clear identification of the target cells in the specimens. To improve the image contrast, fluorescence lifetime imaging microscopy (FLIM) serves as an ideal approach because the NV− centers in FNDs have a significantly longer emission lifetime than that of autofluorescence (Section 8.2.4). Figure 9.6 shows FLIM images of the lung tissue collected on day 1 and 7 [26]. The injected cells could be easily discerned, even when the cells were stained with hematoxylin and eosin (H&E) to aid histological examination. It was found that the FND‐labeled LSCs preferentially resided at the terminal bronchioles of the lungs on day 7 after intravenous administration, as confirmed by time‐gated fluorescence (TGF) imaging of the tissue sections of naphthalene‐injured mice with single‐cell resolution. Moreover, the damaged lung cells could rapidly recover after transplantation of the FND‐labeled LSCs into the mice. The study offered new insights into the components that limited the acceptance of the transplanted stem cells as well as the mechanism of their regeneration within a host. The FND labeling method is simple and general, holding great potential for monitoring the homing of different kinds of stem cells (such as MSCs) in larger animal models (such as miniature pigs) for preclinical experimentation with important implications for future stem cell therapy and cancer treatment.
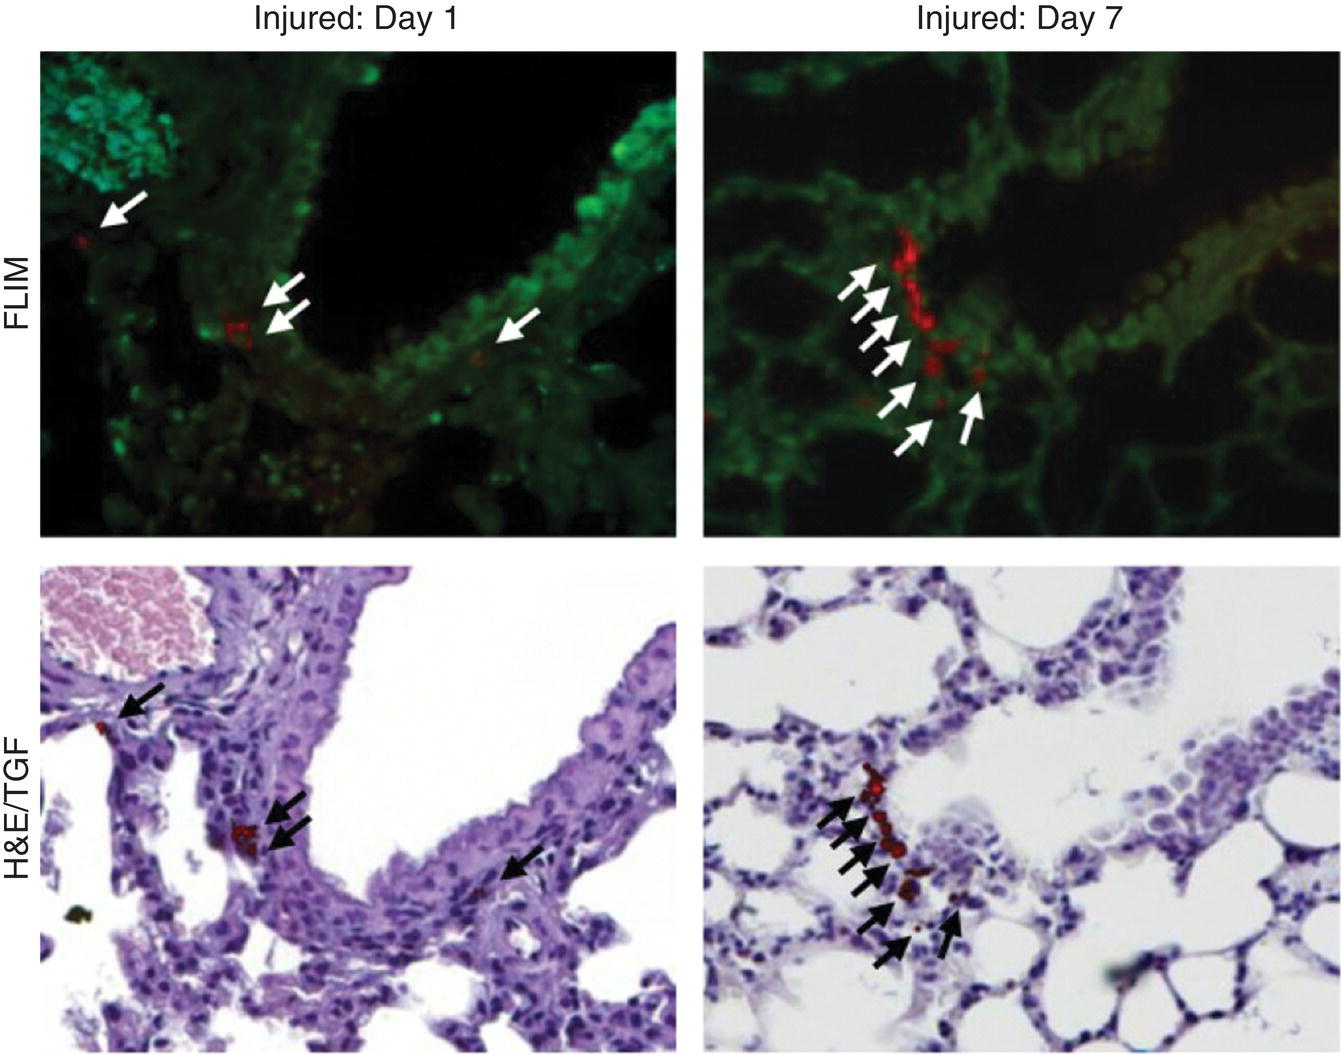
Figure 9.6 Tracking the engraftment and regenerative capability of transplanted lung stem cells using FNDs in a lung‐injured mouse model. Lung tissue sections were examined on day 1 and 7 after intravenous injection of the FND‐labeled lung stem cells. Arrows indicate the identified cells.
Source: Adapted with permission from Ref. [26]. Reproduced with permission of Nature Publishing Group.
Very recently, a new platform has been developed using 100‐nm FNDs for quantitative tracking of human placenta‐derived MSCs in miniature pigs. Su et al. [28] labeled the cells with HSA‐coated FNDs and determined with the MMF technique that each MSC could take up more than 60 000 FND particles without noticeable excretion. At this remarkable loading capacity, no detrimental effects of the particles on the human stem cells were found, granting FND safe to use. The use of pigs as the animal model is highly forward‐thinking because the animal shares many physiological similarities with humans and offer several distinct advantages (including size and availability) over other non‐human primates for preclinical experimentation. With the magnetic modulation to achieve background‐free detection, together with the TGF imaging as mentioned earlier, the research team was able to determine the numbers and the precise positions of the transplanted FND‐labeled cells in organs and tissues of the miniature pigs after intravenous administration. The same method is applicable to single‐cell imaging and quantitative tracking of human stem/progenitor cells in rodents, rabbits, monkeys, and other non‐human primate animal models as well [38].
9.3 Deep Tissue Imaging
9.3.1 Wide‐Field Fluorescence Imaging
Apart from playing the role as fluorescent labels for cells, FNDs can also be used as beacons to indicate the positions of tumors in patients. At present, the most commonly used imaging modalities in hospitals are magnetic resonance imaging, X‐ray computed tomography, and ultrasound. These modalities have resolution high enough to provide anatomically relevant details but are low in sensitivity and difficult to be operated along with surgical treatment. A number of model organisms, including mice [39–44], rats [39], and pigs [28], have been deployed to evaluate the potential use of FNDs for such real‐world biomedical applications. However, as discussed below, deep tissue imaging remains a challenge for FNDs in these animal models, clearly deserving further investigations.
Among the five different types of vacancy‐related defects (Table 3.2), the NV− center is most appealing for deep tissue imaging because it emits bright fluorescence in the far‐red range. Nearly 70% of the fluorescence lies in the near‐infrared (NIR) window from 650 to 1350 nm (Figure 9.7) [39], where light has the maximum penetration depth in biological tissue [45]. Another type of defect, GR1, is also a potential candidate because its emission band peaks at around 800 nm (Figure 3.5). While the fluorescence quantum efficiency of GR1 is low (only ~1%) [46], the deficiency can be compensated by increasing the vacancy density in the particles if necessary.

Figure 9.7 Comparison of the fluorescence spectrum (red curve) of FNDs with the near‐infrared window of biological tissues. The black and gray curves are the absorption spectra of H2O, oxygen‐bound hemoglobin (HbO2), and hemoglobin (Hb), respectively.
Source: Reprinted with permission from Ref. [39].
To assess the feasibility of deep tissue imaging with the NV− centers, we have recently employed fluorescent microdiamonds (FMDs) of 400 μm in diameter and chicken breast tissue of different thickness for testing. Specifically, we covered two FMD particles (separated by ~200 μm) with 0‐, 1.5‐, 3‐, or 5‐mm thick chicken breast tissue and then imaged the samples with both bright‐field and fluorescence microscopy. As shown in Figure 9.8a–d, the particles could be clearly seen under bright‐field imaging only when the chicken breast tissue was thinner than 1.5 mm. There was no problem of detecting the fluorescence emission of the NV− centers even when the chicken breast thickness increased to 5 mm (Figure 9.8e–h), showing the high sensitivity of this optical imaging method. However, although a spatial resolution of approximately 200 μm could be maintained at the tissue thickness of 3 mm, only a blurred light spot was found in the image taken for the 5‐mm tissue due to the severe light scattering effect. The poor resolution reflected the limitation of the direct optical methods for deep tissue imaging. The limitation, however, can be lifted by exploiting the magnetic properties of NV− as discussed in the next section.

Figure 9.8 (a–d) Bright‐field images of two FMD particles covered with chicken breast tissues with thickness of 0, 1.5, 3, and 5 mm, respectively. (e–h) Corresponding fluorescence images of FMDs in (a–d) illuminated by a continuous‐wave laser operating at 637 nm.
In an attempt to visualize FNDs in mice and rats, Vaijayanthimala et al. [39] used particles containing high‐density ensembles (~10 ppm) of NV− centers to investigate their imaging capability and long‐term stability in these model animals. The research team introduced 100‐nm FNDs into rats through both intraperitoneal injection (Figure 9.9a) and subcutaneous injection (Figure 9.9b), followed by tracking the particles with a standard in vivo fluorescence imaging system. In order to facilitate the detection of FNDs with minimal interference from the tissue’s background autofluorescence, the specimen was excited at 605 nm and its fluorescence was collected at 780 nm. Additionally, to improve the contrast, the primary images were corrected by subtracting the scaled background images taken by 430 nm excitation. It was found that the intensity of the FNDs in rats after subcutaneous injection stayed nearly the same for more than 37 days. Moreover, measurements of water consumption, fodder consumption, body weight, and organ index all showed no significant differences between the control and FND‐treated groups of the rats subjected to intraperitoneal injection over five months (with a dose of 5 mg kg−1 body weight per week). The studies suggest that FNDs may serve as an ideal long‐term marker for small animal models like mice and rats.
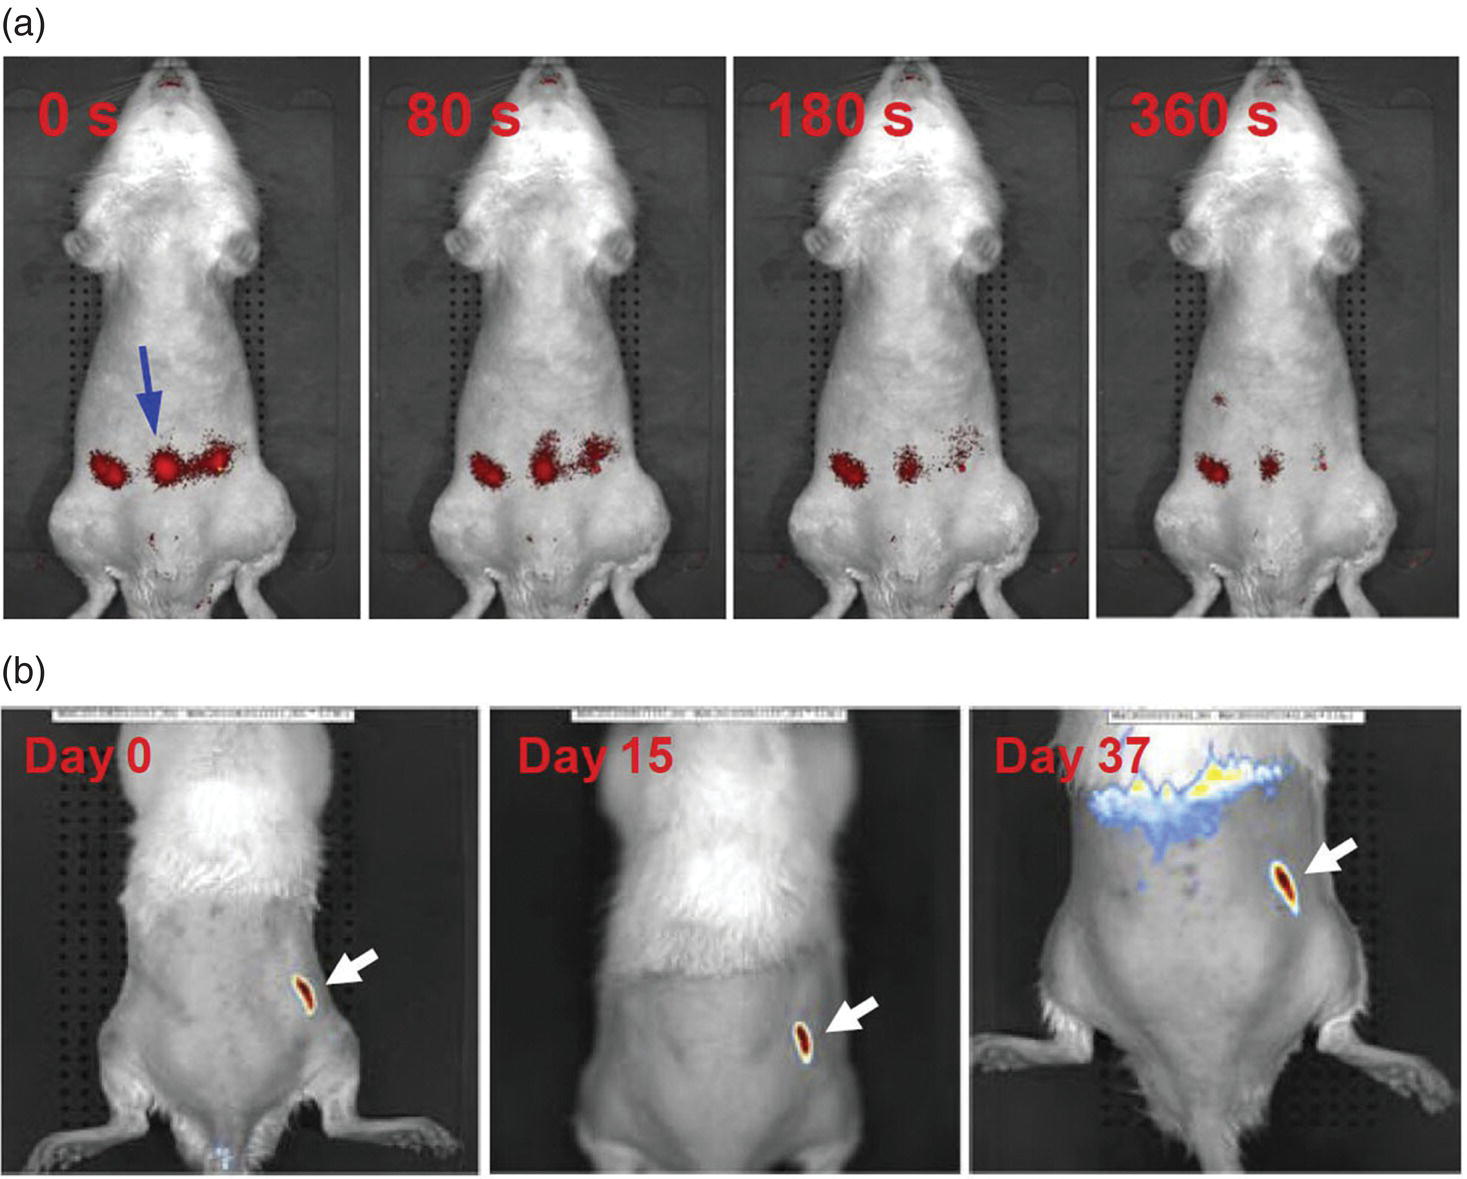
Figure 9.9 In vivo imaging of FNDs in rats after (a) intraperitoneal or (b) subcutaneous injection. The times indicated in both panels are the time points post‐injection. White and blue arrows indicate the sites of injection.
Source: Reprinted with permission from Ref. [39].
A more clinically relevant application of FNDs is the sentinel lymph node imaging. Sentinel lymph node is the hypothetical first lymph node (or group of nodes) draining a cancer, and thus its imaging is one of the most important and routine procedures in any cancer treatment [47]. In this study, FNDs were first administered into mice by intradermal injection and then monitored using a preclinical in vivo imaging system. Figure 9.10a and b show, respectively, the results of in vivo and ex vivo lymph node imaging of a nude mouse after intradermal injection with FNDs. Accumulation of the FND particles in the right axillary lymph node could be readily identified on day 8 after injection. The optical imaging, in combination with transmission electron microscopy, confirmed that the intradermally administered FNDs could be drained from the injection sites by macrophages and, in turn, selectively accumulated in the axillary lymph nodes of the treated mice.

Figure 9.10 In vivo and ex vivo lymph node imaging of a nude mouse after intradermal injection. (a) Image showing the accumulation of BSA‐FND particles in the right axillary lymph node (indicated by the blue arrow) on day 8. Note that most of the injected BSA‐FND particles remain at the injection site. (b) Ex vivo fluorescence image of four extracted lymph nodes, where ALN1 and ALN2 are the lymph nodes located at the right and left axilla, respectively, and BLN1 and BLN2 are the lymph nodes located at the right and left brachial region, respectively.
Source: Reprinted with permission from Ref. [39].
Research along this line has also applied FNDs as a fluorescent tag to assess the disposition of aluminum oxyhydroxide (alum) in vivo [43]. Alum, with the chemical formula AlO(OH), is a crystalline compound widely used as an immunologic adjuvant of vaccines. Although millions of people have received alum‐adjuvanted vaccines to date [48], the long‐term fate, residence time, accumulation, and impact of the particles in the human body are still not well understood. Alum particles are neither fluorescent nor magnetic, thereby requiring tagging with highly stable fluorophores in order to be tracked over a long period of time. Eidi et al. [43] conjugated hyperbranched polyglycerol with FNDs (~80 nm in diameter) to allow noncovalent coupling with the alum particles (~3 μm in diameter). The conjugates showed specificities comparable to those of the whole reference vaccine (anti‐hepatitis B vaccine) in terms of particle sizes and zeta potentials (Section 4.1). Following the injection of the alum‐FND conjugates in the tibialis muscle of mice for 21 days, the researchers sacrificed the animals and were able to find these conjugates in the sections of muscle, draining lymph nodes, spleen, liver, and brain tissue by wide‐field fluorescence imaging. The detection of FNDs was easy to implement, allowing detailed assessment for the biodistribution of the adjuvants in tissues and organs down to the subcellular level.
9.3.2 Optically Detected Magnetic Resonance Imaging
Aiming at developing optically detected magnetic resonance (ODMR) into an in vivo imaging technique, Hegyi and Yablonovitch [49, 50] have set up a functional prototype instrument for high‐resolution imaging of FNDs in tissue. The technique exploits the unique magneto‐optic properties of FNDs, as elaborated in Section 3.4. It detects the fluorescence signals at the magnetic field‐free point, where the crystal field splitting of NV− is in resonance with the external 2.87‐GHz microwave radiation (Figure 3.9). In the presence of an amplitude‐modified microwave field, a change of the fluorescence intensity (measured via a lock‐in amplifier) proportional to the FND concentration results only at the field‐free region. Sweeping the field‐free point across the FND‐containing tissue (or a living organism), one can obtain a quantitative “map” of the FND concentration by recording the change in fluorescence intensity as a function of position. The feasibility of this method was demonstrated by the researchers with multiple FND phantoms within chicken breast (Figure 9.11a and b), where the fluorescence of the NV− centers was selectively detected for samples located at the magnetic‐field‐free region, achieving a sensitivity equivalent to 740 pg of FNDs in a 100‐s measurement time and a spatial resolution of 800 μm over a 1‐cm2 field of view (Figure 9.11c). More significantly, a spatial resolution in the range of 100 μm was achievable even when the FND samples were situated about 12 mm below the chicken breast after deconvolution of images by point‐spread functions. Such a resolution represents a remarkable advancement in all‐optical deep tissue imaging.
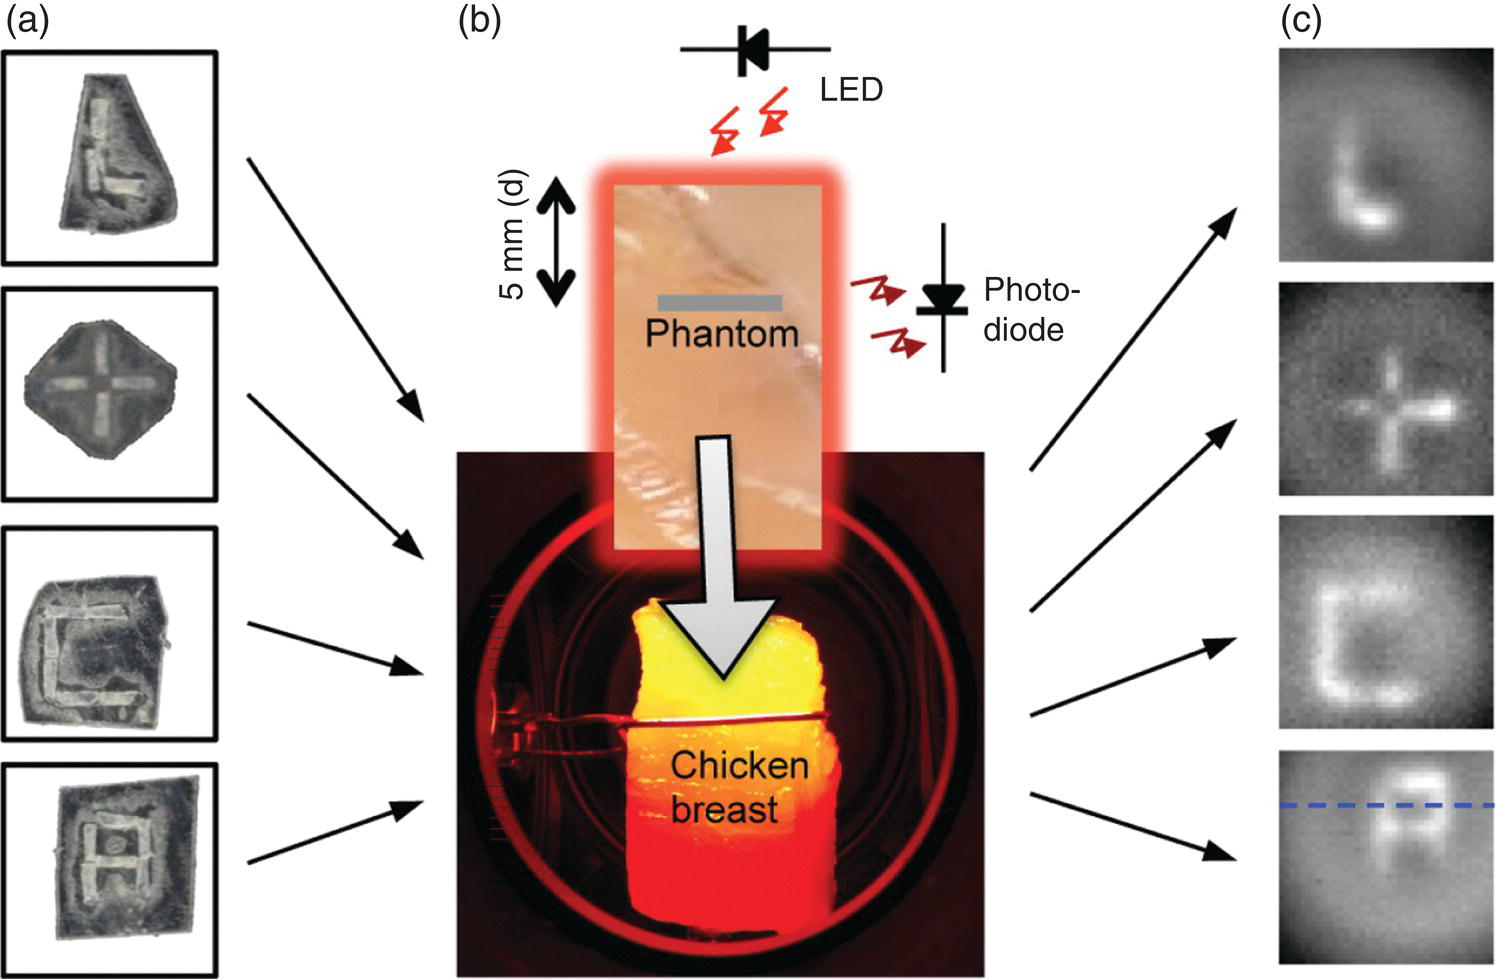
Figure 9.11 NV‐based deep tissue imaging. (a) FND phantoms made of double‐sticky tape and FNDs. (b) Chicken breast illuminated by a LED. The gray stripe on the piece of chicken breast represents the edge of the phantom, which is placed inside the chicken breast, 5 mm back from the front surface, facing the LED operating at 621 nm. Fluorescence is collected off to the side. (c) FND phantoms imaged outside of the chicken breast.
Source: Reprinted with permission from Ref. [49]. Reproduced with permission of American Chemical Society.
The ODMR technique has similarly been applied to improve the image contrast of FNDs injected into the mouse model. In this protocol as detailed in Section 7.2.3, wide‐field fluorescence images were first acquired either with or without 2.87‐GHz microwave irradiation. Subtraction between the signals in these two images at every pixel led to selective detection of FNDs. With this technique, Igarashi et al. [40] successfully removed the background fluorescence signals from the images and achieved a high image contrast for long‐term tracking of FND aggregates in the flank of a nude mouse at a depth of 400–500 μm. The protocol is applicable to an array of living systems, from single cells to whole organisms.
9.3.3 Time‐Gated Fluorescence Imaging
The concept of single particle tracking introduced in Section 7.2 can be readily adapted to tracking single cells in vivo. Hui et al. [41] reported a new approach to achieve background‐free fluorescence imaging of single FND‐labeled cells in a mouse model by using an intensified charge‐coupled device (ICCD) as the detector. ICCD is a highly sensitive camera capable of high‐speed gating operations for wide‐field imaging. The gating helps enhance the image contrast by suppressing the background fluorescence signals with shorter lifetimes than that of FNDs. Employing a nanosecond ICCD and a Raman shifter, the team demonstrated the first application of the device for wide‐field fluorescence imaging of FND‐labeled cells in mice. They used mouse lung cancer cells as the model cell line and introduced the cells labeled with 100‐nm FNDs into mice via tail vein injection. TGF imaging was then conducted to establish a quiet background for the cells in the main blood vessel of the mouse’s ear. Shown in Figure 9.12a is a typical bright‐field and time‐gated fluorescence image of the ear tissue. About 10 minutes after intravenous injection of the cells into the mouse, bright objects moving at an average speed of 0.4 μm s−1 could be clearly identified in the vessel (Figure 9.12b and c). The speed was lower than the blood flow velocity by almost three orders of magnitude, suggesting that the motion was most likely associated with the rolling, instead of coaxial flowing, of the FND‐labeled cells in the blood vessel. This time‐gating technique is promising for wide‐field imaging and tracking of transplanted stem cells in small animal models for real‐time observations of tissue repair and regeneration.
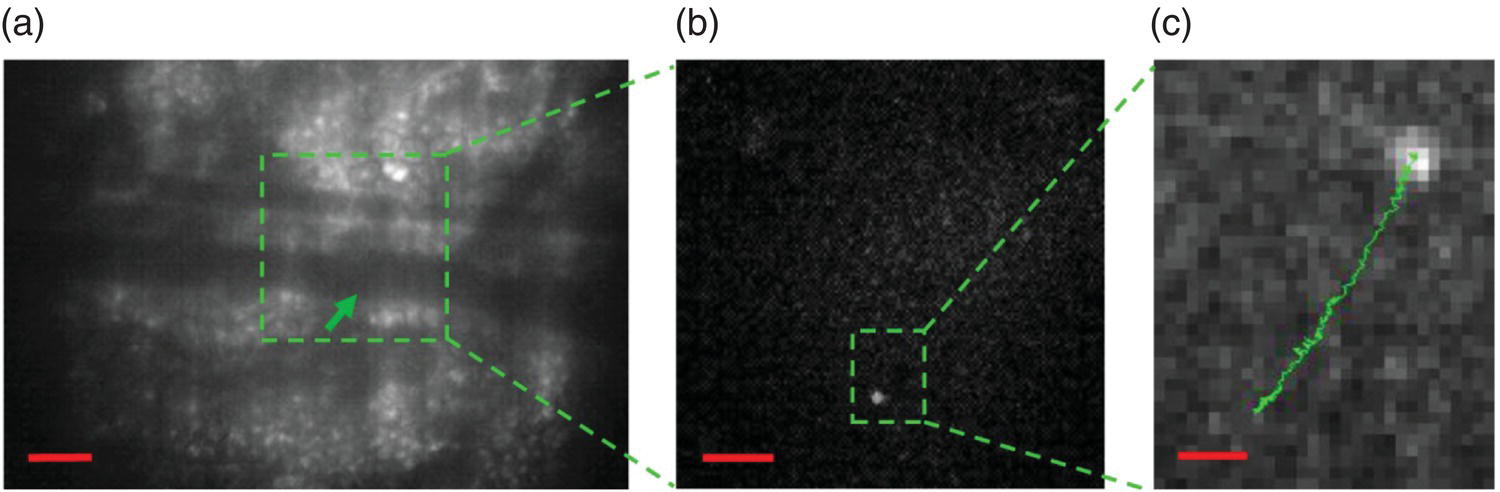
Figure 9.12 Tracking of single FND‐labeled cells in a mouse ear. (a) Bright‐field image of a mouse ear tissue. The green arrow indicates the position of an FND‐labeled mouse lung cancer cell in the blood vessel of approximately 50 μm in diameter. (b) Enlarged view of the fluorescence image of the square green region in (a). The bright spot corresponds to the FND‐labeled cell. (c) Enlarged view of the fluorescence image of the rectangular green region in (b), showing the trajectory of the FND‐labeled lung cancer cell moving in the vessel. Scale bars: 100 nm in (a), 50 nm in (b), and 10 μm in (c).
Source: Reprinted with permission from Ref. [41]. Reproduced with permission of Nature Publishing Group.
9.3.4 Magnetically Modulated Fluorescence Imaging
The latest advance in the field is led by the development of a wide‐field background‐free imaging technique based on magnetic modulation of the FND fluorescence as discussed in Section 6.2.4. Sarkar et al. [42] developed two methods to achieve this goal. The first method relied on pairwise subtraction of the images with and without a magnetic field, while the second was a phase‐sensitive lock‐in detection of the intensity‐modulated FND emission. They reported an improvement in the signal‐to‐noise ratio of up to 100‐fold by conducting sentinel lymph mode mapping in a mouse model. These simple and relatively straightforward approaches to achieve background‐free imaging of FNDs can be readily incorporated into existing microscopes or animal imaging systems. The technique has great potential to significantly improve and extend the FND‐based imaging capabilities in diverse platforms, suitable for clinical applications. Compared with optically modulated fluorescence (Section 6.2.4), this approach is more attractive for whole animal imaging because of the efficient penetration of magnetic fields through tissues. The development of this and more background‐free imaging modalities paves the way for the use of NV‐containing diamond particles as biocompatible fiducial markers for image‐guided therapy based on optical means [51].
References
- 1 American Society of Gene and Cell Therapy (2000). Gene therapy and cell therapy defined. http://www.asgct.org/general‐public/educational‐resources/gene‐therapy‐‐and‐cell‐therapy‐defined (accessed 16 April 2018).
- 2 Trounson, A. and McDonald, C. (2015). Stem cell therapies in clinical trials: progress and challenges. Cell Stem Cell 17: 11–22.
- 3 Lefrère, J.J. and Berche, P. (2010). Doctor Brown‐Sequard’s therapy. Ann Endocrinol (Paris) 71: 69–75.
- 4 Sensebé, L. and Fleury‐Cappellesso, S. (2013). Biodistribution of mesenchymal stem/stromal cells in a preclinical setting. Stem Cells Int 2013: 678063.
- 5 Zhang, L., Gu, F.X., Chan, J.M. et al. (2008). Nanoparticles in medicine: therapeutic applications and developments. Clin Pharmacol Ther 83: 761–769.
- 6 Medintz, I.L., Uyeda, H.T., Goldman, E.R., and Mattoussi, H. (2005). Quantum dot bioconjugates for imaging, labelling and sensing. Nat Mater 4: 435–446.
- 7 Tsoi, K.M., Dai, Q., Alman, B.A., and Chan, W.C. (2013). Are quantum dots toxic? Exploring the discrepancy between cell culture and animal studies. Acc Chem Res 46: 662–671.
- 8 Vaijayanthimala, V. and Chang, H.C. (2009). Functionalized fluorescent nanodiamonds for biomedical applications. Nanomedicine 4: 47–55.
- 9 Xing, Y. and Dai, L. (2009). Nanodiamonds for nanomedicine. Nanomedicine 4: 207–218.
- 10 Perevedentseva, E., Lin, Y.C., Jani, M., and Cheng, C.L. (2013). Biomedical applications of nanodiamonds in imaging and therapy. Nanomedicine 8: 2041–2060.
- 11 Kaur, R. and Badea, I. (2013). Nanodiamonds as novel nanomaterials for biomedical applications: drug delivery and imaging systems. Int J Nanomedicine 8: 203–220.
- 12 Doherty, G.J. and McMahon, H.T. (2009). Mechanisms of endocytosis. Annu Rev Biochem 78: 857–902.
- 13 Maxfield, F.R. and McGraw, T.E. (2004). Endocytic recycling. Nat Rev Mol Cell Biol 5: 121–132.
- 14 Vaijayanthimala, V., Tzeng, Y.K., Chang, H.C., and Li, C.L. (2009). The biocompatibility of fluorescent nanodiamonds and their mechanism of cellular uptake. Nanotechnology 20: 425103.
- 15 Faklaris, O., Garrot, D., Joshi, V. et al. (2008). Detection of single photoluminescent diamond nanoparticles in cells and study of the internalization pathway. Small 4: 2236–2239.
- 16 Faklaris, O., Joshi, V., Irinopoulou, T. et al. (2009). Photoluminescent diamond nanoparticles for cell labeling: study of the uptake mechanism in mammalian cells. ACS Nano 3: 3955–3962.
- 17 Zhang, B.L., Li, Y.Q., Fang, C.Y. et al. (2009). Receptor‐mediated cellular uptake of folate‐conjugated fluorescent nanodiamonds: a combined ensemble and single‐particle study. Small 5: 2716–2721.
- 18 Perevedentseva, E., Hong, S.F., Huang, K.J. et al. (2013). Nanodiamond internalization in cells and the cell uptake mechanism. J Nanopart Res 15: 1384.
- 19 Chu, Z., Miu, K., Lung, P. et al. (2015). Rapid endosomal escape of prickly nanodiamonds: implications for gene delivery. Sci Rep 5: 11661.
- 20 Ivanov, A.I. (2008). Pharmacological inhibition of endocytic pathways: is it specific enough to be useful? Methods Mol Biol 440: 15–33.
- 21 Brenner, S.L. and Korn, E.D. (1979). Substoichiometric concentrations of cytochalasin D inhibit actin polymerization. Additional evidence for an F‐actin treadmill. J Biol Chem 254: 9982–9985.
- 22 Samson, F., Donoso, J.A., Heller‐Bettinger, I. et al. (1979). Nocodazole action on tubulin assembly, axonal ultrastructure and fast axoplasmic transport. J Pharmacol Exp Ther 208: 411–417.
- 23 Alberts, B., Johnson, A., Lewis, J. et al. (2014). Molecular Biology of the Cell, 6e. Garland Science.
- 24 Chu, Z., Zhang, S., Zhang, B. et al. (2014). Unambiguous observation of shape effects on cellular fate of nanoparticles. Sci Rep 4: 4495.
- 25 Fang, C.Y., Vaijayanthimala, V., Cheng, C.A. et al. (2011). The exocytosis of fluorescent nanodiamond and its use as a long‐term cell tracker. Small 7: 3363–3370.
- 26 Wu, T.J., Tzeng, Y.K., Chang, W.W. et al. (2013). Tracking the engraftment and regenerative capabilities of transplanted lung stem cells using fluorescent nanodiamonds. Nat Nanotechnol 8: 682–689.
- 27 Huang, Y.A., Kao, C.W., Liu, K.K. et al. (2014). The effect of fluorescent nanodiamonds on neuronal survival and morphogenesis. Sci Rep 4: 6919.
- 28 Su, L.J., Wu, M.H., Hui, Y.Y. et al. (2017). Fluorescent nanodiamonds enable quantitative tracking of human mesenchymal stem cells in miniature pigs. Sci Rep 7: 45607.
- 29 Liu, K.K., Qiu, W.R., Raj, E.N. et al. (2017). Ubiquitin‐coated nanodiamonds bind to autophagy receptors for entry into the selective autophagy pathway. Autophagy 13: 187–200.
- 30 Mizushima, N. and Komatsu, M. (2011). Autophagy: renovation of cells and tissues. Cell 147: 728–741.
- 31 Svenning, S. and Johansen, T. (2013). Selective autophagy. Essays Biochem 55: 79–92.
- 32 Yuan, Y., Chen, Y.W., Liu, J.H. et al. (2009). Biodistribution and fate of nanodiamonds in vivo. Diam Relat Mater 18: 95–100.
- 33 Doudrick, K., Corson, N., Oberdörster, G. et al. (2013). Extraction and quantification of carbon nanotubes in biological matrices with application to rat lung tissue. ACS Nano 7: 8849–8856.
- 34 Freshney, R.I. (2006). Basic principles of cell culture. In: Culture of Cells for Tissue Engineering (ed. G. Vunjak‐Novakovic and R.I. Freshney), 1–22. New York: Wiley.
- 35 Dean, M., Fojo, T., and Bates, S. (2005). Tumour stem cells and drug resistance. Nat Rev Cancer 5: 275–284.
- 36 Lin, H.H., Lee, H.W., Lin, R.J. et al. (2015). Tracking and finding slow‐proliferating/quiescent cancer stem cells with fluorescent nanodiamonds. Small 11: 4394–4402.
- 37 Frangioni, J.V. and Hajjar, R.J. (2004). In vivo tracking of stem cells for clinical trials in cardiovascular disease. Circulation 110: 3378–3383.
- 38 Moore, L., Yang, J., Lan, T.T. et al. (2016). Biocompatibility assessment of detonation nanodiamond in non‐human primates and rats using histological, hematologic, and urine analysis. ACS Nano 10: 7385–7400.
- 39 Vaijayanthimala, V., Cheng, P.Y., Yeh, S.H. et al. (2012). The long‐term stability and biocompatibility of fluorescent nanodiamond as an in vivo contrast agent. Biomaterials 33: 7794–7802.
- 40 Igarashi, R., Yoshinari, Y., Yokota, H. et al. (2012). Real‐time background‐free selective imaging of fluorescent nanodiamonds in vivo. Nano Lett 12: 5726–5732.
- 41 Hui, Y.Y., Su, L.J., Chen, O.Y. et al. (2014). Wide‐field imaging and flow cytometric analysis of cancer cells in blood by fluorescent nanodiamond labeling and time gating. Sci Rep 4: 5574.
- 42 Sarkar, S.K., Bumb, A., Wu, X. et al. (2014). Wide‐field in vivo background free imaging by selective magnetic modulation of nanodiamond fluorescence. Biomed Opt Express 5: 1190–1202.
- 43 Eidi, H., David, M., Crépeaux, G. et al. (2015). Fluorescent nanodiamonds as a relevant tag for the assessment of alum adjuvant particle biodisposition. BMC Med 13: 144.
- 44 Suarez‐Kelly, L.P., Campbell, A.R., Rampersaud, I.V. et al. (2017). Fluorescent nanodiamonds engage innate immune effector cells: a potential vehicle for targeted anti‐tumor immunotherapy. Nanomedicine 13: 909–920.
- 45 Weissleder, R. and Ntziachristos, V. (2003). Shedding light onto live molecular targets. Nat Med 9: 123–128.
- 46 Davies, G., Thomaz, M.F., Nazare, M.H. et al. (1987). The radiative decay time of luminescence from the vacancy in diamond. J Phys C Solid State Phys 20: L13–L17.
- 47 Jakub, J.W., Pendas, S., and Reintgen, D.S. (2003). Current status of sentinel lymph node mapping and biopsy: facts and controversies. Oncologist 8: 59–68.
- 48 Moxon, E.R. and Siegrist, C.A. (2011). The next decade of vaccines: societal and scientific challenges. Lancet 378: 348–359.
- 49 Hegyi, A. and Yablonovitch, E. (2013). Molecular imaging by optically detected electron spin resonance of nitrogen‐vacancies in nanodiamonds. Nano Lett 13: 1173–1178.
- 50 Hegyi, A. and Yablonovitch, E. (2014). Nanodiamond molecular imaging with enhanced contrast and expanded field of view. J Biomed Opt 19: 011015.
- 51 Chen, G.T., Sharp, G.C., and Mori, S. (2009). A review of image‐guided radiotherapy. Radiol Phys Technol 2: 1–12.