3
Color Centers in Diamond
In this chapter, we will discuss the key features of nanodiamonds that are relevant to the development of fluorescent nanodiamonds (FNDs) and their many uses in biotechnology and beyond. Up till now, we have surveyed nanotechnology in previous chapters starting with its historical development and focusing, in particular, on the nanocarbon materials. With a general introduction to nanodiamonds (Chapter 2), we have learned some methods commonly used to prepare man‐made diamonds and the fundamental properties shared by all diamonds and nanodiamonds alike. In this and the following two chapters, we are about to find out that nanodiamonds can glow (Chapter 3), support (Chapter 4), and is safe to use (Chapter 5). These unique features have made nanodiamonds a superior material for a fast‐growing list of applications at present time and in the coming future.
First comes an optical property that puts a touch of color on diamond. After all, who can turn away from the speckles of a diamond with an irresistible color destined to capture our hearts? It is only fitting to start with color centers in diamond.
Color centers are crystal defects that absorb light in a spectral region where the crystal itself has no absorption [1]. The term “color center” is derived from the German word Farbenzentren, which was first discovered in alkali halide crystals by Pohl and coworkers in the 1930s [2]. It has later been confirmed both experimentally and theoretically that the Farbenzentren (or F‐center) is a crystalline vacancy with captured unpaired electron(s) that absorbs light in the visible region, thus giving various colors to the crystals. Similar to the F‐centers in alkali halides, color centers can be found in diamond as well [3], although their formation occurs under far more extreme conditions due to the chemical inertness and mechanical rigidity of the material (Chapter 2). This chapter begins with an introduction to the optical properties of diamond, followed by a brief review of the history of diamond coloration by radiation damage and a comprehensive discussion of some important spectral characteristics of vacancy‐related color centers.
3.1 Nitrogen Impurities
As discussed in the previous chapter, a pure diamond is optically transparent with its transmittance extending from 225 to 2000 nm (Figure 2.2). The diamond crystal shows only infrared (IR) absorption bands at 2–7 μm resulting from two‐ and three‐phonon excitation processes [4]. The absence of one‐phonon absorption is due to the high symmetry of diamond’s crystal structure, of which C–C vibrations are IR‐inactive. Such vibrational modes, alternatively, appear as a sharp Raman scattering peak at 1332 cm−1 (or 7.508 μm), serving as a fingerprint for easy identification of diamond from other carbon‐based materials [5]. Therefore, for any colored diamond, its optical absorption and emission must be contributed by impurities and structural defects in the crystal matrix.
Nitrogen is the major impurity in diamond [6]. The nitrogen concentration of diamond is typically measured by inert gas fusion analysis [7], which involves fusing the sample material in a graphite crucible at high temperatures and then determining the amount of the nitrogen gas released by a mass spectrometer. Quantitative as is, the method is destructive. IR absorption spectroscopy, on the other hand, is nondestructive and it has been applied as a tool to characterize the nitrogen concentrations [8]. Figure 3.1a presents a typical IR spectrum of type Ib bulk diamond, obtained by direct absorption methods [9]. Two prominent features are observed at 1130 and 1344 cm−1 and they are attributed to the localized vibrational modes of C─N bonds [10, 11]. Studies have established the correlations between the absorption coefficients (μ in units of cm−1) of these two bands and the concentration ([N0] in units of ppm) of neutral nitrogen atoms dispersed in diamond, giving [10–12]
Figure 3.1 (a) IR absorption spectrum of a synthetic diamond crystal with [N0] = 109 ppm. The ratio of the height of the hump at 1130 cm−1 versus the depth of the dip at 2120 cm−1 was measured to determine the nitrogen concentration. (b) IR absorption spectrum of a natural diamond crystal with a nitrogen concentration of [NA] = 900 ppm. The ratio of the height of the peak at 1282 cm−1 versus the depth of the dip at 2120 cm−1 was measured to determine the nitrogen concentration.
Source: Adapted with permission from Refs. [9, 13]. (a) Reproduced with permission of American Chemical Society and (b) Reproduced with permission of Elsevier.
Similarly, for type Ia bulk diamond, a prominent feature is found at 1282 cm−1 (Figure 3.1b) [13], which is related to the localized vibrational modes of the –N–C–N– moieties in the N aggregates, NA, whose concentrations can be estimated as [14]
In both cases, the absorption coefficient is defined as
where A is the measured absorbance at the specified wavenumber and L is the sample thickness (in cm).
Though useful in quantifying [N0] and [NA] in bulk diamonds, Eqs. (3.1) and (3.2) are not suited for diamond powders because the sample thickness L (and, thus, absorption coefficient μ) is ill‐defined. A way to circumvent this problem is to use the two‐photon absorption band of diamond at approximately 5 μm as the internal standard (Figure 3.1) [15]. The absorption band shows a characteristic dip at 2120 cm−1 and the depth of this dip is directly proportional to the effective sample thickness. Su et al. [16] have reported that the [N0] in type Ib diamond powders can be estimated by
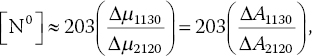
where Δμ1130 is the absorption coefficient difference corresponding to the height of the hump at 1130 cm−1 (the “mountain”) and Δμ2120 is the absorption coefficient difference between the linear line drawn across the two peaks at 2033 and 2160 cm−1 and the dip at 2120 cm−1 (the “valley”) (Figure 3.1). Hence, Δμ1130/Δμ2120 is the mountain/valley ratio. Similarly, for type Ia diamond, one has
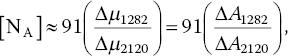
where Δμ1282 is the absorption coefficient difference corresponding to the height of the peak at 1282 cm−1.
The major advantage of using these modified equations is that the measured [N0] or [NA] is independent of the sample thickness since it involves only relative absorbance in the calculations. Additionally, as a ratio, the result is virtually free of any baseline shift typical of every spectrum obtained experimentally. The method is readily applicable for diamond crystallites measured by diffuse reflectance infrared Fourier transform spectroscopy (DRIFTS) [17], a technique widely used to determine IR photons scattered from fine particles [18]. For instance, with DRIFTS, the nitrogen content of submillimeter diamond crystallites prepared under high‐pressure and high‐temperature conditions was successfully measured to be [N0] = 100–300 ppm [16], classified as type Ib diamonds. The method also confirmed that increasing the nitrogen content to more than 600 ppm could be achieved by doping the solvent catalyst with inorganic nitrogen‐containing substances in high concentrations [19].
3.2 Crystal Defects
Crystal defects are the second source responsible for diamond color. The discovery of diamond coloration through radiation damage can be traced back to the turn of the twentieth century. In 1896, French scientist Henri Becquerel accidentally discovered radioactivity while performing phosphorescence experiments with uranium salts. Inspired by this finding as well as the discovery of X‐ray by Wilhelm Röntgen in 1895, Marie and Pierre Curie continued the studies for different uranium minerals and eventually discovered two new elements, polonium (Po, Z = 84) and radium (Ra, Z = 88) in 1898. Becquerel and the Curies shared the Nobel Prize in 1903 for their work in discovering spontaneous radioactivity and the new radiation phenomena [20]. A year later, in a paper presented to the Royal Society of London, the English scientist William Crookes reported that the exposure of diamonds to radiation generated by radium bromide for several months could give the gem a bluish green to green color. The discovery, also by serendipity, had caused considerable interest and excitement in the gemological community because the color alternations were permanent, unlike painting or coating on the gems in the early days for added market value [21].
So, what has caused diamond to change color?
Radium bromide used by Crookes contains radium, which is a highly radioactive element. It is now known that all isotopes of radium are radioactive and the most stable isotope is Ra‐226 with a half‐lifetime of 1600 years [22]. The isotope slowly decays to radon, which is a stable inert gas, emitting alpha particles along with the process. Research studies by physicists during the time period between 1910 and 1940 had concluded that the color change of diamond was mainly due to the alpha radiation from radium. The color appeared to be confined to a shallow layer on the diamond’s surface. More studies of the effect found that the green or blue‐green color could be changed further to various shades of color ranging from yellow to brown by thermal annealing. It was this permanent color enhancement through irradiation combined with high‐pressure high‐temperature annealing that opened the modern era of diamond treatment. An excellent review on the historical accounts of diamond treatments has been given by Overton and Shigley [21].
Alpha particles are not the only type of radiation useful for treating diamonds. Exposure to high‐energy sources such as electrons, neutrons, protons, helium ions, or gamma rays can also change the diamond color in a similar fashion [23]. It is well understood now that the color change is due to structural damages that occur when the radiation passes through the diamond crystalline. Specifically, the penetrating particles collide with the diamond lattice, knocking off the carbon atoms from their originally occupied positions to create vacant sites in the lattice matrix. Since the vacancies can exist in both neutral and negatively charged states, they give rise to a broad range of absorption in the visible and near‐infrared regions of the spectrum, yielding a blue‐to‐green color (Figure 3.2). Subsequent heating of the irradiated diamonds above 500 °C in an inert atmosphere changes the blue green color to yellow, brownish, or other hues [21]. More details are discussed later in this chapter.

Figure 3.2 An irradiation‐treated green diamond.
Source: Reprinted with permission from Ref. [21]. Reproduced with permission of Springer.
3.3 Vacancy‐Related Color Centers
3.3.1 GR1 and ND1
Systematic investigations of radiation damage in natural and synthetic diamonds were first carried out in the 1950s [24, 25]. Since then, a wealth of information has been collected through optical spectroscopy and electron paramagnetic resonance studies for the color centers [3, 26]. Nearly all radiation‐damaged diamonds show an absorption band associated with the neutral vacancy defect (cf., Figure 3.3a for the molecular structure [27]), designated as V0, in their ultraviolet‐visible (UV‐Vis) spectra [28]. The neutral vacancy, known as the GR1 center where GR stands for “general radiation” (Table 3.1), is one of the best characterized optical defects in diamond [8]. It has a Td point symmetry and exhibits a narrow zero‐phonon line (ZPL) at 741 nm (or 1.673 eV) accompanied by a broad phonon sideband of a maximum around 620 nm in the UV‐Vis absorption spectrum (Figure 3.4a and b). When exposed to orange‐red light, the center emits near‐infrared photoluminescence at approximately 800 nm (Figure 3.5) [29] with a quantum yield of only 1.4% at low temperature (Table 3.2) [30]. Although GR1 is not a good chromophore for fluorescence imaging because of such a low quantum yield, it can be produced with a high number density (>100 ppm) by extensive irradiation without the need of thermal annealing. Davies [8] has provided a calibration constant that correlates the concentration ([V0] in cm−3) of the neutral vacancy and the integrated absorption coefficient (AGR1 in cm−1) of its ZPL at 80 K to be (Table 3.3):

Figure 3.3 Structures of vacancy‐related color centers in diamond: (a) V0, (b) NV, (c) H3, and (d) N3. The carbon atoms, nitrogen atoms, and vacancies are denoted by black spheres, dark red spheres, and blue dashed circles, respectively.
Source: Reprinted with permission from Ref. [27]. Reproduced with permission of John Wiley & Sons.
Table 3.1 Nomenclature for zero‐phonon lines of color centers in diamond.
Source: From Ref. [26].
| Letter | Significance | Range |
| GR | General radiation (induced in all diamonds by irradiation) | GR1 (1.67 eV) to GR8 (3.00 eV) |
| H | Heat treatment (preceded by irradiation) | H1 (0.18 eV) to H18 (3.56 eV) |
| N | Natural diamond | N1 (1.50 eV) to N9 (5.26 eV) |
Figure 3.4 UV‐Vis absorption spectra of natural and synthetic diamonds after irradiation at room temperature with 2‐MeV electrons: (a) type Ia, (b) type IIa, (c) type Ib with additional annealing, and (d) type Ia with additional annealing. All the spectra were recorded at liquid‐nitrogen temperature.
Source: Reprinted with permission from Ref. [28]. Reproduced with permission of American Physical Society.
Figure 3.5 Luminescence spectra of NV0, NV−, and V0 in diamond at 77 K. The characteristic ZPLs are located at 575, 637, and 741 nm, respectively.
Source: Reprinted with permission from Ref. [73]. Reproduced with permission of John Wiley & Sons.
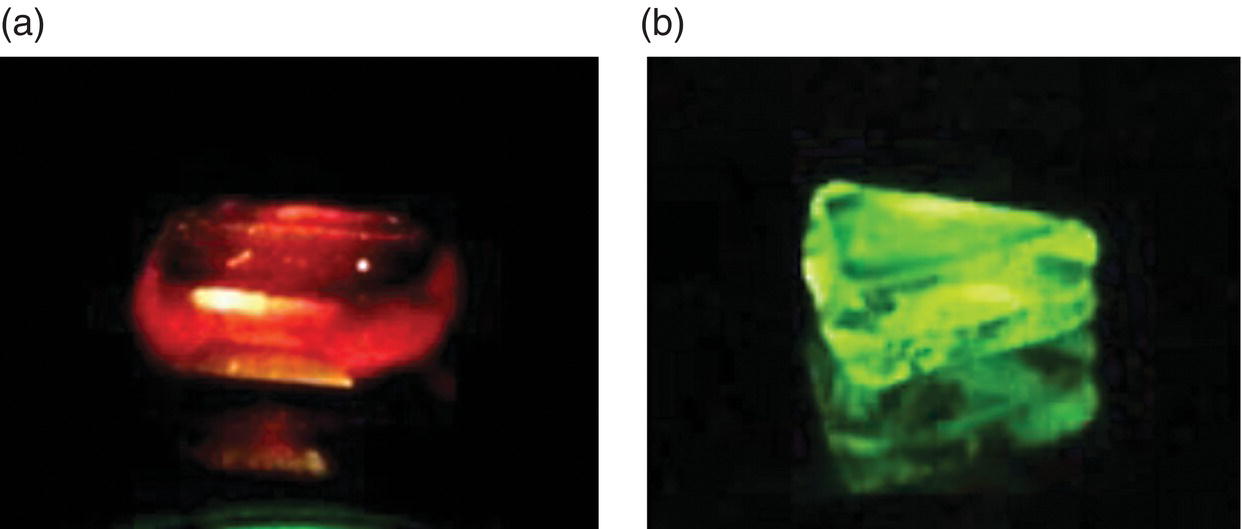
Figure 3.6 Photographs of fluorescent diamonds containing high‐density ensembles of (a) NV and (b) H3 centers excited by green and blue light, respectively.
Source: Adapted with permission from Refs. [9, 13]. (a) Reproduced with permission of American Chemical Society and (b) Reproduced with permission of Elsevier.
Table 3.2 Spectroscopic properties of vacancy‐related color centers in bulk diamonds.a
| Center | Point group | ZPL (nm) | τ (ns) | QE (%) | References |
| V0 (GR1) | T d | 741 | 2.55 | 1.4 | [29, 30] |
| V− (ND1) | T d | 394 | — | — | [24] |
| NV− | C 3v | 637 | 11.6 | 99 | [33, 34, 57] |
| NV0 | C 3v | 575 | 19 | — | [32, 35] |
| N–V–N (H3) | C 2v | 503 | 16 | 95 | [43, 44] |
| N3+V (N3) | C 3v | 415 | 41 | 29 | [44, 46] |
| SiV− | D 3d | 738 | 1.28 | — | [48, 49] |
aListed are zero‐phonon line (ZPL), emission lifetime (τ), and quantum efficiency (QE) at low temperatures.
Table 3.3 Calibrations of the optical absorption in zero‐phonon lines of some vacancy‐related color centers in bulk diamonds.
Source: From Ref. [8]. Reproduced with permission of Elsevier.
| Line | Calibration |
| 1 | A GR1 = (1.2 ± 0.3) × 10−16 [V0] |
| 2 | A ND1 = (4.8 ± 0.2) × 10−16 [V−] |
| 3 | A NV− = (1.4 ± 0.35) × 10−16 [NV−] |
| 4 | A H3 = (1.0 ± 0.35) × 10−16 [H3] |
| 5 | A N3 = (8.6 ± 2) × 10−17 [N3] |
Aside from V0, the vacancy defect can also exist in the negatively charged form, designated as V− or ND1 [24]. The V− center shows a sharp ZPL at 3.149 eV (394 nm), which appears only when a substantial amount of nitrogen is present in the diamond lattice. In type Ia diamonds, the ND1 center has a peak intensity comparable to that of GR1 but can barely be detectable in type IIa diamonds (Figure 3.4a and b). There is no distinct photoluminescence band associated with ND1. It has been reported that intense UV illumination of the ND1 band results in a reduction of its absorption strength but concurrently increases the GR1 band intensity [31], presumably due to the release of the trapped electrons from the vacancies. However, heating of the samples in the dark can reverse these changes, suggesting the occurrence of some interesting ionization‐recombination processes. More about this process is given later.
3.3.2 NV0 and NV−
Vacancies in diamond once produced by radiation damage are static at room temperature. They start to migrate when the irradiated diamond is heated above 500 °C. The activation energy barrier is 2.3 eV (or 53 kcal mol−1) [28]. For type Ib diamond containing atomic nitrogen, while some of the vacancies are annihilated at the surface, the majority of them can form stable complexes (i.e. the nitrogen‐vacancy (NV) centers) with nitrogen atoms in the diamond matrix. Figure 3.4c shows a representative UV‐Vis absorption spectrum of a type Ib diamond after irradiation with 2‐MeV electrons and subsequent annealing at 800 °C under vacuum. The signature absorption band of V0 at 1.673 eV has disappeared nearly completely, replaced by a new feature emerging at 1.945 eV due to NV absorption. This large spectral change, a result of the combined irradiation and annealing treatments, shows up as a dramatic alteration in the diamond color from yellow to purple. Upon exposure to green light, these diamonds give off bright red emission vividly radiant in each and every way (Figure 3.6a). This red emission is possibly related to the extended red emission band detected in the interstellar medium as will be discussed in Chapter 14.
The NV center in diamond is a point defect comprising a substitutional nitrogen atom adjacent to a vacancy in a C3v point group symmetry (Figure 3.3b). Similar to the vacancies GR1 and ND1, a NV center can exist in one of the two states: NV0 or NV−. The neutral form NV0 has a sharp ZPL at 575 nm (or 2.156 eV) [32], which is distinctively different from the ZPL at 637 nm (or 1.945 eV) of NV− (Table 3.2) [33]. Both of the ZPLs are accompanied by broad phonon sidebands in the higher energy region of their absorption spectra (cf., Figure 3.4c for NV− only). The corresponding emission bands peak approximately at 600 and 700 nm for NV0 and NV−, respectively (Figure 3.5), with the associated lifetimes of 11.6 ns [34] and 19 ns [35]. Compared to NV−, NV0 is significantly lower in concentration due to the transfer of electrons from N0 to NV0 during annealing [36, 37]:
In type Ib diamonds, since there exist about 100 ppm N0 in the crystal lattice, the reaction in Eq. (3.7) can readily occur at high temperatures, thus reducing the concentration of NV0 in the final products. For the NV− center, its concentration (in cm−3) can be estimated based on the integrated absorption coefficient (in cm−1) of the ZPL at 80 K by [8]
The charge transfer reaction as illustrated above can also be induced with electromagnetic radiation. This is recognized as photochromism, which describes a process where a chemical species can transform between two forms reversibly through the absorption of photons with each form having a distinct absorption spectrum [38]. For the NV centers in diamond, the relative concentrations of the two different forms, NV0 and NV−, may be changed by a shift of the Fermi level due to neutron irradiation [39] or laser illumination [40]. Figure 3.7 presents a schematic energy diagram of the photoinduced ionization and recombination of NV− and NV0 with respect to the energy band gap (Eg = 5.5 eV) of diamond. Detailed spectroscopic investigations have shown that the ionization processes (1 and 2 in Figure 3.7) begin with one‐photon absorption by NV−, followed by the excitation of the same center with the second photon, which promotes the electron from the excited state of NV− to the conduction band, creating NV0. For the charge recombination processes (3 and 4 in Figure 3.7), the NV0 center is first photoexcited, followed by energy transfer and capture of an electron from the valence band to form NV−. At the steady state, the NV− population is close to 75% under continuous laser excitation in the 450–610 nm wavelength range [41].
Figure 3.7 Schematic illustration of the photoinduced ionization and recombination of NV− and NV0. Processes 1 and 2 are associated with ionization and processes 3 and 4 are associated with recombination.
Source: Reprinted with permission from Ref. [41].
3.3.3 H3 and N3
The nitrogen aggregates in type Ia (or natural) diamonds can take on several different forms in structures, which are identifiable based on their characteristic IR absorption bands [6, 11]. The smallest aggregate, known as the A center, consists of two adjacent lattice points occupied by two nitrogen atoms. They can combine with vacancies to form a stable nitrogen–vacancy complex, designated as H3 or N–V–N, with a C2v point group symmetry (Figure 3.3c and Table 3.2). This color center has a ZPL at 503 nm, along with a broad phonon sideband around 470 nm (Figure 3.4d) [42, 43]. Similar to the cases of V0 and NV−, the concentration (in cm−3) of this center can be estimated from the integrated absorption coefficient (in cm−1) of its ZPL at 80 K by [8]
For diamonds containing high‐density ensembles of H3 centers, bright green emission emerges when they are exposed to blue light around 470 nm (Figure 3.6b). The emission band peaks at 530 nm with a quantum efficiency of 0.95 and a lifetime of 16 ns (Table 3.2) [43]. The quantum efficiency remains high at temperatures exceeding 500 °C. Taking advantage of these remarkable photophysical properties, together with the high thermal conductivity and the non‐hygroscopic characteristic of the material, Rand and coworkers [44, 45] explored the possibility of using type Ia diamonds containing H3 as a high‐stability lasing medium for room‐temperature color center lasers. They measured a gain coefficient of 0.201 cm−1 at 531 nm and an absorption cross‐section in the range of (1.4 − 2) × 10−17 cm2 molecule−1 at 488 nm, well suited for laser development.
N3 is another color center frequently discovered in natural diamonds after irradiation and annealing treatments (Table 3.2) [42]. Often produced alongside H3, this structural defect consists of three substitutional nitrogen atoms surrounding a vacancy, designated as N3 + V, in a point group symmetry of C3v (Figure 3.3d). It has a ZPL at 415 nm and shows a photoluminescence sideband around 450 nm. The lifetime of this blue emission is 41 ns and the quantum efficiency is 0.29 (Table 3.2) [46], too low for any viable design of a new laser. The blue emission of this center is most commonly observed in natural diamonds when exposed to UV photons (wavelength < 225 nm), which excite electrons from the valence band to the conduction band [47].
3.3.4 SiV−
Diamond is a highly dense material with eight carbon atoms squeezed in a 3.57‐Å lattice cube (Figure 2.1). As a result, most natural diamonds contain only nitrogen as an impurity and, if any at all, the concentrations of other impurities are lower by several orders of magnitude in comparison. Silicon is a commonly found impurity in CVD diamonds (Section 2.3.2). A Si atom is about 1.5 times the size of a carbon atom. Because of the size difference, a Si can replace two neighboring carbons in the diamond lattice and situate in between two vacant sites, forming an optically active center [48]. In a D3d point group symmetry, the negatively charged silicon–vacancy center (SiV−) shows a sharp ZPL at 738 nm (or 1.681 eV) with a weak phonon sideband around 770 nm in its photoluminescence spectra even at room temperature. The radiative decay lifetime of this center is 1.28 ns, which increases to 1.72 ns as the temperature is lowered from 298 to 4 K [49]. Bright photoluminescence, near‐infrared wavelength, and weak vibronic couplings make this center appealing for quantum optics and quantum information applications [50].
3.4 The NV− Center
Over the past six decades, the optical properties of vacancy‐related color centers in natural and synthetic diamonds have been extensively studied using various spectroscopic techniques [3]. Table 3.2 summarizes the spectroscopic properties of V0, V−, NV0, NV−, H3, N3, and SiV− centers in bulk diamonds. Of these seven color centers, NV− deserves special attention with an in‐depth discussion for its remarkable optical and magnetic properties. We will discuss in this section only some salient features of the center. Excellent reviews on its quantum optical and spectroscopic properties from both theoretical and experimental aspects can be found elsewhere [51–53].
The NV− center consists of three carbons and one nitrogen surrounding an anionic vacancy in a tetrahedral configuration that belongs to a C3v point group symmetry (cf., Table 3.4 for the character table). It is a six‐electron system: 1 e− from each of the three carbons, 2 e− from N, and 1 e− of the vacancy. Linear combinations of atomic orbitals (LCAO) suggest a ground electronic configuration of a12a12e2 [54]. The two electrons in the e‐orbital are unpaired, one in ex and another one in ey [55]. The unperturbed electronic energy structure of the center is 3A2, a triplet ground state with the spin quantum numbers of ms = 0 and ±1 in its magnetic sublevels (Figure 3.8). The two ms = ±1 sublevels are degenerate in a zero magnetic field, and they are energetically higher than the ms = 0 sublevel by 2.87 GHz, which is caused by the crystal field splitting arising from the spin–spin interactions between the unpaired electrons at the ex and ey levels [56]. In the presence of a weak external magnetic field, the degeneracy of the ms = ±1 sublevels at the ground state of NV− is lifted via the Zeeman effect. Under the circumstance that the magnetic field is aligned with the NV’s principal molecular axis passing through the C3 rotation, the energy difference between these two levels is [53]
where ge ∼ 2.003, μB = 14.00 MHz mT−1 is the Bohr magneton, and B is the magnetic field strength (cf., Section 11.1 for further details).
Table 3.4 Character table of the C3v point group.
| C 3v | E | 2C3 | 3σv | ||
| A 1 | 1 | 1 | 1 | z | x 2 + y2, z2 |
| A 2 | 1 | 1 | −1 | R z | |
| E | 2 | −1 | 0 | (x, y), (Rx, Ry) | (x2 – y2, xy), (xz, yz) |
Figure 3.8 Electronic energy diagram of the NV− center in diamond.
Source: Adapted with permission from Ref. [53].
In the optical region, the NV− center shows a characteristic ZPL in both absorption and emission spectra at 637 nm. Uniaxial stress experiments confirmed that the ZPL originated from a transition of an “A” state to the “E” state of a trigonal center [32]. Since the spins must be conserved during optical transitions between the ground and excited states, one may designate the electronic transition as 3A2 → 3E (Figure 3.8). Further studies found that the photoluminescence of the transition had a lifetime of 11.6 ns for a synthetic type Ib diamond [34] with a quantum yield close to 1 [57]. Moreover, the fluorescence intensity was exceptionally stable as the center acted like a pseudo‐atom in an inert and highly thermally conductive matrix. Gruber et al. [58] first reported that the NV− centers were so stable that even under intensive laser excitation (>1 × 10⁶ W cm−2) over an extended period of time, they exhibited no sign of photobleaching. The high photostability allows facile detection of individual NV− centers by fluorescence imaging, especially in biological systems, which constitutes one of the main themes of this book.
With the magneto‐optical properties, the NV− centers are amenable for analysis by optically detected magnetic resonance (ODMR), which is a double resonance technique that enables the transitions between spin sublevels to be detected by optical means. The technique is so powerful that it is capable of enhancing the sensitivity of spin resonance spectroscopy by several orders of magnitude. For the NV− center in diamond, the origin of this effect lies in its unique electronic structure as discussed below.
In the electronic energy diagram of NV− as illustrated in Figure 3.8, there exists a metastable singlet state, 1A. The intersystem crossing (ISC) from 3E to this state is occasionally possible, depending on the sublevel of the excited state. Experimentally, it has been found that the ISC rate from the ms = ±1 sublevel of the excited state to the singlet state is significantly higher than that from the ms = 0 counterpart by non‐radiative energy transfer processes [59]. The singlet state then decays non‐radiatively to the ms = 0 sublevel of the ground state. As a result, the optical pumping can preferentially populate the NV− center in the ms = 0 sublevel of the ground state, a process known as optically induced spin polarization. When a resonant microwave radiation of 2.87 GHz is applied, the electron spin will undergo the transition from ms = 0 to ±1 sublevels of the ground state. Such a transition will reduce the fluorescence intensity by about 30% after several cycles of excitation, because the populations in the ms = ±1 sublevels of the excited state return to the ground state through non‐radiative decays (Figure 3.8). That is to say, the information about the spins at the electronic ground states can be read out optically. Moreover, the spin states of the NV− centers can be probed and manipulated individually by using continuous and/or pulsed microwave radiations for more advanced applications [53].
The ODMR detection of NV− is so unique and significant that it is achievable at the single spin level even at room temperature [58], thanks to the excellent photostability of the center and the high quantum yield of the fluorescence emission. Furthermore, the Zeeman splitting of the ODMR bands of a single NV− center can also be observed with high contrast (Figure 3.9) [60]. At present, the NV− in diamond is the only known solid‐state system that allows detection and manipulation of the spin states of a single localized electron at room temperature. In addition to that, the NV− center has an exceptionally long coherence time and as such its spin states have been reported to remain coherent for longer than 1 ms in isotope‐free bulk diamonds [61]. All these features combined together make diamonds hosting NV− centers an extraordinary tool for ultra‐sensitive measurements of temperature, magnetic field, electric field, and mechanical stress at the nanometer scale [52]. First discovered in the 1950s, and throughout the years well into the twenty‐first century, the center has found remarkable applications in a wide range of research areas, including quantum information [62], quantum computing [63], nanoscale magnetometry [59, 64], high‐precision temperature sensing [65–67], and super‐resolution imaging [68].
Figure 3.9 ODMR spectra of a single NV− center in bulk diamond in the presence of an increasing magnetic field.
Source: Reprinted with permission from Ref. [60]. Reproduced with permission of Nature Publishing Group.
Finally, the NV− center is particularly appealing for use in biological imaging and tracking applications owing to its unmatchable physicochemical properties as summarized here [69–72]:
- The NV− centers can be produced as high‐density ensembles in nanoscale diamonds, which are biologically inert and photostable materials.
- The emission band of NV− peaks at 685 nm where the light has a long penetration depth through tissue, and more than 70% of the emitted photons lie in the near‐infrared window of bioimaging.
- The fluorescence lifetime of NV− is significantly longer than those of cell and tissue autofluorescence, allowing for time‐gated fluorescence imaging both in vitro and in vivo.
- The fluorescence intensity of NV− can be modulated by applying either sinusoidal magnetic field or sinusoidal microwave radiation to achieve background‐free detection in tissue imaging.
The combination of these outstanding features has attracted scientists to employ FNDs containing high‐density ensembles of the NV− centers as bioimaging contrast agents. We will continue the discussion on the biological aspects of the applications in the following chapters of the book.
References
- 1 Kittel, C. (2005). Introduction to Solid State Physics, 8e. Wiley.
- 2 Pohl, R.W. (1937). Electron conductivity and photochemical processes in alkali‐halide crystals. Proc Phys Soc (London) 49 (supplement): 3–31.
- 3 Zaitsev, A.M. (2001). Optical Properties of Diamond: A Data Handbook. Springer‐Verlag.
- 4 Hardy, J.R. and Smith, S.D. (1961). Two‐phonon infra‐red lattice absorption in diamond. Phil Mag 6: 1163–1172.
- 5 Dresselhaus, M.S., Jorio, A., and Saito, R. (2010). Characterizing graphene, graphite, and carbon nanotubes by Raman spectroscopy. Annu Rev Condens Matter Phys 1: 89–108.
- 6 Kaiser, W. and Bond, W.L. (1959). Nitrogen, a major impurity in common type I diamond. Phys Rev 115: 857–863.
- 7 Woods, G.S., Purser, G.C., Mtimkulu, A.S.S., and Collins, A.T. (1990). The nitrogen content of type Ia natural diamonds. J Phys Chem Solids 51: 1191–1197.
- 8 Davies, G. (1999). Current problems in diamond: towards a quantitative understanding. Physica B 273–274: 15–23.
- 9 Wee, T.L., Tzeng, Y.K., Han, C.C. et al. (2007). Two‐photon excited fluorescence of nitrogen‐vacancy centers in proton‐irradiated type Ib diamond. J Phys Chem A 111: 9379–9386.
- 10 Woods, G.S., van Wyk, J.A., and Collins, A.T. (1990). The nitrogen‐content of type‐1b synthetic diamond. Phil Mag B 62: 589–595.
- 11 Kiflawi, I., Mayer, A.E., Spear, P.M. et al. (1994). Infrared‐absorption by the single nitrogen and a defect centers in diamond. Phil Mag B 69: 1141–1147.
- 12 Lawson, S.C., Fisher, D., Hunt, D.C., and Newton, M. (1998). On the existence of positively charged single‐substitutional nitrogen in diamond. J Phys Condens Matter 10: 6171–6180.
- 13 Wee, T.L., Mau, Y.W., Fang, C.Y. et al. (2009). Preparation and characterization of green fluorescent nanodiamonds for biological applications. Diam Relat Mater 18: 567–573.
- 14 Boyd, S.R., Kiflawi, I., and Woods, G.S. (1994). The relationship between infrared absorption and the a defect concentration in diamond. Phil Mag B 69: 1149–1153.
- 15 Liang, Z.Z., Jia, X., Ma, H.A. et al. (2005). Synthesis of HPHT diamond containing high concentrations of nitrogen impurities using NaN3 as dopant in metal‐carbon system. Diam Relat Mater 14: 1932–1935.
- 16 Su, L.J., Fang, C.Y., Chang, Y.T. et al. (2013). Creation of high density ensembles of nitrogen‐vacancy centers in nitrogen‐rich type Ib nanodiamonds. Nanotechnology 24: 315702.
- 17 Ando, T., Ishii, M., Kamo, M., and Sato, Y. (1993). Diffuse reflectance infrared Fourier‐transform study of the plasma hydrogenation of diamond surfaces. J Chem Soc Faraday Trans 89: 1383–1386.
- 18 Griffiths, P.R. and de Haseth, J.A. (2006). Fourier Transform Infrared Spectrometry, 2e. Wiley.
- 19 Shames, A.I., Osipov, V.Y., Bogdanov, K.V. et al. (2017). Does progressive nitrogen doping intensify negatively charged nitrogen vacancy emission from e‐beam‐irradiated Ib type high‐pressure‐high‐temperature diamonds? J Phys Chem C 121: 5232–5240.
- 20 The Nobel Prize in Physics 1903. Nobelprize.org. Nobel Media AB 2014. https://www.nobelprize.org/nobel_prizes/physics/laureates/1903 (accessed 16 April 2018).
- 21 Overton, T.W. and Shigley, J.W. (2008). A history of diamond treatments. Gems Gemology 44: 32–55.
- 22 Royal Society of Chemistry (2017). Radium. http://www.rsc.org/periodic‐table/element/88/radium (accessed 16 April 2018).
- 23 Campbell, B., Choudhury, W., Mainwood, A. et al. (2002). Lattice damage caused by the irradiation of diamond. Nucl Instrum Meth A 476: 680–685.
- 24 Clark, C.D., Ditchburn, R.W., and Dyer, H.B. (1956). The absorption spectra of natural and irradiated diamonds. Proc R Soc Lond A 234: 363–381.
- 25 Clark, C.D., Ditchburn, R.W., and Dyer, H.B. (1956). The absorption spectra of irradiated diamonds after heat treatment. Proc R Soc Lond A 237: 75–89.
- 26 Walker, J. (1979). Optical absorption and luminescence in diamond. Rep Prog Phys 42: 1605–1659.
- 27 Hui, Y.Y. and Chang, H.C. (2014). Recent developments and applications of nanodiamonds as versatile bioimaging agents. J Chin Chem Soc 61: 67–76.
- 28 Davies, G., Lawson, S.C., Collins, A.T. et al. (1992). Vacancy‐related centers in diamond. Phys Rev B 46: 13157–13170.
- 29 Clark, C.D. and Norris, C.A. (1971). Photoluminescence associated with the 1.673, 1.944 and 2.498 eV centres in diamond. J Phys C Solid State Phys 4: 2223–2229.
- 30 Davies, G., Thomaz, M.F., Nazare, M.H. et al. (1987). The radiative decay time of luminescence from the vacancy in diamond. J Phys C Solid State Phys 20: L13–L17.
- 31 Dyer, H.B. and du Preez, L. (1965). Irradiation damage in type I diamond. J Chem Phys 42: 1898–1906.
- 32 Davies, G. (1979). Dynamic Jahn‐Teller distortions at trigonal optical centres in diamond. J Phys C 12: 2551–2566.
- 33 Davies, G. and Hamer, M.F. (1976). Optical studies of 1.945 eV vibronic band in diamond. Proc R Soc A 348: 285–298.
- 34 Collins, A.T., Thomaz, M.F., and Jorge, M.I.B. (1983). Luminescence decay time of the 1.945 eV center in type 1b diamond. J Phys C Solid State 16: 2177–2181.
- 35 Liaugaudas, G., Davies, G., Suhling, K. et al. (2012). Luminescence lifetimes of neutral nitrogen‐vacancy centres in synthetic diamond containing nitrogen. J Phys Condens Matter 24: 435503.
- 36 Collins, A.T. (2002). The Fermi level in diamond. J Phys Condens Matter 14: 3743–3750.
- 37 Collins, A.T., Connor, A., Ly, C.H. et al. (2005). High‐temperature annealing of optical centers in type‐1 diamond. J Appl Phys 97: 083517.
- 38 Dürr, H. (2003). General introduction. In: Molecules and Systems: Photochromism (ed. H. Bouas‐Laurent), 1–14. Elsevier.
- 39 Mita, Y. (1996). Change of absorption spectra in type‐1b diamond with heavy neutron irradiation. Phys Rev B 53: 11360–11364.
- 40 Iakoubovskii, K., Adriaenssens, G.J., and Nesladek, M. (2000). Photochromism of vacancy‐related centres in diamond. J Phys Condens Matter 12: 189–199.
- 41 Aslam, N., Waldherr, G., Neumann, P. et al. (2013). Photo‐induced ionization dynamics of the nitrogen vacancy defect in diamond investigated by single‐shot charge state detection. New J Phys 15: 013064.
- 42 Clark, C.D. and Norris, C.A. (1970). The polarization of luminescence associated with the 4150 and 5032 Å centres in diamond. J Phys C Solid State Phys 3: 651–658.
- 43 Crossfield, M.D., Davies, G., Collins, A.T., and Lightowlers, E.C. (1974). The role of defect interactions in reducing the decay time of H3 luminescence in diamond. J Phys C Solid State Phys 7: 1909–1917.
- 44 Rand, S.C. and DeShazer, L.G. (1985). Visible color‐center laser in diamond. Opt Lett 10: 481–483.
- 45 Roberts, W.T., Rand, S.C., and Redmond, S. (2005). Measuring two key parameters of H3 color centers in diamond. NASA Tech Briefs November: 24–25.
- 46 Thomaz, M.F. and Davies, G. (1978). The decay time of N3 luminescence in natural diamond. Proc R Soc A 362: 405–419.
- 47 Lu, H.C., Lin, M.Y., Chou, S.L. et al. (2012). Identification of nitrogen defects in diamond with photoluminescence excited in the 160–240 nm region. Anal Chem 84: 9596–9600.
- 48 Feng, T. and Schwartz, B.D. (1993). Characteristics and origin of the 1.681 eV luminescence centre in chemical‐vapor‐deposited diamond films. J Appl Phys 73: 1415–1425.
- 49 Rogers, L.J., Jahnke, K.D., Teraji, T. et al. (2014). Multiple intrinsically identical single‐photon emitters in the solid state. Nat Commun 5: 4739.
- 50 Aharonovich, I., Castelletto, S., Simpson, D.A. et al. (2011). Diamond‐based single‐photon emitters. Rep Prog Phys 74: 076501.
- 51 Jelezko, F. and Wrachtrup, J. (2006). Single defect centers in diamond: a review. Phys Stat Sol (a) 203: 3207–3225.
- 52 Doherty, M.W., Manson, N.B., Delaney, P. et al. (2013). The nitrogen‐vacancy colour centre in diamond. Phys Rep 528: 1–45.
- 53 Schirhagl, R., Chang, K., Loretz, M., and Degen, C.L. (2014). Nitrogen‐vacancy centers in diamond: nanoscale sensors for physics and biology. Annu Rev Phys Chem 65: 83–105.
- 54 Lenef, A. and Rand, S.C. (1996). Electronic structure of the N‐V center in diamond: theory. Phys Rev B 53: 13441.
- 55 van Oort, E., Manson, N.B., and Glasbeek, M. (1988). Optically detected spin coherence of the diamond N‐V centre in its triplet ground state. J Phys C Solid State Phys 21: 4385–4391.
- 56 Loubser, J. and van Wyk, J.A. (1978). Electron spin resonance in the study of diamond. Rep Prog Phys 41: 1201–1248.
- 57 Rand, S.C. (1994). Diamond lasers. In: Properties and Growth of Diamond, EMIS Datareviews Series, vol. 9 (ed. G. Davies), 235–240. Institute of Electrical Engineers.
- 58 Gruber, A., Drabenstedt, A., Tietz, C. et al. (1997). Scanning confocal optical microscopy and magnetic resonance on single defect centers. Science 276: 2012–2014.
- 59 Tetienne, J.‐P., Rondin, L., Spinicelli, P. et al. (2012). Magnetic‐field‐dependent photodynamics of single NV defects in diamond: an application to qualitative all‐optical magnetic imaging. New J Phys 14: 103033.
- 60 Balasubramanian, G., Chan, I.Y., Kolesov, R. et al. (2008). Nanoscale imaging magnetometry with diamond spins under ambient conditions. Nature 455: 648–651.
- 61 Balasubramanian, G., Neumann, P., Twitchen, D. et al. (2009). Ultralong spin coherence time in isotopically engineered diamond. Nat Mater 8: 383–387.
- 62 Dutt, M.V.G., Childress, L., Jiang, L. et al. (2007). Quantum register based on individual electronic and nuclear spin qubits in diamond. Science 316: 1312–1316.
- 63 Weber, J.R., Koehl, W.F., Varley, J.B. et al. (2010). Quantum computing with defects. Proc Natl Acad Sci USA 107: 8513–8518.
- 64 Taylor, J.M., Cappellaro, P., Childress, L. et al. (2008). High‐sensitivity diamond magnetometer with nanoscale resolution. Nat Phys 4: 810–816.
- 65 Toyli, D.M., de las Casas, C.F., Christle, D.J. et al. (2013). Fluorescence thermometry enhanced by the quantum coherence of single spins in diamond. Proc Natl Acad Sci USA 110: 8417–8421.
- 66 Kucsko, G., Maurer, P.C., Yao, N.Y. et al. (2013). Nanometer‐scale thermometry in a living cell. Nature 500: 54–58.
- 67 Neumann, P., Jakobi, I., Dolde, F. et al. (2013). High‐precision nanoscale temperature sensing using single defects in diamond. Nano Lett 13: 2738–2742.
- 68 Rittweger, E., Han, K.Y., Irvine, S.E. et al. (2009). STED microscopy reveals crystal colour centers with nanometric resolution. Nat Photon 3: 144–147.
- 69 Vaijayanthimala, V. and Chang, H.C. (2009). Functionalized fluorescent nanodiamonds for biomedical applications. Nanomedicine 4: 47–55.
- 70 Hui, Y.Y., Cheng, C.L., and Chang, H.C. (2010). Nanodiamonds for optical bioimaging. J Phys D Appl Phys 43: 374021.
- 71 Hsiao, W.W.W., Hui, Y.Y., Tsai, P.C., and Chang, H.C. (2016). Fluorescent nanodiamond: a versatile tool for long‐term cell tracking, super‐resolution imaging, and nanoscale temperature sensing. Acc Chem Res 49: 400–407.
- 72 Hui, Y.Y., Hsiao, W.W.W., Haziza, S. et al. (2017). Single particle tracking of fluorescent nanodiamonds in cells and organisms. Curr Opin Solid State Mater Sci 21: 35–42.
- 73 Lu, H.C., Peng, Y.C., Chou, S.L. et al. (2017). Far‐UV excited luminescence of nitrogen‐vacancy centers: evidence for diamonds in space. Angew Chem Int Ed 56: 14469–14472.