8
Cell Labeling and Fluorescence Imaging
Nanocarbons are a family consisting of fullerenes, carbon nanotubes, graphenes, nanodiamonds, and other variations (Section 1.2). Fluorescent nanodiamonds (FNDs) joined the family in 2005 [1]. While receiving less attention than other members of the family, FNDs are gaining popularity as a novel nanoparticle platform for biomedical applications in recent years [2]. An ideal biomedical nanoparticle platform should possess three functionalities: targeting, imaging, and therapeutic [3]. Of course, the nanoparticles must be endowed with high biocompatibility and low cytotoxicity. As evident from all the discussions so far in this book, surface‐functionalized FND clearly meets all these requirements [4]. Applying the platform to biomedical studies is expected to enhance our understanding of the pathophysiological basis of disease, open up more sophisticated diagnostic opportunities, and lead to improved therapies and treatments.
In the previous chapters, we have discussed some core features of FNDs, including their superior magneto‐optical properties (Chapter 3), the ability to be functionalized with diversified bioactive groups (Chapter 4), the inherent biocompatibility (Chapter 5), as well as the high sensitivity detection at the single particle level (Chapter 7). This chapter focuses on arguably the most promising application of the FND‐based platform in biomedicine: cell labeling and imaging. The modalities to achieve the fluorescence imaging of FND‐labeled cells in vitro at various scales are presented. How the methods developed in this chapter can be applied for in vivo cell tracking will be discussed in the next chapter.
8.1 Cell Labeling
Before looking into any technical details, we should probably start with some basic questions about the subject: What is cell labeling? Why labeling? What can be achieved by labeling cells? How to label the cells? How does it fit in the current biomedical development? The following discussions intend to address these issues.
Cell labeling, in a layman’s term, is conducted for the visualization of cells and cellular structures as well as the tracking and modulation of proteins, nucleic acids, and other components in cells. Fluorescence microscopy is one of the two key instruments used by biologists to characterize the outcomes of the labeling. The other is flow cytometry or fluorescence‐activated cell sorting (FACS), which is a laser‐based biophysical method for cell counting, cell sorting, and biomarker detection [5]. Unlike fluorescence microscopy that detects cells on a glass slide, FACS probes laser‐induced fluorescence from suspended cells in a stream of solution passing through a capillary tube. It allows simultaneous multiparametric analysis of cells in high speed, about several thousand cells in minutes. Signals collected by FACS include forward‐scattered light (FSC), side‐scattered light (SSC), and side‐fluorescence light (SFL). The FSC intensity is related to the cell size, the SSC intensity provides information about the cell content (such as nucleus and granules), and the SFL intensity is correlated with the amount of biomarkers present in the cells, which represents a quantitative measurement for the cell labeling efficiency. The technique provides complimentary information to those of fluorescence microscopy.
8.1.1 Nonspecific Labeling
A cell can be labeled with FNDs either specifically or nonspecifically. Surface modification (Chapter 4) plays a central role in determining these two types of labeling. FNDs with a size in the range of 100 nm are often chosen for the cell labeling application because these particles can be produced in a bulk quantity and their fluorescence intensities are sufficiently high for quantitative FACS analysis. Moreover, they are readily usable for nonspecific labeling right after purification by air oxidation and acid wash. As discussed in Section 4.1, FNDs after these two purification steps are surface‐functionalized with a variety of oxygen‐containing groups, including the carboxyl moiety. The carboxylated particles, which are negatively charged, are well dispersed in water at neutral pH (and, therefore, hydrophilic) with high stability. However, they are prone to aggregation in phosphate‐buffered saline (PBS) and cell mediums [6] such as the Dulbecco’s modified Eagle medium (DMEM), which contains amino acids, salts, glucose, and vitamins as the nutrients. Despite the aggregation problem, these surface‐oxidized FND particles are highly biocompatible and useful for cell tracking as illustrated below and in the next chapter.
To conduct the labeling, FNDs after extensive acid washes are first incubated with cells in culture medium without fetal bovine serum (FBS) to facilitate their uptake by endocytosis [7, 8]. Cells are then detached from the dish surface using trypsin, followed by homogenization in PBS and fluorescence intensity measurement by FACS to quantify the amounts of FNDs internalized. Figure 8.1 shows a typical result of the flow cytometric analysis of FND‐labeled HeLa cells, where the amount of FNDs endocytosed by the cells increased nearly linearly with the concentration (1–100 μg ml−1) of the particles in the medium [7]. The half‐life (i.e. the time required to reach half of the maximum accumulation value) was approximately two hours, as revealed by a kinetics study of the uptake (inset of Figure 8.1). In contrast, if the cells were incubated with FNDs in cell medium containing 10% FBS under the same experimental conditions, the cellular uptake efficiency would decrease by about 10‐fold, partially, due to severe agglomeration of the FND particles in the medium.
Figure 8.1 Flow cytometric analysis of 100‐nm FNDs internalized by HeLa cells as a function of particle concentration after three hours of incubation with (black) or without (blue) 10% FBS in cell medium. Inset: Kinetics of the uptake of FNDs (without FBS in medium) at the particle concentration of 25 μg ml−1.
Source: Reprinted with permission from Ref. [7]. Reproduced with permission of John Wiley & Sons.
A distinct feature of this nanoparticle‐based labeling method is that the surface‐oxidized FNDs are spontaneously and avidly taken up by a wide range of cells in the absence of FBS and thus is categorized as nonspecific labeling. Virtually all adherent cells, including cancer and stem cell lines [7–28] as well as primary cells [28–32] (Table 8.1), can be labeled with this method for flow cytometric analysis. To assess the health hazard of the labeling, Vaijayanthimala et al. [8] performed biocompatibility testing with mouse 3T3‐L1 pre‐adipocytes and 489‐2 osteoprogenitors and found that the internalized 100‐nm FND particles did not affect cellular proliferation when monitored at both clonal and population levels. More importantly, no detrimental effect on the in vitro adipogenic differentiation of 3T3‐L1 cells and osteogenic differentiation of 489‐2 cells was observed. In cases where FBS is absolutely required in medium during cell culture, the amount of uptake can be recovered by coating the FND surface with poly‐L‐lysine (PLL), which binds readily with the negatively charged cell membrane by electrostatic attractions [8]. Compared with other cationic polyelectrolytes such as polyethylenimine (PEI), PLL is more biocompatible and less toxic. Other variations of the nonspecific labeling method include coating FNDs with serum albumin to avoid their aggregation in cell medium (Section 4.2.1) so as to achieve more uniform labeling of the cells [19–21].
Table 8.1 Cells successfully labeled with FNDs by endocytosis [7–32].
| Source | Cell line | Primary cell |
| Human | HeLa cervical cancer cells | Mesenchymal stem cells |
| HEK293 embryonic kidney cells | Monocytes | |
| A547 alveolar basal epithelial cells | ||
| HepG2 liver cancer cells | ||
| U‐87 MG glioblastoma | ||
| NT2/D1 embryonal carcinoma stem cells | ||
| Mouse | 3T3‐L1 pre‐adipocytes | Lung stem/progenitor cells |
| 489‐2 osteoprogenitors | Hippocampal neurons | |
| MCF‐7 breast cancer cells | ||
| MDA‐MB‐231 breast cancer cells | ||
| ASB145‐1R breast cancer cells | ||
| P19 embryonal carcinoma stem cells | ||
| RAW264.7 cells |
In FACS analysis of cells labeled with red FNDs (containing NV− centers), the fluorescence signals are typically collected in the far‐red channel (wavelength > 600 nm), where the cell autofluorescence is weak. A signal‐to‐background ratio of 100 : 1 can be achieved when cells are labeled at a particle concentration of 100 μg ml−1 (Figure 8.2a). In addition to fluorescence emission, ironically, the light scattering from FNDs is also useful for cell tracking and sorting applications. Diamond has the highest refractive index of all transparent minerals (Table 2.1), with strong light scattering from ultraviolet to the infrared regions [33]. In an experiment to image diamond nanoparticles individually in mammalian epithelial cells, Smith et al. [34] estimated that the intensity of the elastically scattered light from a single 55‐nm particle was about 300‐fold greater than that of a cell organelle of similar size. The same finding was manifested in Figure 8.2b, where the internalization of the 100‐nm FND particles markedly changed the light scattering characteristics of the cells, resulting in a dramatic increase in SSC and a concomitant decrease in FSC. The changes suggested that there was an increase in cellular granularity due to feeding of the 489‐2 cells with FNDs. Such a significant enhancement in the SSC signals makes light scattering a convenient tool for the identification, isolation, and recovery of the FND‐labeled stem cells from the recipient’s tissue; all can be done on a standard cell‐sorting machine.
Figure 8.2 Flow cytometric analysis of the 1 : 1 mixture of FND‐labeled (magenta) and unlabeled (green) 489‐2.1 cells in the (a) far‐red fluorescence and (b) side scattering channels.
Source: Adapted with permission from Ref. [18]. Reproduced with permission of John Wiley & Sons.
To further develop FNDs into a nanoparticle‐based platform for practical biological applications, Vaijayanthimala et al. [8] prepared and tested mixtures of FND‐labeled cells and unlabeled cells at the number ratio of 1 : 10, 1 : 100, and 1 : 1000. When using the far‐red fluorescence channel for cell sorting, the researchers detected a non‐negligible background (~1%) derived from the 594‐nm excitation of the unlabeled live cells in the high fluorescence intensity region, which made sorting of the FND‐labeled cells in the 1 : 1000 mixture exceedingly difficult. The SSC channel, in contrast, was relatively clean and free of background (<0.005%) from cell autofluorescence. By properly gating the signals in both FSC and SSC channels (Figure 8.3), the researchers were able to obtain a sorted population containing 83.2% viable FND‐labeled cells from a starting 1 : 1000 mixed cell sample after one round of cell sorting. All of this was made possible by the unique photophysical and chemical properties of FNDs.
Figure 8.3 Flow cytometric analysis of FND‐labeled and unlabeled 489‐2.1 cells utilizing the light scattering property of FNDs at various cell number ratios of 1 : 10, 1 : 100, and 1 : 1000. Green data points represent the major live cell population and the blue data points represent the gated FND‐positive cells.
Source: Reprinted with permission from Ref. [18]. Reproduced with permission of John Wiley & Sons.
8.1.2 Specific Labeling
The surface of FNDs provides a versatile platform to conjugate various types of molecules through chemical modification [35]. What is more, because the color centers are deeply embedded in the diamond lattice, all the strategies described in Chapter 4 can be safely applied to FNDs without significantly altering the color centers’ optical absorption and emission properties. Therefore, considerable research efforts have been made to conjugate bioactive molecules onto the FND surface for specific cell labeling and targeting [7, 16, 17, 21, 24, 25, 36, 37]. These molecules include folic acid [7] and transferrin [16, 17]. However, such conjugation often leads to aggregation of the bioconjugated FNDs in physiological medium such as PBS (Section 8.1.1) and the labeling that follows may turn out to be nonspecific. A way to circumvent this problem is to block the empty sites on the FND surface with bovine serum albumin (BSA), which is an excellent stabilizing agent in preventing nanoparticle aggregation (Section 4.2.1). A minor caution worthy of noting: Although the BSA coating can be simply made on the FND surface by physical adsorption, the protein molecule is relatively large (with a molecular weight of 66 kD) and thus may interfere with some specific labeling processes if the targeting ligands are significantly smaller in size.
Recognizing the unique characteristic of serum albumin, Chang et al. [21] coated the surface of FNDs with BSA chemically modified with carbohydrates (known as neoglycoproteins), such as galactose (Gal), N‐acetylgalactosamine (GalNAc), and lactose (Lac), for hepatic targeting (Figure 8.4a). The coating, conducted by noncovalent conjugation, effectively prevented particle aggregation in PBS and cell medium, providing FNDs a high specific targeting ability for asialoglycoprotein receptors (ASGPRs) on HepG2 cells (a human hepatoma cell line). Flow cytometric analysis revealed that the amount of the particle uptake increased steadily with the increasing concentration of the bioconjugated FNDs (Figure 8.5). Only particles coated with the neoglycoproteins or glycoproteins could be effectively taken up by the cells (and, hence, specific labeling). At the concentration of 50 μg ml−1, the mean fluorescence intensity of the HepG2 cells with the Lac‐BSA‐FND labeling was approximately 10‐fold greater than that of the same cells labeled by BSA‐FNDs alone. To further examine the labeling specificity, a competition assay was conducted using free ligands to inhibit the binding of Lac‐BSA‐FNDs with ASGPRs. As shown in Figure 8.6, the uptake of Lac‐BSA‐FND by HepG2 cells was significantly suppressed in the presence of lactose at various incubation times. At the particle concentration of 50 μg ml−1 and the incubation time of 2.5 hours, Lac‐BSA‐FND alone displayed a mean fluorescence intensity of roughly 30, which was reduced to by half in the presence of lactose, indicating a high degree of hepatic targeting efficacy.
Figure 8.4 Surface functionalization of FNDs with proteins. (a) Grafting of neoglycoproteins on FND. The proteins are attached to the surface of acid‐washed FND by physical adsorption. (b) Grafting of streptavidin on FND. The grafting starts with activation of the surface carboxyl groups on FND with EDC and NHS, forming amine‐reactive terminus. The FND is then conjugated with carboxyl PEG amines via carboxyl‐to‐amine cross‐linking. Further activation leads to covalent coupling between of the carboxyl groups of PEG‐FND and the primary amine groups (–NH2) of streptavidin through amide bond formation. Finally, the SA‐conjugated PEG‐FND is noncovalently covered with BSA to prevent particle aggregation in PBS.
Source: Reprinted with permission from Ref. [21]. Reproduced with permission of John Wiley & Sons.
Figure 8.5 Flow cytometric analysis of the uptakes of protein‐conjugated FNDs by HepG2 cells. Mean fluorescence intensities as a function of the concentration (0, 10, 25, and 50 μg ml−1) of the labeling agent, as annotated in the figure, reflect different levels of the uptake of FNDs conjugated with BSA, neoglycoprotein, or glycoprotein.
Source: Reprinted with permission from Ref. [21]. Reproduced with permission of John Wiley & Sons.
Figure 8.6 Competition assays for the uptake of Lac‐BSA‐FND by HepG2 cells measured by flow cytometry. The cellular uptake of Lac‐BSA‐FND (50 μg ml−1) is significantly suppressed due to the presence of lactose (0.3 M), showing the competition for binding with ASGPRs by free lactose.
Source: Reprinted with permission from Ref. [21]. Reproduced with permission of John Wiley & Sons.
Antibody‐based targeting is the second method of specific labeling as illustrated in Figure 8.4b with heterobifunctional poly(ethylene glycol) (PEG) as the linker for surface functionalization (Section 4.2.2). In this method, FNDs are first PEGylated and then covalently conjugated with streptavidin (SA), to which biotin‐labeled antibodies of interest are linked [20]. It involves the reaction between the carboxyl groups on FNDs and the amino groups of NH2‐PEG‐COOH, followed by covalent conjugation of the bifunctional PEG with SA through amide bond formation. The purpose of conjugating SA is that the protein can bind with any biotin‐labeled antibodies of interest through the avidin–biotin interaction, the strongest known noncovalent bonding in biology [38]. Finally, the SA‐conjugated FNDs are noncovalently coated with BSA to prevent aggregation in biological buffer. Chang et al. [21] demonstrated the high targeting specificity of the bioconjugated FNDs with biotinylated antibodies and then with the surface antigens on HepG2 cells and the breast cancer cell lines, MCF‐7, MDA‐MB‐231, and ASB145‐1R. In these experiments, it was crucial to ensure good dispersibility of the SA‐conjugated FND in the high‐salt media, since particle agglomeration and/or precipitation were always a concern. With the BSA coating, we now have the necessary safeguard to carry out the specific labeling.
Taking a different approach, Cigler and coworkers [24] encapsulated FNDs in 10–20 nm‐thick translucent silica shells (Section 4.3.2). They then applied the silica‐encapsulated FNDs, coated with a biocompatible N‐(2‐hydroxypropyl)methacrylamide copolymer shell, for cancer‐cell targeting and fluorescence imaging. Through click chemistry, the copolymer could bear both Alexa Fluor 488 and cyclic peptides, Arg‐Gly‐Asp (RGD). These RGD‐conjugated particles were able to selectively target integrin αvβ3 receptors on human glioblastoma cells with a high internalization efficacy as confirmed by flow cytometric analysis.
As part of an ongoing effort to improve the efficacy of the specific labeling, Hsieh et al. [37] employed biotinylated lipid‐coated FNDs (bL‐FND) to specifically target cell surface antigens. With a lipid layer composed of biotinylated PEGylated 1,2‐distearoyl‐sn‐glycero‐3‐phosphoethanolamine, they synthesized the bL‐FND particles by using the solvent evaporation method described in Section 4.3.1. Their results showed that the encapsulation of FNDs in the biotinylated lipids enabled the particles not only stable dispersion in high ionic strength buffers but also high target specificity. A viable application of the technique was demonstrated with biotin‐mediated immunostaining of CD44 antigens on fixed human cells. Thanks to the bright fluorescence and enduring photostability of 100‐nm bL‐FNDs, the positions of the CD44 antigens could be located by correlative light‐electron microscopy (CLEM) with accuracy better than 50 nm, limited mainly by the size of the FND particles (cf., Section 10.4 for further discussion).
8.2 Fluorescence Imaging
8.2.1 Epifluorescence and Confocal Fluorescence
In this chapter, we have so far learned how to make the cells visible by labeling with FNDs. Next, we will have to find ways to see them by fluorescence imaging. We will soon find out that FNDs are a promising candidate for probing both temporal and spatial events in live cells. Particularly for the NV− centers, their fluorescence emission band (peaking at ∼690 nm) is well separated from that (peaking at ∼500 nm) of the cell autofluorescence derived from endogenous fluorophores such as flavins and NAD(P)H [9, 39], making it easy to observe red FNDs in cells by epifluorescence imaging with a mercury vapor lamp as the light source. A representative example is given in Figure 8.7 for surface‐oxidized red FNDs internalized by HeLa cells. Optical section images along the z direction show that most of the particles are distributed in the cytoplasm but not within the nuclei. To identify the exact location of the individual FND particles (~100 nm in diameter), confocal fluorescence microscopy can serve the purpose well. The microscopy provides better optical resolution and contrast due to the addition of a spatial pinhole placed at the confocal plane of the lens to eliminate out‐of‐focus light [40]. The technique enables three‐dimensional structural reconstruction from the images acquired at different depths of focus within an object. By performing colocalization analysis using endosomal/lysosomal markers through confocal fluorescence imaging, Faklaris et al. [14, 15] confirmed that the internalized FND particles were predominantly trapped in the endocytic vesicles (endosomes in Figure 8.8a and lysosomes in Figure 8.8b), leaving only some smaller particles free in the cytosol. The majority of the FND particles were located at the perinuclear region.

Figure 8.7 Vertical cross‐section scans (0–8 μm) of the wide‐field epifluorescence image of a HeLa cell after FND uptake by endocytosis. As evidenced by the images taken at 3–5 μm, most of the FND particles are distributed in the cytoplasm and do not enter the nucleus of the cell.
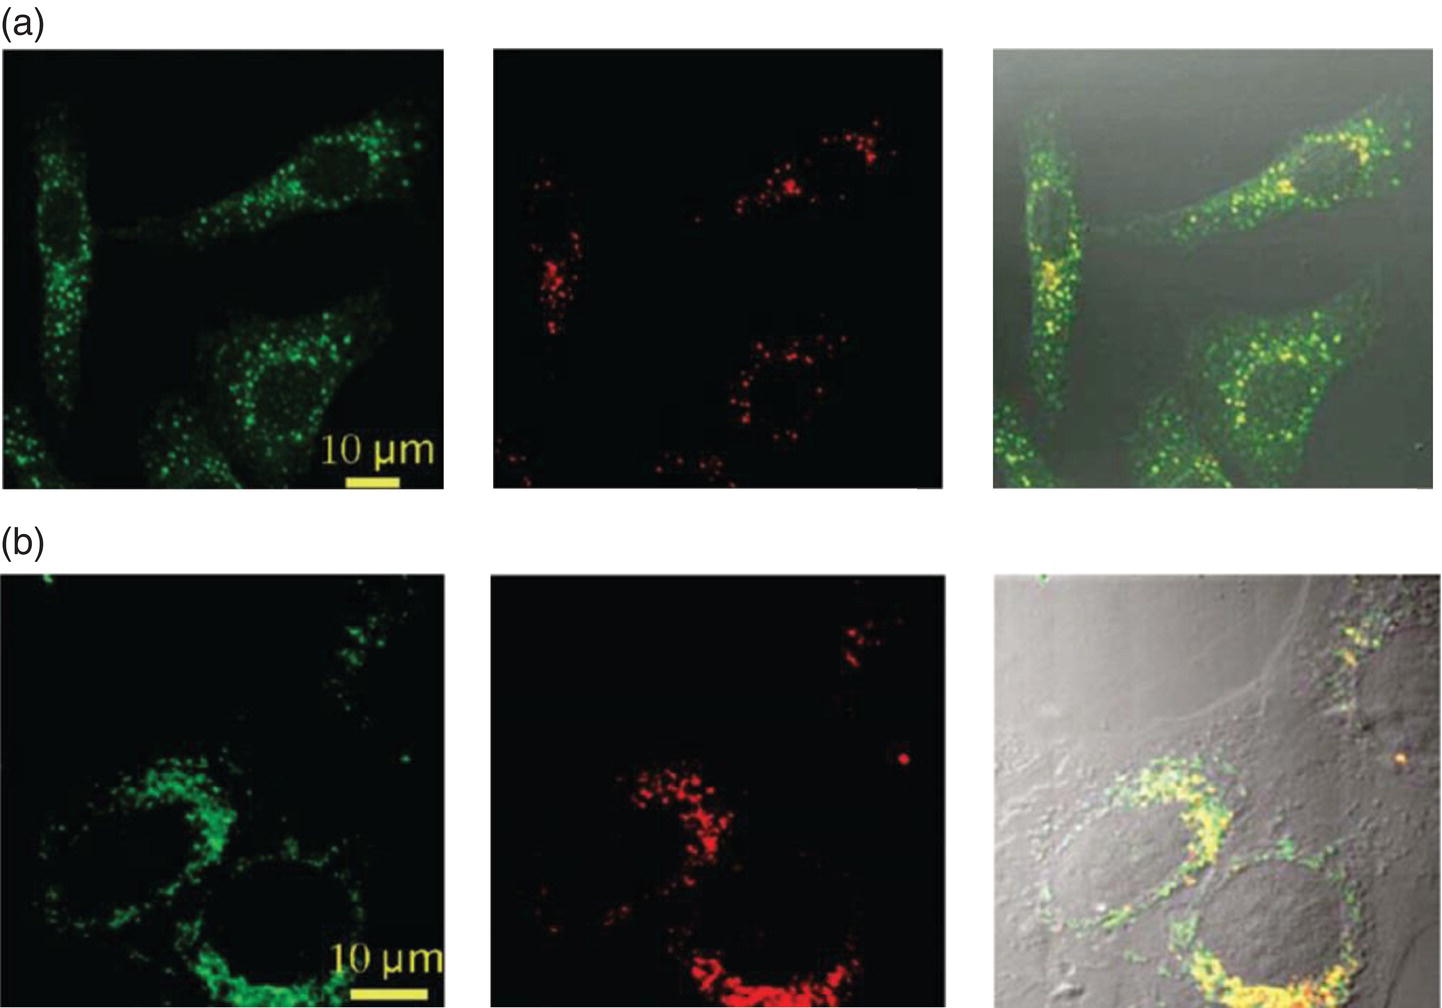
Figure 8.8 (a) Colocalization study of FNDs with early endosomes labeled with EEA1‐FITC fluorescent conjugates. (b) Colocalization of FNDs with lysosomes labeled with green LysoTracker. FNDs colocalized with endosomes or lysosomes appear in yellow in the merged fluorescence scans. Images were acquired by confocal fluorescence raster scans of HeLa cells incubated with FNDs (10 μg ml−1) in normal (control) conditions, then fixed, followed by labeling with endosomal or lysosomal markers. From left to middle: raster scan in the green channel (500–530 nm) showing the endocytic compartments and in the red channel (600–750 nm) showing the FNDs. Images on the right represent the merged green and red scans.
Source: Reprinted with permission from Ref. [15]. Reproduced with permission of American Chemical Society.
Equipped with excellent photostability and biocompatibility, FNDs can be used to identify directly and specifically the labeled cells over an extended period of time by fluorescence imaging. A proof‐of‐principle experiment conducted by Chang et al. [21] used SA‐PEG‐FNDs to probe specifically CD44 antigens on the surface of the ASB145‐1R cells. In this experiment, cells were first labeled with biotinylated anti‐CD44 and then stained with either SA‐PEG‐FND or DyLight488‐SA at 4 °C, after which the cells were washed with PBS and incubated at 37 °C to facilitate endocytosis. Figure 8.9 compares confocal fluorescence images of the cells with dye‐ and FND‐labeled CD44 on their surfaces before (panels a−h) and after (panels i−k) endocytosis. As noted, the dyed samples could not last long enough for a valid experiment to complete due to photobleaching (Figure 8.9d). In contrast, the FND fluorescence intensities remained at nearly the same level throughout the entire time of the experiment (Figure 8.9h), indicating that the nanoprobes were not only non‐photobleaching but also resistant to degradation by enzymes and acids in endosomes and/or lysosomes.
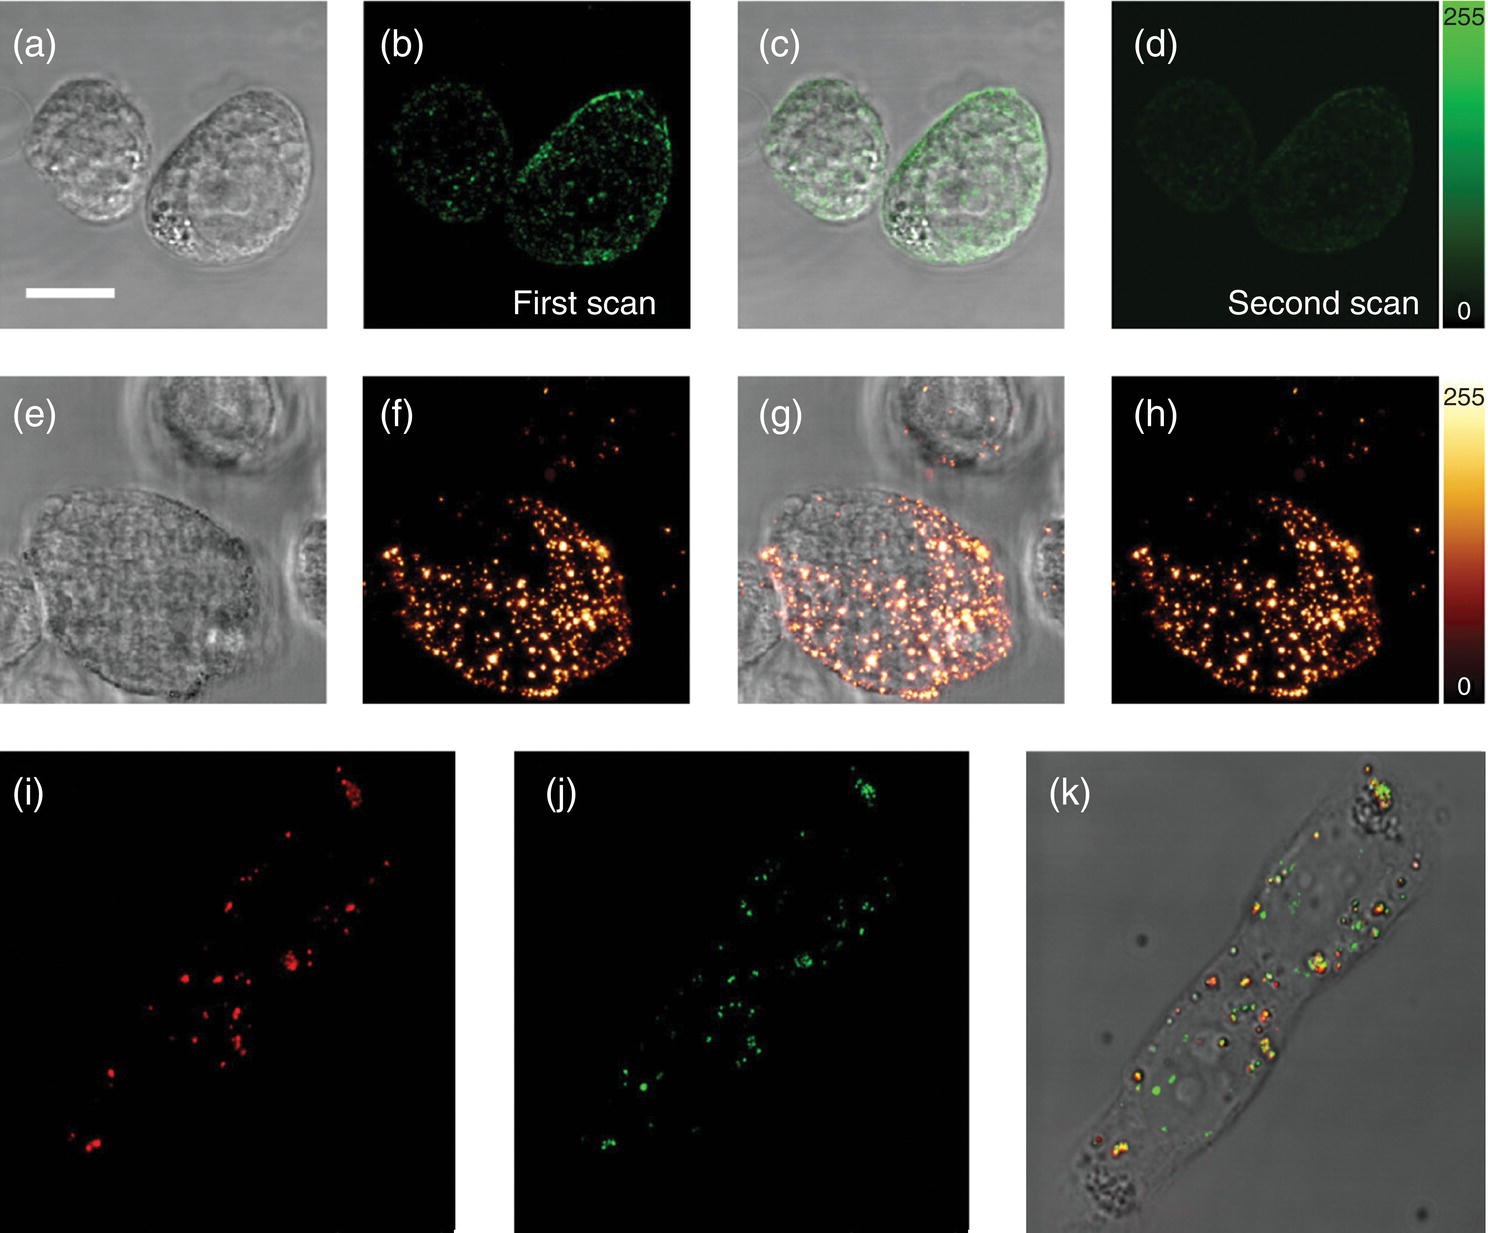
Figure 8.9 Bright‐field and confocal fluorescence images of live ASB145‐1R cells labeled with DyLight488‐SA or SA‐PEG‐FND before and after endocytosis. The cells were first stained with biotinylated anti‐CD44 antibody and then incubated with DyLight488‐SA (a−d) or SA‐PEG‐FND (e–h) at 4 °C. Panels (a) and (e) are bright‐field images, (b), (d), (f), and (h) are Z‐stacked confocal fluorescence images, and (c) and (g) are merged bright‐field and Z‐stacked confocal fluorescence images of the cells before endocytosis. The contrast in photostability between these two types of fluorophores is evident in (d) and (h), where the organic dye photobleached during the second scan of the specimen. FND‐labeled CD44 on the cell surface was then internalized through endocytosis at 37 °C (i−k). The orange spots in the merged fluorescence image (k) evidence that the FND (red, i) are colocalized with endosome/lysosomes, which were stained by the endo‐lysosomal marker, Rab7 (green, j). Scale bar: 10 μm.
Source: Reprinted with permission from Ref. [21]. Reproduced with permission of John Wiley & Sons.
8.2.2 Total Internal Reflection Fluorescence
Total internal reflection fluorescence microscopy (TIRFM) is a sensitive method to detect FNDs attached to cell membrane. Using an evanescent wave generated by total internal reflection, TIRFM can selectively excite fluorophores in a region (typically in a few hundred nanometer thick) immediately adjacent to the glass‐water interface [41]. The technique has found a wide range of bioimaging applications, particularly in areas where it is necessary to view biomolecules attached to a planar surface or to study the position and dynamics of biomolecules and organelles in live cells near the contact regions with the glass substrate. Because the evanescent wave intensity decays exponentially as the distance grows from the water‐solid interface, nearly background‐free detection can be achieved with this technique.
Sotoma et al. [25] applied TIRFM to track the diffusion trajectory of FND‐labeled proteins on membrane surface. The targeted protein was IL18Rα, a membranous receptor protein for interleukin‐18, which is one of the most representative pro‐inflammatory cytokines expressed in a variety of cancers [42]. The researchers first modified 30‐nm FNDs with hyperbranched polyglycerol (HPG) to suppress nonspecific interaction with biomolecules and self‐aggregation. The HPG‐coated nanoparticles were then conjugated with ampicillin (Amp), which can covalently bind with mutated β‐lactamase‐tag (BL‐tag) via the β‐lactam ring [43]. To demonstrate the specific labeling capability of the nanoparticle bioconjugates, they constructed a plasmid DNA encoding BL‐tag‐fused IL18Rα and established a human embryonic kidney cell line (HEK293) that could express this protein on the plasma membrane. Labeling of IL‐18Rα with FND‐HPG‐Amp allowed them to track the protein on cell membrane by TIRFM for more than eight seconds without any sign of photobleaching. The high sensitivity of TIRFM has also enabled background‐free tracking of single 35‐nm FNDs in axons of hippocampal neurons to study brain‐related disease, as illustrated in Figure 7.9 [31].
8.2.3 Two‐Photon Excitation Fluorescence
In the field of biomedicine, two‐photon excitation (TPE) microscopy represents an advanced imaging modality that has attracted considerable attention for in vivo imaging applications [44, 45]. The technique has several distinct advantages over conventional one‐photon excitation (OPE) microscopy. First, the absence of out‐of‐focus absorption significantly improves the image contrast of the target specimens [44]. Second, the employment of red and near‐infrared light in TPE produces lower autofluorescence and scattering signals than those in OPE. Third, TPE microscopy provides optical sectioning at a depth of up to several hundred micrometers, which is about one order of magnitude deeper than that of OPE [45]. However, the trade‐off is that the method requires an ultrafast laser for the excitation as explained below.
To conduct TPE fluorescence spectroscopy of the NV− centers in bulk diamond, Wee et al. [46] used a picosecond mode‐locked laser operating at 1064 nm as the excitation source. Based on the corresponding one‐photon absorption cross section of 3.1 × 10⁻¹⁷ cm2 at 532 nm (Section 7.1.2), they determined the two‐photon absorption cross section of a single NV− center at 1064 nm to be 0.45 × 10−50 cm4 s photon−1, which was about 1/30th that of a dye molecule like rhodamine B. Further studies over a wider wavelength range found the two‐photon absorption cross sections to fall in the range of (0.1–0.5) × 10−50 cm4 s photon–1 at 800–1040 nm [47]. These values are three orders of magnitude smaller than that of typical CdS quantum dots. Although the two‐photon absorption cross section of NV− is small, the deficiency can be compensated by increasing the number of NV− centers in the particles [48]. For example, a 100‐nm FND may contain up to 1000 NV− centers, making it highly competitive as a TPE marker.
As a biomedical imaging technique, TPE microscopy outperforms OPE in that it generates better contrast images because of the dramatic reduction of autofluorescence and light scattering from the specimens. The same outstanding feature is also present for TPE of FNDs in cells. Figure 8.10a displays confocal scanning images of a fixed HeLa cell labeled with 140‐nm FNDs and probed with both OPE and TPE microscopies. The three images in each row are axial slices of the cell acquired at three different positions in each excitation, showing the cellular uptake of the particles (labeled with red and yellow boxes). A comparison between the results of these two excitations clearly indicates that the TPE images have a better contrast. Using residual light scattering and cell autofluorescence signals, Chang et al. [13] reconstructed a three‐dimensional image of the cell, as shown in Figure 8.10b. No evidence was found for the entry of the particles into the nucleus. The research team further analyzed the intensity profiles of the FNDs residing in the cytoplasm (Figure 8.10c) and concluded that both the lateral and axial cross sections of the TPE images were only half those of the corresponding OPE images, proving the advantages of using TPE in fluorescence imaging.
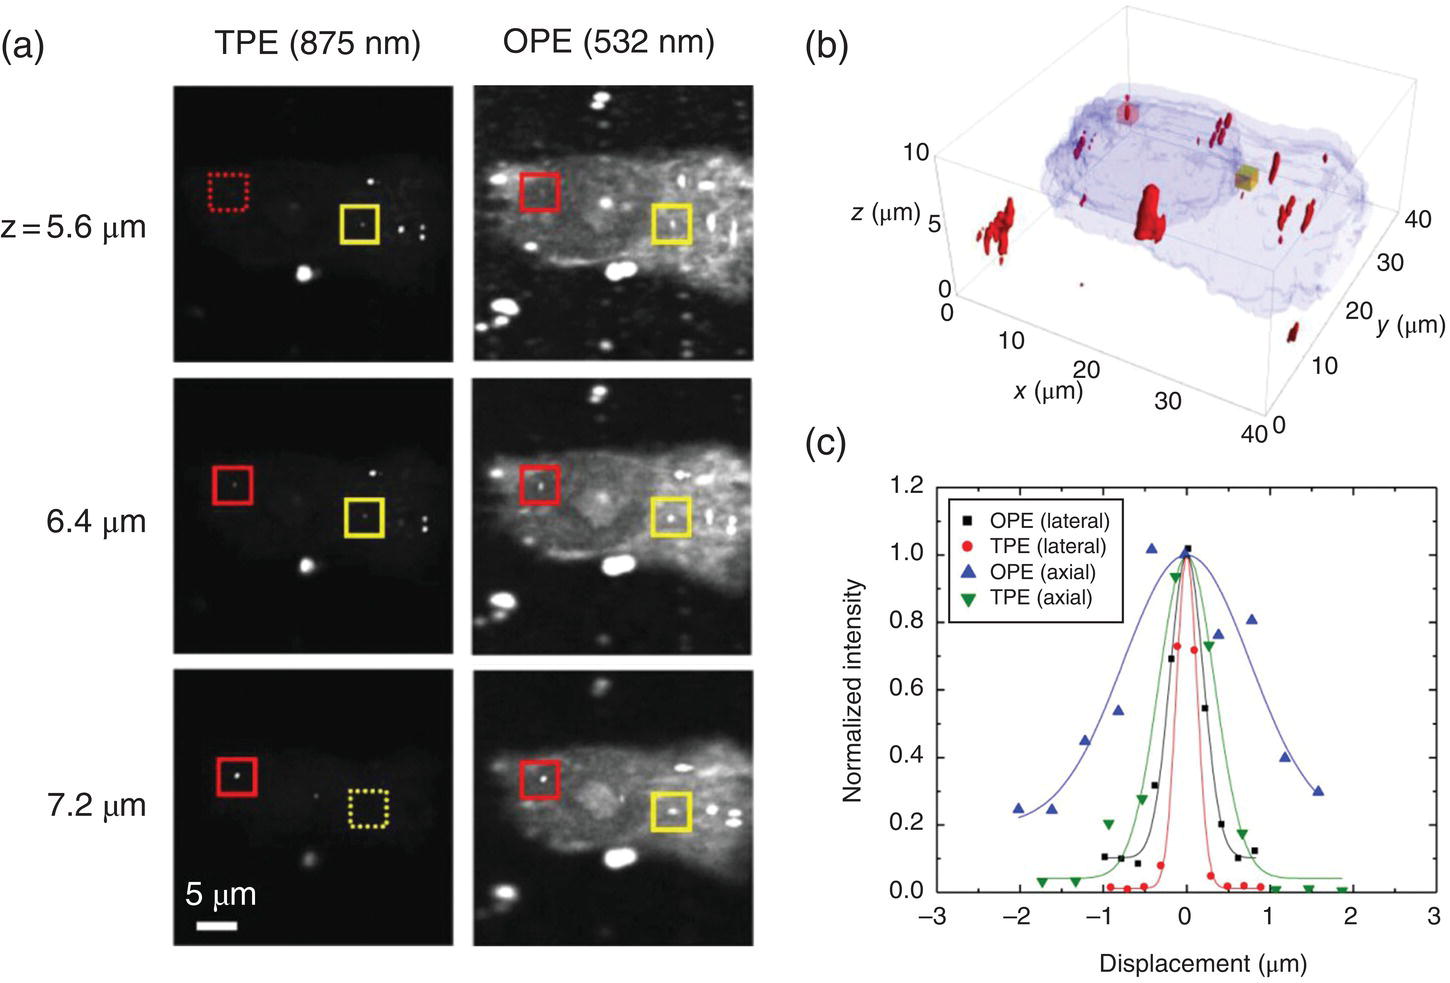
Figure 8.10 One‐photon and two‐photon excited fluorescence images of 140‐nm FNDs in a fixed HeLa cell. (a) Typical OPE and TPE confocal fluorescence images of the same cell. (b) Three‐dimensional TPE image of the cell and the internalized FNDs. (c) Lateral and axial cross‐sections of the FND labeled with a red box in (a). Note that the resolution of TPE for this particular particle was approximately 300 nm in the lateral direction and approximately 800 nm in the axial direction, both of which are close to their theoretical diffraction limits.
Source: Reprinted with permission from Ref. [13]. Reproduced with permission of Nature Publishing Group.
In another study, Hui et al. [49] employed a femtosecond Nd: glass laser operating at 1060 nm and 72 MHz for TPE of lipid‐encapsulated FNDs in live HeLa cells. By using this technique, they were able to detect single FND particles of approximately 40 nm in size with good image contrast in the cytoplasm and track their motions by fluorescence correlation spectroscopy (Figure 7.10). Again, a better image contrast of the FNDs in cells was achieved by TPE as it outperformed OPE in eliminating background fluorescence. The excited volume of TPE was small due to the quadratic dependence of the fluorescence intensity on the intensity of the incident light. As a result, the photon‐mediated damage of the live cells was largely reduced. Finally, an added benefit of using the 1060‐nm excitation was that it gave characteristic signatures of only NV− centers in the fluorescence spectra, discriminating all NV0 emissions that would have needed TPE at 875 nm instead.
8.2.4 Time‐Gated Fluorescence
Suggested by its own name, fluorescence lifetime imaging microscopy (FLIM) is a time‐resolved imaging technique. The method utilizes the differences in average fluorescence lifetimes of molecules or particles to generate high‐contrast images [50]. As already discussed in Section 3.4, the average fluorescence lifetime of the NV− defects in bulk diamond is 11.6 ns (Table 3.2), whereas the decay time extends to about 20 ns if the same centers are hosted in FNDs either spin‐coated on a glass substrate [51, 52], suspended in water [48], or injected into living organisms [53]. Such a difference in lifetime stems from the large change in refractive index of the surrounding medium when replacing a bulk crystal with a nanometer‐sized crystal. Nevertheless, whether in a bulk diamond or in an FND, the lifetimes of the NV− centers are all significantly longer than those (0.3–6.8 ns) of endogenous and exogenous fluorophores commonly used in cell biology [50]. This allows researchers to sequester the FND emission from the huge ensemble of autofluorescence backgrounds in cells and tissues by employing various time‐gating techniques to improve the image contrast.
Faklaris et al. [14] first leveraged this method to acquire the confocal fluorescence images of sub‐50 nm FNDs, each containing only a single NV− center, in HeLa cells (Figure 8.11a and b). Significant improvement of the image contrast was achieved by using a picosecond pulsed laser (532 nm) as the excitation source and detecting emitted photons at 15–53 ns after the laser pulses (Figure 8.11c). Their result demonstrated that FNDs could be easily detected at the single‐particle level in high cell autofluorescence background by time‐gated imaging, unambiguously locating the positions of the nanoparticles inside the cells.

Figure 8.11 Time‐resolved confocal fluorescence images of a fixed cell containing FNDs. (a) Raster‐scan image obtained by detecting all photons, displaying NV− fluorescence together with cell autofluorescence. (b) Time‐gated raster scan constructed from photons detected between 15 and 53 ns after pulsed laser excitation. Scan area: 25 × 25 μm2. (c) Fluorescence time decay from one of the FNDs shown in (a).
Source: Adapted with permission from Ref. [14]. Reproduced with permission of John Wiley & Sons.
In another study, Hui et al. [22] conducted wide‐field time‐gated fluorescence imaging of FND‐labeled cancer cells in whole blood with a sub‐nanosecond laser for excitation followed by detection of an intensified charge‐coupled device (ICCD). Figure 8.12a and b display fluorescence images of HeLa cells labeled with 100‐nm FNDs by endocytosis. The images were acquired either with or without time gating after 599‐nm laser excitation. The image contrast, defined as the ratio between FND and background fluorescence signals, was poor in Figure 8.12a because the hemoglobin molecules in human blood (with a concentration of ~150 mg ml−1) also emitted red fluorescence upon excitation with the orange‐red light. Fortunately, as the fluorescence lifetime of hemoglobin was shorter than 1 ns, the background noise could be effectively filtered out temporally by setting the ICCD shutter delay time at 10 ns (Figure 8.12b). An improvement of the image contrast by a factor of approximately 20 was achieved when the time gating function was turned on (Figure 8.12c). Further discussion of the technique for in vivo imaging can be found in the next chapter.
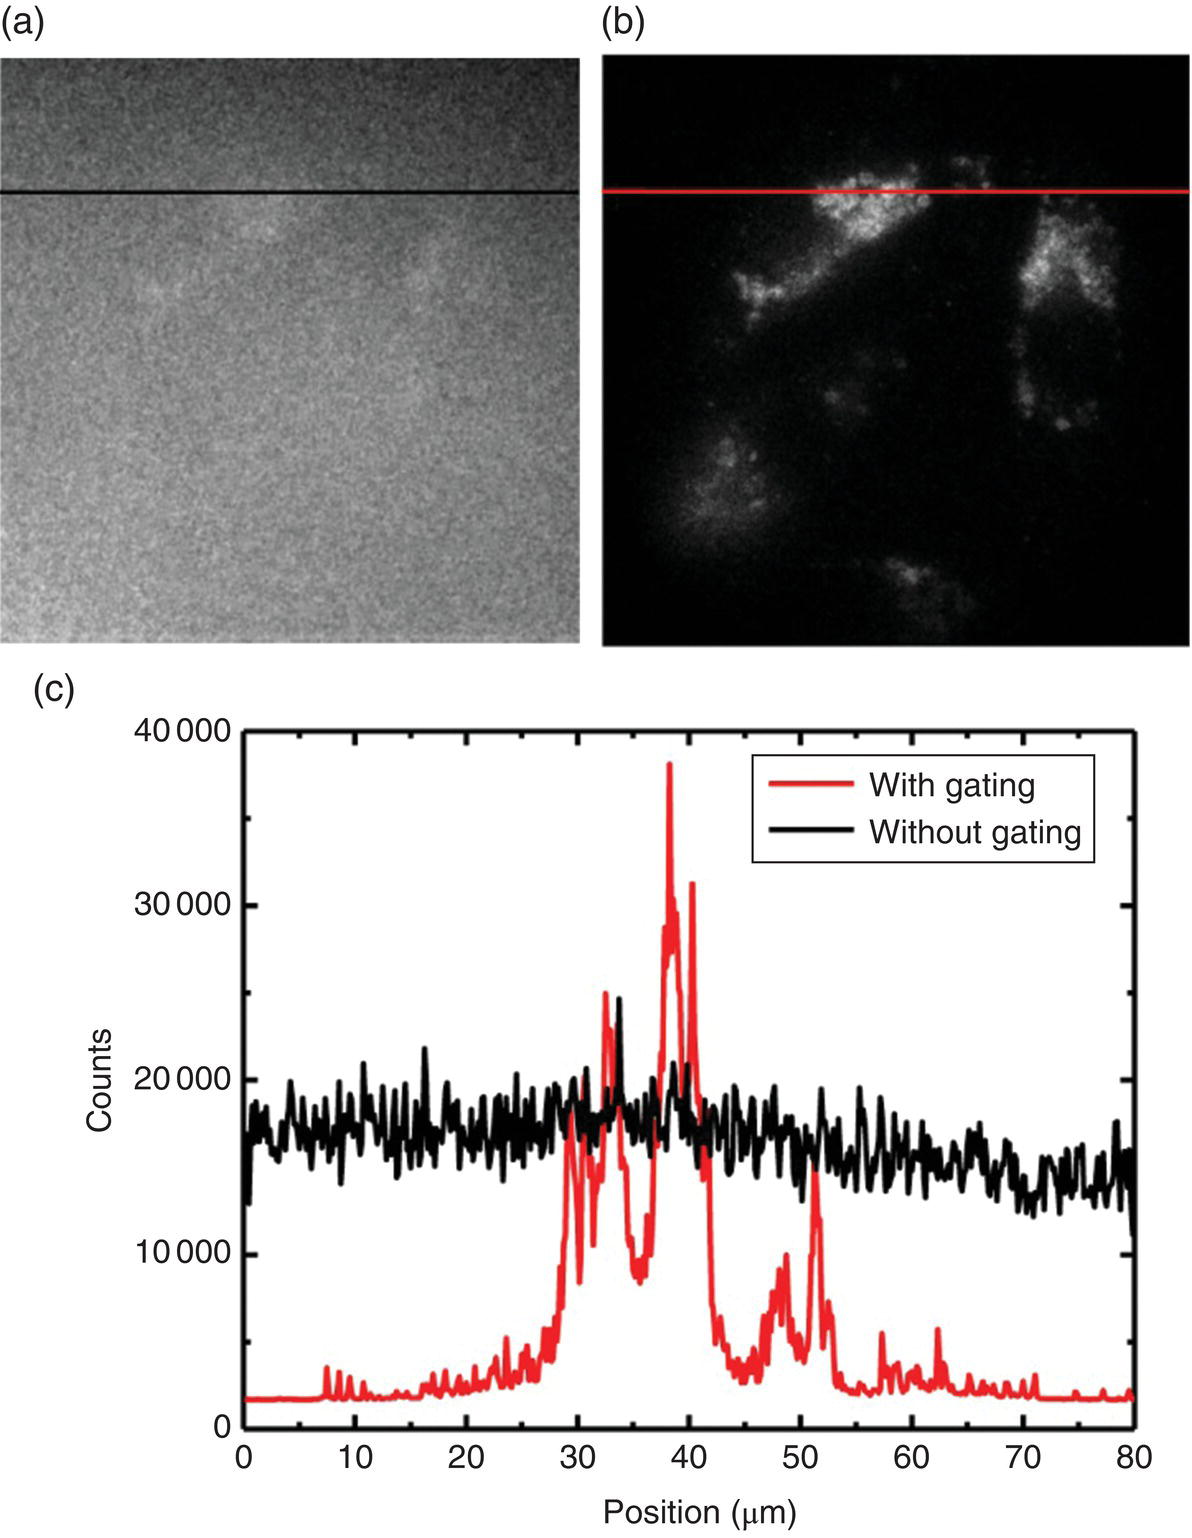
Figure 8.12 (a, b) Wide‐field fluorescence images of FND‐labeled HeLa cells attached to a coverglass slide and immersed in human blood without (a) or with (b) time gating. The exposure times used for the fluorescence imaging with a 100 × oil‐immersion objective lens in (a) and (b) are 0.1 and 0.3 seconds, respectively. (c) Intensity profiles along the black and red color lines denoted in (a) and (b), respectively.
Source: Reprinted with permission from Ref. [22].
A natural extension of the time‐gated fluorescence imaging technology is the time‐gated flow cytometry. Hui et al. [22] proved the concept by detecting individual FND‐labeled HeLa cells in blood, which flowed through a microchannel of 50 μm in width and 50 μm depth. The dimensions of this channel were intentionally chosen to mimic those of capillaries in mice and rats. With sequential readout of the signals from an ICCD camera, the optimal frame rate of the recording was 23 Hz (or 43.5 ms frame−1). The researchers demonstrated that the time‐gating technique could effectively suppress background fluorescence signals (and thus enhance the visibility of FNDs), allowing for direct observation of the flow of FND‐labeled HeLa cells in human blood at a concentration of lower than 8000 cells ml−1 in the capillary‐sized microchannels. The same principle can be applied to achieving background‐free detection of FND‐labeled cells in a standard flow cytometer equipped with a femtosecond supercontinuum white light laser system [54]. It enables FACS analysis of cells with ultra‐high sensitivity and selectivity.
References
- 1 Yu, S.J., Kang, M.W., Chang, H.C. et al. (2005). Bright fluorescent nanodiamonds: no photobleaching and low cytotoxicity. J Am Chem Soc 127: 17604–17605.
- 2 Hong, G., Diao, S., Antaris, A.L., and Dai, H. (2015). Carbon nanomaterials for biological imaging and nanomedicinal therapy. Chem Rev 115: 10816–10906.
- 3 Zhang, L., Gu, F.X., Chan, J.M. et al. (2008). Nanoparticles in medicine: therapeutic applications and developments. Clin Pharmacol Ther 83: 761–769.
- 4 Vaijayanthimala, V. and Chang, H.C. (2009). Functionalized fluorescent nanodiamonds for biomedical applications. Nanomedicine 4: 47–55.
- 5 Herzenberg, L.A., Parks, D., Sahaf, B. et al. (2002). The history and future of the fluorescence activated cell sorter and flow cytometry: a view from Stanford. Clin Chem 48: 1819–1827.
- 6 Hemelaar, S.R., Nagl, A., Bigot, F. et al. (2017). The interaction of fluorescent nanodiamond probes with cellular media. Microchim Acta 184: 1001–1009.
- 7 Zhang, B.L., Li, Y.Q., Fang, C.Y. et al. (2009). Receptor‐mediated cellular uptake of folate‐conjugated fluorescent nanodiamonds: a combined ensemble and single‐particle study. Small 5: 2716–2721.
- 8 Vaijayanthimala, V., Tzeng, Y.K., Chang, H.C., and Li, C.L. (2009). The biocompatibility of fluorescent nanodiamonds and their mechanism of cellular uptake. Nanotechnology 20: 425103.
- 9 Fu, C.C., Lee, H.Y., Chen, K. et al. (2007). Characterization and application of single fluorescent nanodiamonds as cellular biomarkers. Proc Natl Acad Sci USA 104: 727–732.
- 10 Neugart, F., Zappe, A., Jelezko, F. et al. (2007). Dynamics of diamond nanoparticles in solution and cells. Nano Lett 7: 3588–3591.
- 11 Chao, J.I., Perevedentseva, E., Chung, P.H. et al. (2007). Nanometer‐sized diamond particle as a probe for biolabeling. Biophys J 93: 2199–2208.
- 12 Liu, K.K., Cheng, C.L., Chang, C.C., and Chao, J.I. (2007). Biocompatible and detectable carboxylated nanodiamond on human cell. Nanotechnology 18: 325102.
- 13 Chang, Y.R., Lee, H.Y., Chen, K. et al. (2008). Mass production and dynamic imaging of fluorescent nanodiamonds. Nat Nanotechnol 3: 284–288.
- 14 Faklaris, O., Garrot, D., Joshi, V. et al. (2008). Detection of single photoluminescent diamond nanoparticles in cells and study of the internalization pathway. Small 4: 2236–2239.
- 15 Faklaris, O., Joshi, V., Irinopoulou, T. et al. (2009). Photoluminescent diamond nanoparticles for cell labeling: study of the uptake mechanism in mammalian cells. ACS Nano 3: 3955–3962.
- 16 Weng, M.F., Chiang, S.Y., Wang, N.S., and Niu, H. (2009). Fluorescent nanodiamonds for specifically targeted bioimaging: application to the interaction of transferrin with transferrin receptor. Diam Relat Mater 18: 587–591.
- 17 Li, Y. and Zhou, X. (2010). Transferrin‐coupled fluorescence nanodiamonds as targeting intracellular transporters: an investigation of the uptake mechanism. Diam Relat Mater 19: 1163–1167.
- 18 Fang, C.Y., Vaijayanthimala, V., Cheng, C.A. et al. (2011). The exocytosis of fluorescent nanodiamond and its use as a long‐term cell tracker. Small 7: 3363–3370.
- 19 Tzeng, Y.K., Faklaris, O., Chang, B.M. et al. (2011). Superresolution imaging of albumin‐conjugated fluorescent nanodiamonds in cells by stimulated emission depletion. Angew Chem Int Ed 50: 2262–2265.
- 20 Lee, J.W., Lee, S., Jang, S. et al. (2013). Preparation of non‐aggregated fluorescent nanodiamonds (FNDs) by non‐covalent coating with a block copolymer and proteins for enhancement of intracellular uptake. Mol Biosyst 9: 1004–1011.
- 21 Chang, B.M., Lin, H.H., Su, L.J. et al. (2013). Highly fluorescent nanodiamonds protein‐functionalized for cell labeling and targeting. Adv Funct Mater 23: 5737–5745.
- 22 Hui, Y.Y., Su, L.J., Chen, O.Y. et al. (2014). Wide‐field imaging and flow cytometric analysis of cancer cells in blood by fluorescent nanodiamond labeling and time gating. Sci Rep 4: 5574.
- 23 Hsu, T.C., Liu, K.K., Chang, H.C. et al. (2014). Labeling of neuronal differentiation and neuron cells with biocompatible fluorescent nanodiamonds. Sci Rep 4: 5004.
- 24 Slegerova, J., Hajek, M., Rehor, I. et al. (2015). Designing the nanobiointerface of fluorescent nanodiamonds: highly selective targeting of glioma cancer cells. Nanoscale 7: 415–420.
- 25 Sotoma, S., Iimura, J., Igarashi, R. et al. (2016). Selective labeling of proteins on living cell membranes using fluorescent nanodiamond probes. Nanomaterials 6: 56.
- 26 Liu, K.K., Qiu, W.R., Raj, E.N. et al. (2017). Ubiquitin‐coated nanodiamonds bind to autophagy receptors for entry into the selective autophagy pathway. Autophagy 13: 187–200.
- 27 Prabhakar, N., Khan, M.H., Peurla, M. et al. (2017). Intracellular trafficking of fluorescent nanodiamonds and regulation of their cellular toxicity. ACS Omega 2: 2689–2693.
- 28 Suarez‐Kelly, L.P., Campbell, A.R., Rampersaud, I.V. et al. (2017). Fluorescent nanodiamonds engage innate immune effector cells: a potential vehicle for targeted anti‐tumor immunotherapy. Nanomedicine 13: 909–920.
- 29 Wu, T.J., Tzeng, Y.K., Chang, W.W. et al. (2013). Tracking the engraftment and regenerative capabilities of transplanted lung stem cells using fluorescent nanodiamonds. Nat Nanotechnol 8: 682–689.
- 30 Huang, Y.A., Kao, C.W., Liu, K.K. et al. (2014). The effect of fluorescent nanodiamonds on neuronal survival and morphogenesis. Sci Rep 4: 6919.
- 31 Haziza, S., Mohan, N., Loe‐Mie, Y. et al. (2017). Fluorescent nanodiamond tracking reveals intraneuronal transport abnormalities induced by brain disease‐related genetic risk factors. Nat Nanotechnol 12: 322–328.
- 32 Su, L.J., Wu, M.H., Hui, Y.Y. et al. (2017). Fluorescent nanodiamonds enable quantitative tracking of human mesenchymal stem cells in miniature pigs. Sci Rep 7: 45607.
- 33 Edwards, D.F. and Philipp, H.R. (1985). Cubic carbon diamond. In: Handbook of Optical Constants of Solids (ed. E.D. Polik), 665–673. Academic Press.
- 34 Smith, B.R., Niebert, M., Plakhotnik, T., and Zvyagin, A.V. (2007). Transfection and imaging of diamond nanocrystals as scattering optical labels. J Lumin 127: 260–263.
- 35 Krueger, A. and Lang, D. (2012). Functionality is key: recent progress in the surface modification of nanodiamond. Adv Funct Mater 22: 890–906.
- 36 Pham, D.M., Epperla, C.P., Hsieh, C.L. et al. (2017). Glycosaminoglycans‐specific cell targeting and imaging using fluorescent nanodiamonds coated with viral envelope proteins. Anal Chem 89: 6527–6534.
- 37 Hsieh, F.J., Chen, Y.W., Huang, Y.K. et al. (2018). Correlative light‐electron microscopy of lipid‐encapsulated fluorescent nanodiamonds for nanometric localization of cell surface antigens. Anal Chem 90: 1566–1571.
- 38 Diamandis, E.P. and Christopoulos, T.K. (1991). The biotin‐(strept)avidin system: principles and applications in biotechnology. Clin Chem 37: 625–636.
- 39 Billinton, N. and Knight, A.W. (2001). Seeing the wood through the trees: a review of techniques for distinguishing green fluorescent protein from endogenous autofluorescence. Anal Biochem 291: 175–197.
- 40 Inoué, S. (2006). Foundations of confocal scanned imaging in light microscopy. In: Handbook of Biological Confocal Microscopy, 3e (ed. J.B. Pawley), 1–19. Springer.
- 41 Axelrod, D. (2008). Total internal reflection fluorescence microscopy. Method Cell Biol 89: 169–221.
- 42 Gracie, J.A., Robertson, S.E., and McInnes, I.B. (2003). Interleukin‐18. J Leukoc Biol 73: 213–224.
- 43 Watanabe, S., Mizukami, S., Hori, Y., and Kikuchi, K. (2010). Multicolor protein labeling in living cells using mutant β‐lactamase‐tag technology. Bioconjug Chem 21: 2320–2326.
- 44 Xu, C., Zipfel, W., Shear, J.B. et al. (1996). Multiphoton fluorescence excitation: new spectral windows for biological nonlinear microscopy. Proc Natl Acad Sci USA 93: 10763–10768.
- 45 Helmchen, F. and Denk, W. (2005). Deep tissue two‐photon microscopy. Nat Methods 2: 932–940.
- 46 Wee, T.L., Tzeng, Y.K., Han, C.C. et al. (2007). Two‐photon excited fluorescence of nitrogen‐vacancy centers in proton‐irradiated type Ib diamond. J Phys Chem A 111: 9379–9386.
- 47 Ivanov, I.P., Li, X., Dolan, P.R., and Gu, M. (2013). Nonlinear absorption properties of the charge states of nitrogen‐vacancy centers in nanodiamonds. Opt Lett 38: 1358–1360.
- 48 Su, L.J., Fang, C.Y., Chang, Y.T. et al. (2013). Creation of high density ensembles of nitrogen‐vacancy centers in nitrogen‐rich type Ib nanodiamonds. Nanotechnology 24: 315702.
- 49 Hui, Y.Y., Zhang, B.L., Chang, Y.C. et al. (2010). Two‐photon fluorescence correlation spectroscopy of lipid‐encapsulated fluorescent nanodiamonds in living cells. Opt Express 18: 5896–5905.
- 50 Chang, C.W., Sud, D., and Mycek, M.A. (2007). Fluorescence lifetime imaging microscopy. Method Cell Biol 81: 495–524.
- 51 Beveratos, A., Brouri, R., Gacoin, T. et al. (2001). Nonclassical radiation from diamond nanocrystals. Phys Rev A 64: 061802.
- 52 Storteboom, J., Dolan, P., Castelletto, S. et al. (2015). Lifetime investigation of single nitrogen vacancy centres in nanodiamonds. Opt Express 23: 11327–11333.
- 53 Kuo, Y., Hsu, T.Y., Wu, Y.C. et al. (2013). Fluorescence lifetime imaging microscopy of nanodiamonds in vivo. Proc SPIE 8635: 863503.
- 54 Jin, D., Piper, J.A., Leif, R.C. et al. (2009). Time‐gated flow cytometry: an ultra‐high selectivity method to recover ultra‐rare‐event μ‐targets in high‐background biosamples. J Biomed Opt 14: 024023.