14
Diamonds in the Sky
Ever wondered where to look for nanodiamonds (NDs) in nature? Perhaps a more relevant question is: Do they even exist in natural environment? After all, NDs are very tiny and could be exceedingly difficult to find. For example, in order to make up a thickness of a single‐strand human hair, one would need to weave 1000 NDs side‐by‐side, let alone produce a size of a half‐carat diamond (as on a humble wedding ring) that would need a mound of 30 trillion (3 × 10¹³) NDs. While diamonds appear to be extremely rare on the earth surface (Section 2.3), who would have ever thought that in dark skies over the far deep space, there just might be abundant NDs present on stars and nebulas enough to light up the skies throughout an entire galaxy? How did scientists find it? This is the story of unidentified infrared (UIR) emission and extended red emission (ERE) of stardust [1].
14.1 Unidentified Infrared Emission
Carbon is the fourth most abundant element in the Galaxy. The possible presence of this element as diamond in space was first proposed by Saslaw and Gaustad [2] in 1969 to account for the observed interstellar extinction curves in the far ultraviolet (UV) region of galactic radiation. Little, if any, attention was paid to this hypothesis until 1987 when Lewis et al. [3] reported the discovery of small diamond grains in primitive meteorites from outside of the solar system (Section 2.4). These diamond grains have an average size of approximately 3 nm in diameter with a concentration as high as 1400 ppm in carbonaceous meteorites (Table 14.1) [4]. It turns out that NDs are the most abundant presolar grains in primitive meteorites and, therefore, are expected to be an abundant component of the stardust in the interstellar medium as well. But how can one find diamonds in cosmic medium? Traditionally, scientists have relied on optical methods to study cosmic objects, for instance, by using telescopes to map their surface landscape and emission spectra. Then, what are the spectroscopic signatures that may cast light on the composition of these interstellar grains?
Table 14.1 Types, abundances, and sizes of stardust in meteorites.
Source: From Ref. [4].
| Mineral | Abundance (ppm) | Size (μm) |
| Diamond | 1400 | 0.002 |
| SiC | 30 | 0.3–50 |
| Graphite | 10 | 1–20 |
| Si3N4 | 0.002 | ≤1 |
| Oxides | 50 | 0.1–2 |
| Silicates | 200 | ≤1 |
The search for diamonds in the interstellar medium by spectroscopic means was actively pursued in the 1990s [5–8]. Allamandola et al. [5, 6] made one of the first attempts to identify diamond dusts in dense molecular clouds based upon the broad infrared (IR) absorption band centered around 2880 cm−1 (or 3.47 μm). Zooming into the microscale, Hill et al. [7] conducted laboratory studies of the IR absorption bands of NDs extracted from Orgueil meteorites. However, no satisfactory matches were found between the astronomical and laboratory spectra. Alternatively, one may try to find NDs in space by examining the IR emission bands from galactic nebulae and circumstellar medium. In doing so, the emission from the HD 97048 star caught scientists’ attention. The emission spectrum of the star exhibited two prominent features at 3.43 and 3.53 μm, distinct from other astronomical bands (Figure 14.1). In a study of the nature of the emission from HD 97048 and Elias 1, Schutte et al. [9] noticed several anomalies in the observations. First, these two emission bands could be detected only under very special conditions (e.g. close to a hot stellar source). Second, the spatial variation of the emission intensities was fairly independent of other emission bands in the same frequency region. Third, both bands always appeared together, suggesting a spectral correlation between the two. An assignment of these emission bands was proposed by the astronomers to be the C–C overtones and some combination bands of highly excited large polycyclic aromatic hydrocarbon (PAH) molecules [9]. However, the assignment did not seem to present a satisfactory interpretation for the origin of these UIR emission bands.

Figure 14.1 Comparison of the 3.43‐ and 3.53‐μm emission bands of HD 97048 to a number of other astronomical features.
Source: Reprinted with permission from Ref. [9].
In about the same time and without the knowledge of UIR, Chang and coworkers [10] studied the IR spectroscopy and vibrational relaxation dynamics of CHx (x = 1–3) on diamond nanocrystal and single‐crystal surfaces. Three types of single crystals were used, including C(100), C(110), and C(111) (cf., Figure 14.2a for the hydrogenated C(111) surface). The study was aimed at elucidating the formation mechanism of diamonds by chemical vapor deposition (CVD) where atomic hydrogen plays a crucial role (Section 2.3.2) [11]. With a microwave reactor to produce pure hydrogen plasmas, the research team hydrogenated diamond thin films consisting of 100 nm particles of irregular sizes and shapes (Figure 14.2b), and obtained their absorption spectra at 3–5 μm with a Fourier transform infrared spectrometer. Surprisingly sharp absorption features were observed at 2835 and 2920 cm−1 (equivalent to 3.53 and 3.42 μm), respectively (Figure 14.2c), which were later confirmed by single crystal experiments to originate from the CH stretches of H‐covered {111} and {100} facets [12, 13]. The appearance of these two prominent absorption features for the hydrogenated NDs was accounted for by the unique H‐etching anisotropy of the diamond substrate [13–15]. Further studies of the thermal effect on the CH stretching vibrations showed a band shift of approximately 5 cm−1 to the red when the sample temperature was raised from 300 to 1000 K (Figure 14.3) [16].

Figure 14.2 (a) Structure of a hydrogenated diamond C(111) surface. Gray spheres denote carbon atoms and white spheres denote hydrogen atoms. (b) Scanning electron microscopy image of gravel‐like diamond nanocrystals used in the laboratory studies. (c) Laboratory absorption spectra of hydrogenated ND films prepared in different thickness (1 and 8 μm) and treated at different microwave plasma temperatures (1000 and 1300 K). The spectra were acquired at 300 K.
Source: Adapted with permission from Ref. [10]. Reproduced with permission of American Chemical Society.
Figure 14.3 Temperature‐dependent shifts of the absorption bands of the CH stretching vibrations on {100} and {111} facets of hydrogenated NDs.
Source: Adapted with permission from Ref. [16]. Reproduced with permission of AIP Publishing LLC.
In 1997, Geballe [17] provided a high‐quality IR emission spectrum of Elias 1 in the Taurus dark cloud from a ground‐based observation. In this emission spectrum as shown in Figure 14.4, the spectral feature at 2830 cm−1 (3.53 μm) was much better resolved than before, with a full width at half maximum of 11 cm−1. The characteristic of this anomalous IR emission band was also confirmed by the spectra of the same object taken by the short‐wavelength spectrometer on board of the Infrared Space Observatory [17]. Two years later, Guillois et al. [8] pointed out a nearly perfect match between the emission spectra taken from Elias 1 (and also HD 97048) and the absorption bands of CH stretches on hydrogenated ND surfaces (Figure 14.4), claiming “Here we report what we think to be the first unambiguous evidence of the presence of small crystallites of diamond in the dusty envelopes surrounding stars.” The claim was supported by further laboratory studies [12, 13, 16]. Based on the spectral redshift of 5 cm−1 for the CH stretching vibrations, a temperature of 1000 K was estimated for these circumstellar NDs. The research team also made careful energy considerations to understand the nature of the IR emission process [8, 18].
Figure 14.4 Comparison between the infrared emission spectrum of Elias 1 (green) and the laboratory absorption spectrum (red) of hydrogenated NDs measured at 300 K. Note that the absorption spectrum is redshifted by 5 cm−1 in comparison.
Source: Adapted with permission from Ref. [8].
One may ask: How can the circumstellar NDs display such distinct vibrational features? It is perceivable that diamond grains may be formed and situated in a close proximity to the star, from which they are exposed to intense UV photon fluxes, thus reaching high temperatures. The high temperature and high hydrogen‐flux conditions resemble that of the microwave plasma used in the CVD diamond synthesis. Conceivably, the temperatures of these two cosmic environments are sufficiently high to allow hydrogenation and H‐etching of the ND surfaces to occur. The suggestion is independently supported by the observations of H recombination lines in both Elias 1 and HD 97048 [19].
Another useful piece of information provided by the observations is the size of the UIR carriers. The information can be deduced from the findings that the 3.53 μm band coincides with the stretching resonance of the CH monolayer on the C(111) single‐crystal surface [12], in addition to its width (full widths at half maximum of ~6 cm−1). Therefore, these NDs cannot be too small since a large heterogeneously broadened width would have been resulted for the CH stretches on the nanometer‐sized H‐covered {111} facets [20]. Analysis of the IR absorption spectra of meteoritic NDs (~3 nm in diameter) [21] and a series of synthetic diamonds (5–700 nm in diameter) [22] has shown that the sharp 3.53‐μm band can emerge only when particles have an average size of 25 nm or greater. This derived size is quite different from that of the ND dust in meteorites (Table 14.1), suggesting that these diamond nanoparticles must have been formed in space through different mechanisms [21].
Figure 14.4 represents, arguably, the best agreement ever obtained between laboratory spectra of a solid‐state candidate and astronomical features. Taking advantage of the brightness of the IR emissions, Habart et al. [23] and Goto et al. [24] have been able to acquire spatially resolved spectra of the 3 μm bands at HD 97048 and Elias 1, respectively. Compared to the PAH emission, the diamond emission is more centrally concentrated. It should be noted here that the CH stretching vibrations are the only distinct spectral features that can be clearly identified so far based on the IR emission spectra of NDs. The corresponding CH bending vibrations cannot be found in the 6–7 μm range [25] because of the weakness of the absorption and, possibly, the severe band broadening resulting from its coupling with diamond surface phonons resonant in the same frequency region. The absence of this spectral feature stands as a sharp contrast to the prominence of the CH bending of PAHs [26], representing another unique characteristic of the H‐terminated NDs.
The remarkable matching in the peak positions, bandwidths, and profiles of the two 3.43‐ and 3.53‐μm features between laboratory and astronomical spectra provides a strong evidence for the existence of NDs in the circumstellar medium. Started as a long‐standing mystery [27], the UIR emission bands may very well have originated from hydrogenated diamond nanoparticles formed in astronomical environments rich in energetic hydrogen atoms, a condition similar to that of CVD diamond synthesis in the laboratories. It seems amazing that a fundamental study of hydrogen chemistry on diamond surfaces can lead to the discovery of diamonds in the sky.
14.2 Extended Red Emission
In space’s dustiest places, there exists a faint, rose‐colored glow called ERE [28]. This kind of light has been found in a wide range of astronomical environments including reflection nebulae, planetary nebulae, emission nebulae, and the diffuse interstellar medium of our galaxy. So, what seems to have caused this odd cosmic light?
A nebula, in all shapes and sizes, is an interstellar cloud consisting of dust, hydrogen, helium, and other ionized gases. ERE was first detected by Cohen et al. [29] in 1975 for a planetary nebula located in the constellation of Monoceros roughly 2300 light years from Earth. The nebula has a red color and a characteristic rectangular shape surrounding the star HD 44179 and called, rightfully, the Red Rectangle (Figure 14.5) [30]. A broad emission band in the wavelength range of 500–900 nm appears in the areas of abundant UV light [31], suggesting that the ERE process may be associated with high‐energy photons striking on solid materials. The emission could be thought of as in an office‐used fluorescent lamp, where the discharged UV light strikes on a thin film of coating materials inside the lamp’s tube, the materials in turn emitting visible light. Proposed models for the materials (also known as the ERE carriers) include hydrogenated amorphous carbons [32], PAHs [33], and silicon nanoparticles [34, 35].
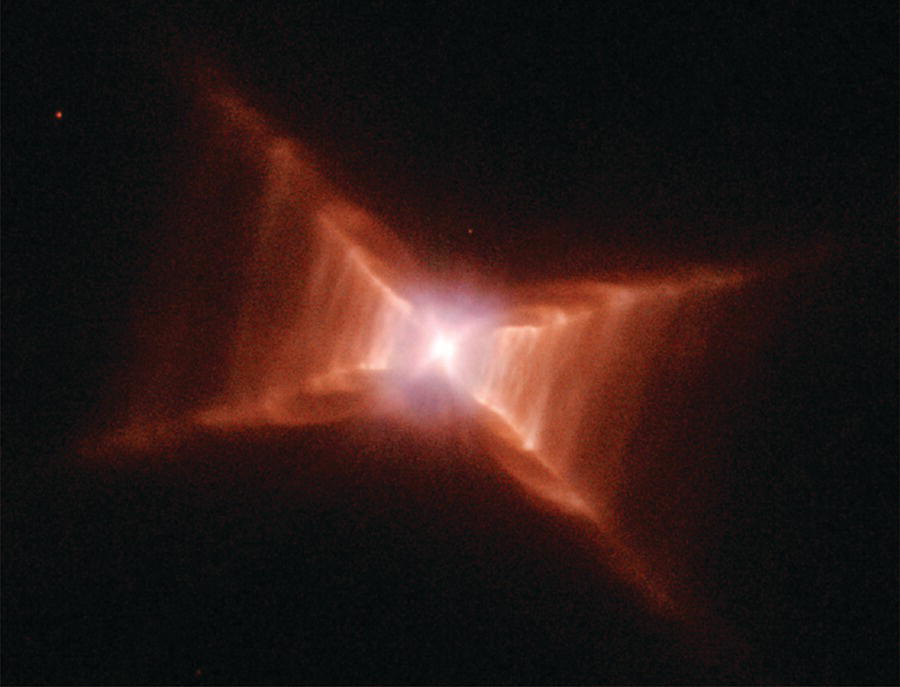
Figure 14.5 The proto‐planetary nebula HD 44179 (also called the “Red Rectangle”) in the constellation of Monoceros. This picture was obtained with the Hubble Space Telescope (courtesy of Hans Van Winckel, Martin Cohen, NASA, and ESA).
Source: Reprinted with permission from Ref. [30].
Witt and Vijh [28], after compiling decades of research, concluded a total of 13 conditions that must be fulfilled by any candidate to be considered a credible ERE carrier (Table 14.2). No association of ERE with diamonds was made before year 2000 except that of Duley [36] who proposed that the sharp emission lines observed around 580 nm in the Red Rectangle spectra might have originated from the electronic transitions of structural defects similar to those found in the terrestrial diamonds. In 2006, Chang and coworkers [37] proposed that the nitrogen‐vacancy (NV) centers in NDs could be a possible carrier of the ERE bands because the physicochemical properties of this carbon‐based nanomaterial matched exactly the first four of the 13 conditions set out by Witt and Vijh [28]. Additionally, in later studies [38, 39], the photoluminescence spectra of the NV centers were shown to share multiple similarities with the ERE bands as discussed below.
Table 14.2 Characteristics of extended red emission and its carrier.
Source: From Ref. [28].
|
In their 2006 work, Chang et al. [37] produced carbon atom vacancies in type Ib NDs by repeatedly bombarding the particles with 3‐MeV protons in a vacuum to simulate what might have occurred in the interstellar medium. The radiation‐damaged NDs were then annealed at 800 °C to form fluorescent nanodiamonds (FNDs) (~100 nm in diameter). As discussed in Section 3.3.2, there are two types of NV centers in FNDs produced in this manner, NV0 and NV−, and they are characterized by the sharp zero‐phonon lines at 575 and 637 nm, respectively (Table 3.2). The intensity ratio is close to NV0 : NV− = 1 : 3 under continuous laser excitation over the wavelength range of 450–610 nm at the steady state. Despite that the peak wavelength may vary between 610 and 690 nm (Figure 3.5), depending on the wavelength of excitation, the observed photoluminescence spectra are all ERE‐like [39].
Figure 14.6a presents a picture of the planetary nebula NGC 7027 in the constellation of Cygnus, obtained by the Hubble Space Telescope [40]. Compared with the ERE band observed for this nebula [41], the laboratory spectrum obtained by excitation of FNDs at 510–560 nm shares a close resemblance (Figure 14.6b), leading Chang et al. [37] to hypothesize that FNDs may be responsible for the red emission. The hypothesis is supported by the facts that NGC 7027 is rich in carbon [42] and, additionally, nitrogen atoms are abundant in the universe and they can be readily incorporated into the diamond lattice as impurities during circumstellar condensation. Therefore, as vacancies in diamonds are created in the laboratory by high‐energy proton irradiation under vacuum, the similar defective diamond nanoparticles can potentially form in the astronomical environments where the ERE bands have been observed.

Figure 14.6 (a) The planetary nebula NGC 7027 in the constellation of Cygnus. This picture was obtained with the Hubble Space Telescope (Courtesy of William B. Latter, NASA, and ESA).
Source: Reprinted with permission from Ref. [40].
(b) Comparison between the observed ERE spectrum of NGC 7027 and the laboratory fluorescence spectrum of FND excited with 510–560 nm light.
Source: Reprinted with permission from Ref. [38].
While FNDs meet many of the conditions listed in Table 14.2, a major concern of the above proposal is that the photoluminescence is produced by excitation of the particles with visible light (500–600 nm), rather than UV photons with energies in excess of 7.25 eV (or equivalent to 171 nm), listed as item 8 in the table. To address this issue, Lu et al. [39] have recently conducted experiments with radiation from a synchrotron source in the wavelength range of 125–350 nm. No emission was observed between 300 and 500 nm under far‐UV excitation such as at 170 nm (cf., item 9 in Table 14.2). However, much to their surprise, the photoluminescence spectra were dominated by the NV0 emission, in sharp contrast to the excitation with visible photons, where the emission of NV− prevailed (Figure 14.7). The result was attributed to the photoionization of NV− to NV0 due to the interband excitation, i.e. the excitation of electrons from the valence band to the conduction band, by the far‐UV photons. The energy released from the electron–hole recombination after excitation was sufficient to ionize the negatively charged defects to form electronically excited NV0 centers, which subsequently relaxed to the ground state by emitting red photons as in the cases of cathodoluminescence (Section 10.3). Assuming that both far‐UV and optical photons were involved in the excitation process [43], the researchers were able to reproduce successfully the ERE band observed in NGC 7023, a bright reflection nebula in the constellation Cepheus (Figure 14.8a) [44], by linearly combining the photoluminescence spectra of both NV0 and NV− centers with an intensity ratio of 1 : 2 (Figure 14.8b).
Figure 14.7 Emission spectra of FNDs excited with 170‐ and 532‐nm light at 300 K. The spectra were obtained for the same sample. Note the occurrence of photoionization, which converts NV− to NV0 under far‐UV excitation.
Source: Reprinted with permission from Ref. [39]. Reproduced with permission of John Wiley & Sons.

Figure 14.8 (a) The reflection nebula NGC 7023 in the constellation of Cepheus. This picture was obtained with the Hubble Space Telescope (Courtesy of NASA and ESA).
Source: Reprinted with permission from Ref. [44].
(b) Comparison of a laboratory photoluminescence spectrum and the ERE band from NGC 7023. The ERE band was obtained on dividing the nebular spectrum by the spectrum of the illuminating star. The sharp features denoted with asterisks result from incomplete cancellation of night‐sky and nebular emission bands. The laboratory spectra were synthesized by combining the photoluminescence signals of NV0 and NV− with (green) or without (red) corrections for the interstellar reddening effect.
Source: Reprinted with permission from Ref. [39]. Reproduced with permission of John Wiley & Sons.
Going one step further, Lu et al. [39] set out to measure the quantum yield (Φ) of the emission under UV excitation. Instead of using FNDs, they recorded the photoluminescence excitation spectra of fluorescent microdiamonds (FMDs, diameter ~400 μm) by scanning the excitation energy over 125–675 nm and monitoring the resulting emission signals at 683 nm. The reasons to use micron‐sized particles were to avoid the light‐scattering problem of FNDs and to ensure that the exciting photons were completely absorbed by the substrate. From an observation of the photoluminescence signals in both intracenter and interband excitation regions, they were able to obtain a quantitative measure for the quantum yield at 170 nm by referring to the well‐documented value of Φ ≈ 99% at 532 nm for the NV− centers (Table 3.2). An overall quantum yield of Φ ≥ 20% was determined for both FMDs and FNDs, in agreement with the specific characteristic of ERE (cf., item 10 in Table 14.2).
We now turn to the long‐standing mystery of the Red Rectangle, which is a nebula‐emitting ERE with exceptional strength. The high quality of the spectra allows for a stringent test of the theory involving FND as a possible ERE carrier. A notable feature of the Red Rectangle is that the spectral profile of the ERE band varies substantially with distance from the central star HD 44179. Figure 14.9 shows two spectra taken at the angular distances of 6 and 10 arcsec (6″ and 10″) south, respectively. The peak position of the ERE band shifts from 635 to 660 nm as the distance moves from 10″ south at 6″ south, respectively, within the same object [45, 46]. To understand the shifts, Chang [38] modeled the ERE spectra using the experimental data of NV0 and NV− emissions with different intensity ratios and was able to properly reproduce the astronomical observations at these two offset distances, as shown in Figure 14.9. The result seems to indicate an intriguing particle size effect, that is, the ERE‐emitting FNDs at 10″ are smaller than those at 6″. The conclusion is supported by the laboratory studies of FNDs over the size range of 10–100 nm that the NV0 centers prefer to form in smaller diamond nanoparticles than NV− due to the surface‐induced charge state conversion between these two types of structural defects (Section 3.3.2) [47]. It is also in line with the common knowledge that particles of smaller size can be blown away more easily than the larger ones from the illuminating star by radiation pressure [48].

Figure 14.9 Comparison between the observed ERE spectra of the Red Rectangle at 10″ south and 6″ south of HD 44179 and the laboratory fluorescence spectra of FNDs with different contents of NV0 and NV−. The fluorescence intensity ratios of NV0 : NV− in samples FND1 and FND2 are roughly 3 : 2 and 1 : 0, respectively.
Source: Reprinted with permission from Ref. [38].
The diamond model can also account for the absence of blue and green photoluminescence in the interstellar medium. As discussed in Section 3.3.3, the observation of the blue and green emissions requires nitrogen impurities to be present as aggregates in the diamond lattice (e.g. H3 and N3 in Table 3.2). However, it is known that the time period required for single substitutional nitrogen atoms to form aggregates in diamond is about 109 years at 1200 °C [49]. This condition, clearly, cannot be readily realized in the interstellar or even circumstellar medium. With this simple model, one can additionally attribute the weakness of the ERE bands at the wavelength greater than 900 nm to the small photoluminescence quantum yield (~1.4%) of the V0 centers even at low temperature (Table 3.2). No evidence has yet be discovered for the association of ERE with molecular ions like C60+, which shows a prominent absorption band at 957.7 nm [50]. Further discussion of the diamond‐based ERE model can be found in Ref. [39].
14.3 Cosmic Events at Home on Earth
Following the mysteries in outer space, as we gaze down on earth, we cannot help wondering if what could happen in skies might just be possible on earth. Granted that we do not have red skies hanging over our heads (good heavens!), but are there stories about NDs on the planet earth that are related to the cosmic events? Where can we find natural NDs on earth, perhaps, after the massive impacts by comets or asteroids? It turns out not only natural NDs are present on earth but they also have been used as a marker for identifying cosmic events, as told in the story of the Younger Dryas event.
There were major geological periods throughout history of our planet that have been identified to have widespread effects globally and long‐lasting devastations. The most recent one of such major events, also the most well‐known by popular culture, is the Cretaceous‐Paleogene (K‐Pg, also called Cretaceous‐Tertiary) extinction event some 66 million calendar years before the present time (cal BP) that had wiped out an estimate of more than 75% living creatures from earth, including the dinosaurs. Originally thought as caused by volcanism and marine regression, it is now broadly accepted that the K‐Pg extinction was a result of extraterrestrial impact. In 1980, Luis Alvarez (1968 Nobel laureate in Physics) and his research team discovered, among soot and other glassy spherules typically formed at combustion temperatures, an unusually high content of the rare element iridium (Ir, atomic number 77) in the K‐Pg layer of the sediment samples collected from all over the world [51]. Iridium binds nicely with iron; therefore, any iridium present at the time of earth crust formation would have been transported to the earth core with iron, leaving only a trace amount on the earth surface. On the other hand, extraterrestrial comets and asteroids typically show a high level of iridium content that can prevail upon the impact on earth. Therefore, Alvarez’s finding of the high iridium content was a clear evidence linked directly to a cosmic impact.
A proposed hypothesis nonconventional as such is bound to invite public scrutiny and met by widespread suspicions and, indeed, it was. After all, it is hard to imagine a rock falling from sky would have wiped out the entire species of dinosaurs, the largest and strongest animals on the surface of earth at the time, reshuffling the entire hierarchy of inhabitant species on the planet that forever changed the course of earth evolution. Then, in 1990, two years after the death of Alvarez, a breakthrough came from the discovery of the giant Chicxulub crater mostly buried under the coast of the Yucatan Peninsula in Mexico. The crater is in an oval shape with an average diameter of 110 mi, about half of it in the ocean, which is believed to be created by an extraterrestrial impactor of a size estimated 6–9 mi in diameter. The finding of the impact site and its geological location, a region of sulfur‐rich carbonate rocks, poses strong potential for massive deposit of sulfuric acid in the earth’s atmosphere followed possibly by large‐scale acid rain, providing undisputable support for the hypothesis of a cosmic impact. In 2010, a panel consisting of 41 scientists worldwide reviewed all reported findings in the past 20 years on the K‐Pg event and concluded that it was indeed a cosmic impact of a collisional energy roughly about one million times greater than the energy released by the atomic bombs dropped at Hiroshima and Nagasaki in World War II.
So, what is all this to do with NDs? This brings us to the Younger Dryas event. The landmark geological drills of the Greenland Ice Sheet Project, GISP (1979–1981) and GISP2 (1988–1993), have produced ice cores ranging from 2000 to 3000 m in depth with diameters of 10–15 cm that contain remarkable geologically rich information of earth history. One of the data derived from these ice cores is the annual average temperature on earth that can be traced millions years back. In general, the earth’s temperature fluctuates from year to year, normally in a tiny fraction of a degree Celsius, and oscillates cumulatively in geological scale between warming and cooling trends from one period to another. The present period, Holocene, is an interstadial and therefore we are in a warming phase. The stadial, a cooling phase, right before Holocene is the Younger Dryas dated from 12 900 to 11 700 cal BP, when the earth’s temperature dropped by 2–6 °C mainly in the northern hemisphere. An abrupt climate change was identified in this geological period that, in large parts of Europe, the warmer climate vegetation was replaced by the colder weather vegetation including the Dryas octopetala, which was once abundant by the Scandinavian lakes during the glacial period. This is where the Younger Dryas (YD) got its name from, along with the other members in the family: the Older Dryas and Oldest Dryas occurring around 14 000 and 15 070 cal BP, respectively. Incidentally, the study of human evolution has documented that Homo sapiens, modern human species, have been around since 250 000 cal BP.
Devastated mass extinction occurred as the climate changed in this more than 1000 year‐long YD period. An estimated of at least 35 mammal genera disappeared from North America alone, including megafauna (e.g. mammoths), camels, horses, mastodons, and many species of small mammals and birds; marking the end of the Pleistocene period (2 588 000–11 700 cal BP). As a result, the ecosystems in the American and Eurasian continents were significantly changed, which was clearly reflected in, for example, the sharp decline of the Paleo‐Americans population and the shift in the Clovis culture to better adapt in the drastically altered environment. In a way, these changes, dramatic as it might have seemed, actually shaped up the landscape of our natural resources and environment today.
An immediate question now is: What may have been the cause(s) that triggered the sudden climate changes of YD?
The geologists have speculated that the causes for the temperature decline was because of the dramatic reduction or shutdown of the circulation in atmosphere that used to carry warm vapor from tropical oceans to North Atlantic. But, why? What would have caused the shutdown? There are hypotheses (more speculations?) of volcano eruptions, wildfires, or meteorite debris among others that were responsible for causing the climate change. But, none of the proposed theories seems to offer satisfactory explanations nor is there geological evidence to support the speculations. In 2007, representing a team of 26 scientists from 16 research groups, Firestone [52] reported to the National Academy of Science in America a body of carefully studied evidence that seemed to support a hypothesis citing extraterrestrial impact as the trigger of YD cooling period. In the paper, the research team presented analysis of the samples collected from 10 Clovis‐age sites well documented and dated with clear YD boundary (YDB), a thin layer (usually about 5 cm or less) of sediment that had been identified as the onset of YD directly beneath the darkened soil (called black mat) during the YD cooling period. The analysis using modern instrumentation covered all unique substances (so‐called the YD event markers) discovered in the YDB consisting of (i) magnetic microspherules and grains, (ii) iridium and nickel, (iii) charcoal, (iv) soot and PAHs, (v) carbon spherules, (vi) fullerenes and extraterrestrial helium, and (vii) glass‐like carbon. Collectively, the analysis results provided a strong support for the hypothesis that the onset of YD was caused by extraterrestrial airburst or impact on earth.
The arguments for a cosmic impact, regardless how credible the evidence seemed to have suggested, were immediately challenged by the opponents of the impact theory. The weakest point of the defense by anyone who believes in the impact hypothesis was the lacking of the impact site. Many have speculated since then that, if a surface impact did happen, it would probably have landed somewhere around the Great Lakes in Michigan, though no craters have been found yet up to date. (Could it be sunken at the bottom of the Lakes?) The cause for YD remained a mystery and so was the cosmic impact theory.
A breakthrough finally came in 2014. In the year’s September issue of The Journal of Geology, the top story was an article based on a collective effort of 26 researchers from 21 universities in 6 countries reporting the details of evidences supporting the cosmic impact hypothesis [53]. And, the key evidence was, yes, our very own NDs! In addition to the seven burning proxies analyzed in Firestone’s paper previously, the 2014 team discovered a rich content of NDs in the YDB layer, not above nor below the layer, but only within YDB. Therefore, NDs were likely formed at the onset of YD and may very well be related to the causes of the long cooling period. Multiple forms of NDs were found: cubic, lonsdaleite‐like crystal, n‐diamonds, and i'carbon nanoparticles. Furthermore, these NDs were identified to be terrestrial, i.e. carbons originally on earth turned into NDs only after experiencing the changes involving extreme conditions such as high‐energy impact. The research team carefully compared the experimental conditions used in today’s laboratories for manufacturing NDs, both detonation and HPHT NDs, and ruled out possibilities of wildfires and lightening, the two frequently thought causes. The team further compared the samples obtained from the K‐Pg sites and other known impact sites, all showing rich ND contents. A close look into the K‐Pg sites led the research team to find that NDs only existed in the boundary layer, not the layer above or below, exactly the same as that of NDs in YDB. The structures of NDs produced at the K‐Pg impact appeared to be identical to the NDs in YDB but with a less variety, probably due to the significant difference in the impact energy. The 2014 paper also investigated all other potential causes of the YD cooling brought forward by scientists, including volcanism, sclerotia, and anthropogenic activities, and ruled out all of them. The final conclusion was that it must require a cosmic impact to meet the necessary conditions of exotic temperature and explosive pressure in order to form NDs at the onset of the YD period. NDs proved to be the defining evidence in closing the arguments to finally solving the long‐standing mystery of YD. Now the only thing left is to find the impact crater. Someday, perhaps.
As the writing of this book was about to complete, we learned a special documentary, The Day the Dinosaurs Died, was broadcasted by BBC Two on 15 May 2017 [54], reporting the current status on the cosmic impact theory of dinosaur’s extinction. In addition to the impact theory, described at the beginning of this section, the documentary also announced a two‐year Dinosaur crater drill project that had started in 2016 at approximately 19 mi off the shore of Mexico’s Yucatan Peninsula. The project was led by Professors Joanna Morgan of the Imperial College London and Sean Gulick of the University of Texas, who have drilled into the inner core of the impact crater 4300 ft beneath the Gulf of Mexico. They expected to piece up frame‐by‐frame a detailed timeline of the impact event by analyzing the content of the rock cores recovered from the drill, while the world is watching and waiting patiently.
References
- 1 Kwok, S. (2013). Stardust: The Cosmic Seeds of Life. Springer.
- 2 Saslaw, W.C. and Gaustad, J.E. (1969). Interstellar dust and diamonds. Nature 221: 160–162.
- 3 Lewis, R.S., Ming, Y., Wacker, J.F. et al. (1987). Interstellar diamonds in meteorites. Nature 326: 160–162.
- 4 Davis, A.M. (2011). Stardust in meteorites. Proc Natl Acad Sci USA 108: 19142–19146.
- 5 Allamandola, L.J., Sandford, S.A., Tielens, A.G.G.M., and Herbst, T.M. (1992). Infrared spectroscopy of dense clouds in the C‐H stretch region: methanol and “diamonds”. Astrophys J 399: 134–146.
- 6 Allamandola, L.J., Sandford, S.A., Tielens, A.G.G.M., and Herbst, T.M. (1993). Diamonds in dense molecular clouds: a challenge to the standard interstellar‐medium paradigm. Science 260: 64–66.
- 7 Hill, H.G.M., Jones, A.P., and d’Hendecourt, L.B. (1998). Diamonds in carbon‐rich proto‐planetary nebulae. Astron Astrophys 336: L41–L44.
- 8 Guillois, O., Ledoux, G., and Reynaud, C. (1999). Diamond infrared emission bands in circumstellar media. Astrophys J 521: L133–L136.
- 9 Schutte, W.A., Tielens, A.G.G.M., Allamandola, L.J. et al. (1990). The anomalous 3.43 and 3.53 μ emission features toward HD 97048 and Elias 1: C‐C vibrational modes of polycyclic aromatic hydrocarbons? Astrophys J 360: 577–589.
- 10 Chang, H.C., Lin, J.C., Wu, J.Y., and Chen, K.H. (1995). Infrared spectroscopy and vibrational relaxation of CHx and CDx stretches on synthetic diamond nanocrystal surfaces. J Phys Chem 99: 11081–11088.
- 11 Spear, K.E. and Frenklach, M. (1994). Mechanisms for CVD diamond growth. In: Synthetic Diamond: Emerging CVD Science and Technology (ed. K.E. Spear and J.P. Dismukes), 243–304. Wiley.
- 12 Cheng, C.L., Lin, J.C., Chang, H.C., and Wang, J.K. (1996). Characterization of CH stretches on diamond C(111) single‐ and nanocrystals by infrared absorption spectroscopy. J Chem Phys 105: 8977–8978.
- 13 Cheng, C.L., Chang, H.C., Lin, J.C. et al. (1997). Direct observation of hydrogen etching anisotropy on diamond single crystal surfaces. Phys Rev Lett 78: 3713–3716.
- 14 Stallcup, R.E. and Perez, J.M. (2001). Scanning tunneling microscopy studies of temperature‐dependent etching of diamond (100) by atomic hydrogen. Phys Rev Lett 86: 3368–3371.
- 15 Kuroshima, H., Makino, T., Yamasaki, S. et al. (2017). Mechanism of anisotropic etching on diamond (111) surfaces by a hydrogen plasma treatment. Appl Surf Sci 422: 452–455.
- 16 Lin, J.C., Chen, K.H., Chang, H.C. et al. (1996). The vibrational dephasing and relaxation of CH and CD stretches on diamond surfaces: an anomaly. J Chem Phys 105: 3975–3983.
- 17 Geballe, T.R. (1997). Spectroscopy of the unidentified infrared emission bands. In: From Stardust to Planetesimals, ASP Conference Series, vol. 122 (ed. Y.J. Pendleton), 119–128. San Francisco: ASP.
- 18 Guillois, O., Ledoux, G., Nenner, I. et al. (1998). Excitation processes for the emission of the unidentified IR bands. Faraday Discuss 109: 335–347.
- 19 Van Kerckhoven, C., Tielens, A.G.G.M., and Waelkens, C. (1999). The peculiar 3.43 and 3.53 μm emission features towards HD 97048 and Elias 1. In: The Universe as Seen by ISO, vol. 1 (ed. P. Cox and M.F. Kessler), 421–423. Noordwijk: ESA.
- 20 Chen, C.F., Wu, C.C., Cheng, C.L. et al. (2002). The size of interstellar nanodiamonds revealed by infrared spectra of CH on synthetic diamond nanocrystal surfaces. J Chem Phys 116: 1211–1214.
- 21 Jones, A.P., d’Hendecourt, L.B., Sheu, S.Y. et al. (2004). Surface C‐H stretching features on meteoritic nanodiamonds. Astron Astrophys 416: 235–241.
- 22 Sheu, S.Y., Lee, I.P., Lee, Y.T., and Chang, H.C. (2002). Laboratory investigations of hydrogenated diamond surfaces by infrared spectroscopy: implications for the formation and size of interstellar nanodiamonds. Astrophys J 581: L55–L58.
- 23 Habart, E., Testi, L., Natta, A., and Carbillet, M. (2004). Diamonds in HD 97048: a closer look. Astrophys J 614: L129–L132.
- 24 Goto, M., Th, H., Kouchi, A. et al. (2009). Spatially resolved 3 μm spectroscopy of Elias 1: origin of diamonds in protoplanetary disks. Astrophys J 693: 610–616.
- 25 Ando, T., Ishii, M., Kamo, M., and Sato, Y. (1993). Thermal hydrogenation of diamond surfaces studied by diffuse reflectance Fourier‐transform infrared, temperature‐programmed desorption and laser Raman spectroscopy. J Chem Soc Faraday Trans 89: 1783–1789.
- 26 Van Kerckhoven, C., Tielens, A.G.G.M., and Waelkens, C. (2002). Nanodiamonds around HD 97048 and Elias 1. Astron Astrophys 384: 568–584.
- 27 Joblin, C. (1998). Which carriers for the unidentified IR emission bands? Observations and laboratory simulations. Faraday Discuss 109: 349–360.
- 28 Witt, A.N. and Vijh, U.P. (2004). Extended red emission: photoluminescence by interstellar nanoparticles. ASP Conf Ser 309: 115–138.
- 29 Cohen, M., Anderson, C.M., Cowley, A. et al. (1975). The peculiar object HD 44179 (“The red rectangle”). Astrophys J 196: 179–189.
- 30 Van Winckel, H., Cohen, M., and NASA/ESA. (2004). The remarkable red rectangle: stairway to heaven? https://www.spacetelescope.org/images/heic0408a (accessed 16 April 2018).
- 31 Schmidt, G.D., Cohen, M., and Margon, B. (1980). Discovery of optical molecular emission from the bipolar nebula surrounding HD 44179. Astrophys J 239: L133–L138.
- 32 Duley, W.W. (1985). Evidence for hydrogenated amorphous carbon in the Red Rectangle. Mon Not R Astron Soc 215: 259–263.
- 33 d’Hendecourt, L.B., Leger, A., Olofsson, G., and Schmidt, W. (1986). The Red Rectangle: a possible case of visible luminescence from polycyclic aromatic hydrocarbons. Astron Astrophys 170: 91–96.
- 34 Ledoux, G., Ehbrecht, M., Guillois, O. et al. (1998). Silicon as a candidate carrier for ERE. Astron Astrophys 333: L39–L42.
- 35 Witt, A.N., Gordon, K.D., and Furton, D.G. (1998). Silicon nanoparticles: source of extended red emission? Astrophys J 501: L111–L115.
- 36 Duley, W.W. (1988). Sharp emission lines from diamond dust in the Red Rectangle? Astrophys Space Sci 150: 387–390.
- 37 Chang, H.C., Chen, K., and Kwok, S. (2006). Nanodiamond as a possible carrier for extended red emission. Astrophys J 639: L63–L66.
- 38 Chang, H.C. (2016). Diamonds in space: a brief history and recent laboratory studies. J Phys Conf Ser 728: 062004.
- 39 Lu, H.C., Peng, Y.C., Chou, S.L. et al. (2017). Far‐UV excited luminescence of nitrogen‐vacancy centers: evidence for diamonds in space. Angew Chem Int Ed 56: 14469–14473.
- 40 Latter, W.B. and NASA/ESA (1998). Planetary Nebula NGC 7027. https://www.spacetelescope.org/images/opo9811d (accessed 16 April 2018).
- 41 Furton, D.G. and Witt, A.N. (1990). The spatial distribution of extended red emission in the planetary nebula NGC 7027. Astrophys J 364: L45–L48.
- 42 Kwok, S. and Zhang, Y. (2011). Mixed aromatic‐aliphatic organic nanoparticles as carriers of unidentified infrared emission features. Nature 479: 80–83.
- 43 Witt, A.N., Gordon, K.D., Vijh, U.P. et al. (2006). The excitation of extended red emission: new constraints on its carrier from HST observations of NGC 7023. Astrophys J 636: 303–315.
- 44 NASA and ESA (2009). Blushing dusty nebula. https://www.spacetelescope.org/images/heic0915a (accessed 16 April 2018).
- 45 Witt, A.N. and Boroson, T.D. (1990). Spectroscopy of extended red emission in reflection nebulae. Astrophys J 355: 182–189.
- 46 Ledoux, G., Guillois, O., Huisken, F. et al. (2001). Crystalline silicon nanoparticles as carriers for the Extended Red Emission. Astron Astrophys 377: 707–720.
- 47 Rondin, L., Dantelle, G., Slablab, A. et al. (2010). Surface‐induced charge state conversion of nitrogen‐vacancy defects in nanodiamonds. Phys Rev B 82: 115449.
- 48 Halliday, D., Walker, J., and Resnick, R. (2010). Fundamentals of Physics, 5e. Wiley.
- 49 Evans, T. and Qi, Z. (1982). The kinetics of the aggregation of nitrogen atoms in diamond. Proc R Soc A 381: 159–178.
- 50 Maier, J.P. and Campbell, E.K. (2017). Fullerenes in space. Angew Chem Int Ed 56: 4920–4929.
- 51 Alvarez, L.W., Alvarez, W., Asaro, F., and Michel, H.V. (1980). Extraterrestrial cause for the cretaceous‐tertiary extinction. Science 208: 1095–1108.
- 52 Firestone, R.B., West, A., Kennett, J.P. et al. (2007). Evidence for an extraterrestrial impact 12 900 years ago that contributed to the megafaunal extinctions and the Younger Dryas cooling. Proc Natl Acad Sci USA 104: 16016–16021.
- 53 Kinzie, C.R., Que Hee, S.S., Stich, A. et al. (2014). Nanodiamond‐rich layer across three continents consistent with major cosmic impact at 12 800 Cal BP. J Geology 122: 475–506.
- 54 BBC Two (2017). The day the dinosaurs died. http://www.bbc.co.uk/programmes/b08r3xhf (accessed 16 April 2018).