7.6. COMPUTATION OF UNIFORM RESIDUAL STRESSES 157
w
1
w
2
w
3
w
4
w
5
w
6
w
7
w
8
w
9
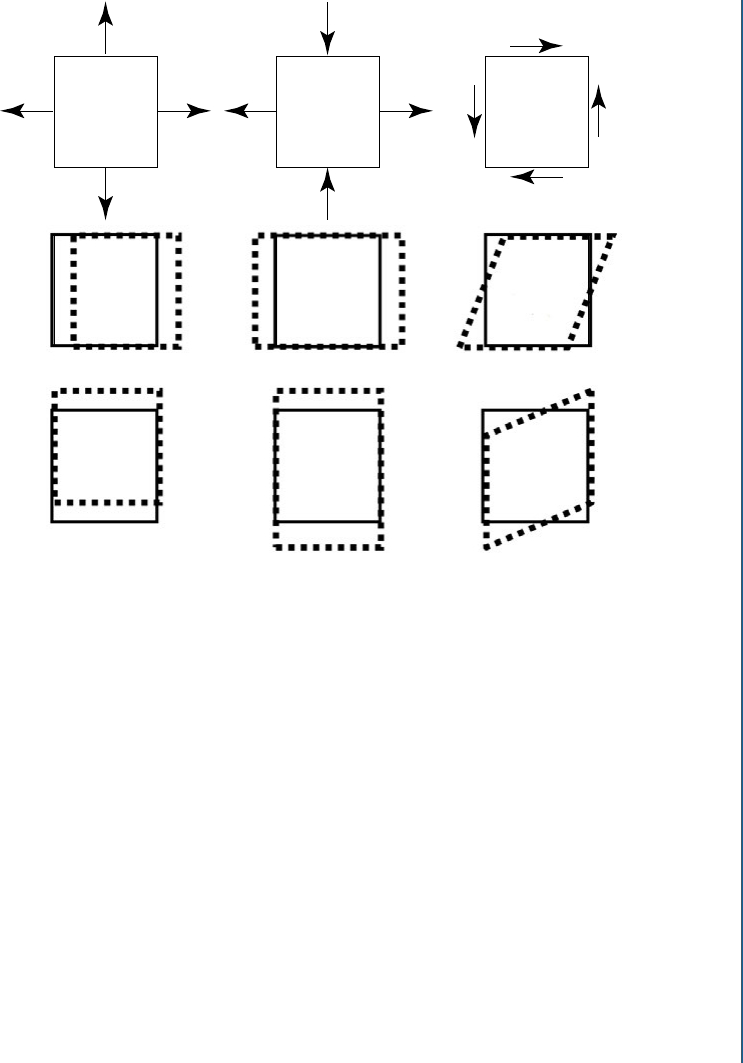
Figure 7.12: Schematic representation of the contributing factors to a 2-axis hole-drilling mea-
surement. 1 D P -stress, 2 D Q-stress, 3 D T -stress, 4 D x-displacement, 5 D x-stretch, 6 D x-
shear, 7 D y-displacement, 8 D y-stretch, and 9 D y-shear.
As can be seen, G has a sparse structure because the artifacts associated with w
4
, w
5
and
w
6
are connected only with the x-displacements and the artifacts associated with w
7
, w
8
and
w
9
are connected only with the y-displacements. Computational efficiency can be enhanced by
taking the sparsity structure of the 2-D matrix G into account so as to avoid handling the zero
elements. In addition, the elements in the lower half of the first three columns of G are the
same as those in the upper half, with the x and y coordinates interchanged. is corresponds to
reflecting the first three images in Figure 7.10 around a 45
ı
diagonal. Similarly, the contents of
the lower parts of the second three columns are the same as those in the upper parts of the third
three columns, again the x and y coordinates interchanged. Actually, providing the concept of
exchange of x and y coordinates is followed, the pixels in the upper half of G do not have to be
exactly those in the lower half, they don’t even need to be equal in total number. is feature
occurs because the solution depends on the combined behavior of many pixels, not the individual
behavior of specific pixels. is is a significant point when working with ESPI data, where the
second axis data comes from a different image than the first.
..................Content has been hidden....................
You can't read the all page of ebook, please click here login for view all page.