
14 Writing production code
- Validating feature data before attempting to use it for a model
- Monitoring features in production
- Monitoring all aspects of a production model life cycle
- Approaching projects with the goal of solving them in the simplest manner possible
- Defining a standard code architecture for ML projects
- Avoiding cargo cult behavior in ML
We spent the entirety of part 2 of this book on the more technician-focused aspects of building ML software. In this chapter, we’ll begin the journey of looking at ML project work from the eyes of an architect.
We’ll focus on the theory and philosophy of approaches to solving problems with ML from the highly interconnected, intensely complex, and altogether holistic view of how our profession functions. We’ll look at case studies of production ML (all based, in one way or another, on things that I’ve messed up or have seen others mess up) to give an insight into elements of ML development that aren’t frequently talked about. These are the lessons learned (usually the hard way) when we, as a profession, are more focused on the algorithmic aspects of solving problems, rather than where we should be focused:
- The data—How it’s generated, where it is, and what it fundamentally is
- The complexity—Of the solution and of the code
- The problem—How to solve it in the easiest way possible
As we discussed in previous chapters, the goal of DS work is not merely in utilizing algorithms. It’s not in a framework, a toolkit, or a particular model infrastructure that seems increasingly hot or popular.
Note DS work should be solely focused on solving problems, using data, and applying the scientific method to our approach to ensure that we’re solving them in the best way based on the data that we have available.
With this focus in mind, we’re going to look at aspects of production development in the real world, specifically some uniquely destructive aspects of building solutions that might not seem obvious to the starry-eyed algorithm-focused practitioners who haven’t been burned enough by poorly implemented solutions. Everyone who works in this profession long enough will learn these lessons, one way or another. The sooner you can learn from someone else’s mistakes, the less of a chance that the learning will be as painful as it has been for some of us who have been doing this since before it was cool.
14.1 Have you met your data?
What I mean by meeting isn’t the brief and polite nod of acknowledgment when passing your data on the way to refill your coffee. Nor is it the 30-second rushed socially awkward introduction at a tradeshow meetup. Instead, the meeting that you should be having with your data is more like an hours-long private conversation in a quiet, well-furnished speakeasy over a bottle of Macallan Rare Cask, sharing insights and delving into the nuances of what embodies the two of you as dram after silken dram caresses your digestive tracts: really and truly getting to know it.
TIP Before writing a single line of code, even for experimentation, make sure you have the data needed to answer the basic nature of the problem in the simplest way possible (an if/else statement). If you don’t have it, see if you can get it. If you can’t get it, move on to something you can solve.
As an example of the dangers of a mere passing casual rendezvous with data being used for problem solving, let’s pretend that we both work at a content provider company. Because of the nature of the business model at our little company, our content is listed on the internet behind a timed paywall. For the first few articles that are read, no ads are shown, content is free to view, and the interaction experience is bereft of interruptions. After a set number of articles, an increasingly obnoxious series of pop-ups and disruptions are presented to coerce a subscription registration from the reader.
The prior state of the system was set by a basic heuristic controlled through the counting of article pages that the end user had seen. Realizing that this would potentially be off-putting for someone browsing during their first session on the platform, this was then adjusted to look at session length and an estimate of how many lines of each article had been read. As time went on, this seemingly simple rule set became so unwieldy and complex that the web team asked our DS team to build something that could predict on a per-user level the type and frequency of disruptions that would maximize subscription rates.
We spend a few months, mostly using the prior work that was built to support the heuristics approach, having the data engineering team create mirrored ETL processes of the data structures and manipulation logic that the frontend team has been using to generate decision data. With the data available in the data lake, we proceed to build a highly effective and accurate model that seems to perform exceptionally well on all of our holdout tests.
It is upon release to production that we realize an issue, shown in figure 14.1. What we, as the DS team building the solution, failed to do was to check the conditions of the data that we were using for features.
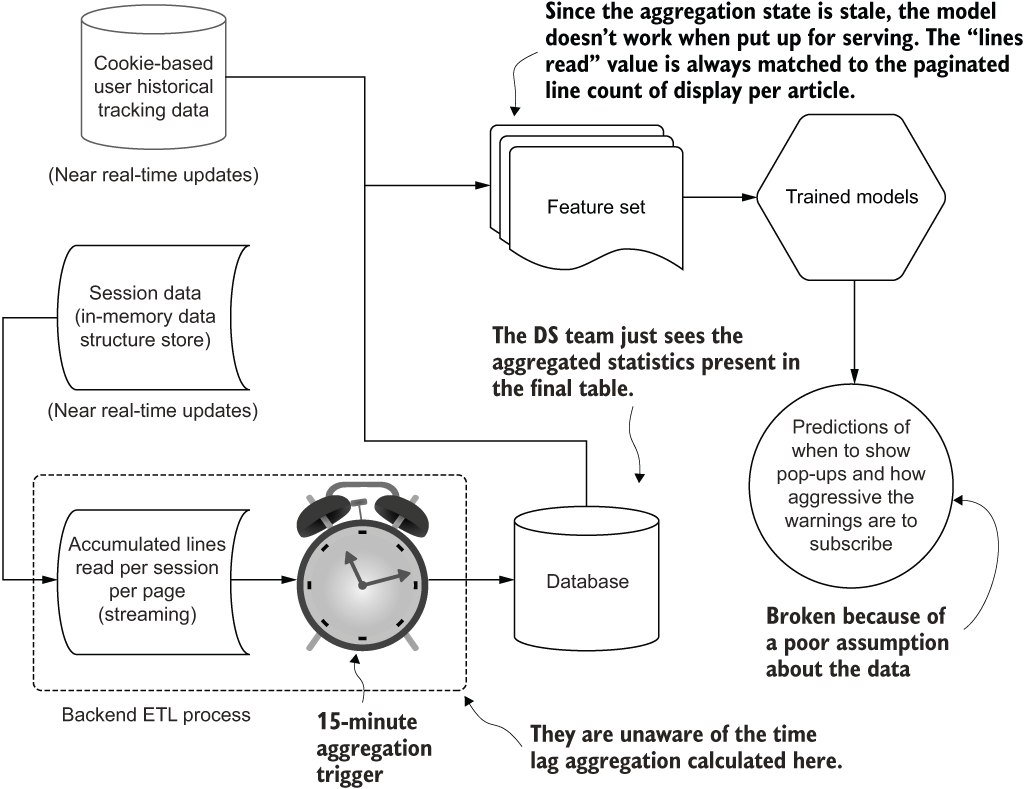
Figure 14.1 Failing to understand the data SLAs makes for a terrible model in this case.
Our model is trained from the data present in the lakehouse on object storage. What we didn’t realize, when working on the extracted data during model development, was the mechanism of that data extract. We assumed that the features that we were using would be available directly within the data lake in near real-time. However, the data engineering team, to keep costs low and minimize the impact to production systems, developed its ETL from Redis to be a periodic dump on a 15-minute triggered window. From the data that we used for training, we saw consumption data from a session, split up into 5-second chunks of activity that we could use to readily create rolling aggregation statistics as a primary feature. It stands to reason that we could make the assumption that data would be loaded via a 5-second trigger continuously.
Once the solution entered production, it wasn’t just that the effect wasn’t personalized based on activity. Rather, the massive problem was that everyone was getting hit with the same prediction of “show all the ads and pop-ups” immediately upon seeing their first article. With a complete lack of relevant feature data, the model was rendered completely ineffective. We made a massive mess of the website for a full day, forced a complete re-architecting of the project, and ended up throwing away most of the solution that was based unknowingly around data that couldn’t easily be made available to the model. Whoops.
Let’s take a look at three primary guiding principles that I think about when starting DS projects and why they’re important. If these three principles aren’t adhered to, in my experience, the ability of a project to stay in production is slim to none—regardless at how cleverly implemented it is, how successful it is at solving a problem, or how much enthusiasm there is within the organization to use it.
14.1.1 Make sure you have the data
This example might seem a bit silly, but I’ve seen this situation play out dozens of times. Having an inability to get at the right data for model serving is a common problem.
I’ve seen teams work with a manually extracted dataset (a one-time extract), build a truly remarkable solution with that data, and when ready to release the project to production, realize at the 11th hour that the process for building that one-time extract required entirely manual actions by a DE team. The necessary data to make the solution effective was siloed off in a production infrastructure that the DS and DE teams had no ability to access. Figure 14.2 shows a rather familiar sight that I’ve borne witness to far too many times.
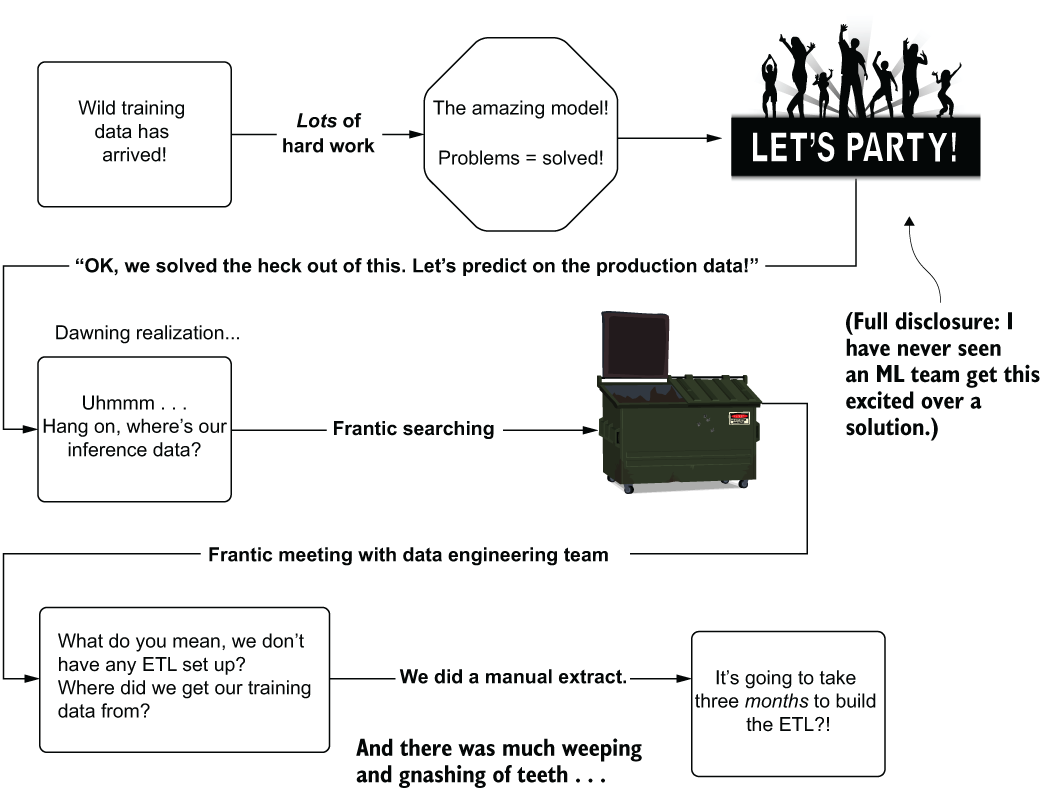
Figure 14.2 It’s best to make sure you have data before shipping a solution to production.
With no infrastructure present to bring the data into a usable form for predictions, as shown in figure 14.2, an entire project needs to be created for the DE team to build the ETL needed to materialize the data in a scheduled manner. Depending on the complexity of the data sources, this could take a while. Building hardened production-grade ETL jobs that pull from multiple production relational databases and in-memory key-value stores is not a trivial reconciliation act, after all. Delays like this could lead (and have led) to project abandonment, regardless of the predictive capabilities of the DS portion of the solution.
This problem of complex ETL job creation becomes even more challenging if the predictions need to be conducted online. At that point, it’s not a question of the DE team working to get ETL processes running; rather, disparate groups in the engineering organization will have to accumulate the data into a single place in order to generate the collection of attributes that can be fed into a REST API request to the ML service.
This entire problem is solvable, though. During the time of EDA, the DS team should be evaluating the nature of the data generation, asking pointed questions to the data warehousing team:
- Can the data be condensed to the fewest possible tables to reduce costs?
- What is the team’s priority for fixing these sources if something breaks down?
- Can I access this data from both the training and serving layers?
- Will querying this data for serving meet the project SLA?
Knowing the answers to each of these questions before beginning modeling work can help inform whether to engage in the project work. If the data isn’t ready for consumption, the answers can give the DE team time to prioritize and asynchronously work on building these datasets while modeling is happening on a manually extracted copy of the final dataset.
14.1.2 Check your data provenance
Adding on to the basic questions surrounding data availability is the incredibly important question of provenance of the data. Specifically, by what mechanism does the data get into the data warehouse or data lakehouse? Knowing where the data comes from that’s potentially going to go into your project helps you understand how stable it is, how clean it’s going to be, and how risky it will be to include it in the model.
To illustrate the importance of provenance, let’s suppose that we have three separate tables that we’re sourcing the data from to solve a particular supervised learning problem. All three tables exist within a data warehouse backed by cloud object storage, and each is in parquet format. Each table, from the perspective of the end user of the data contained therein, appear to be similar. A bit of overlap occurs in each, as some data appears to be duplicated information of the same underlying information, but all the tables can be joined to one another based on foreign keys.
Figure 14.3 depicts the visible information when looking at the data in these three tables.
By looking at the row counts and the field names, we can clearly see that we’re looking at e-commerce data. Table A is our master members table, B our orders data, and C our site traffic data. If this is the end of our investigation into where the data comes from to populate these tables, we could be setting ourselves up for a bit of a rude awakening when utilizing this data for modeling purposes.

Figure 14.3 The three tables of data present in the lakehouse tables available for our project
Before we start using this data to create a feature set, we need to know the ingestion mechanism. Without understanding when the data is loaded and at what frequency each table is updated, any joins that we do to create an imputation vector could have significant correctness issues.
Primarily because each of these datasets is produced and orchestrated by different engineering teams, but also because of the nature of the systems generating the data, there is a very low probability that there is agreement on recent data among them. For instance, on the most recent site activity data, the subsequent purchase event data may be delayed for more than an hour. Understanding these SLA considerations is absolutely critical to ensuring that feature data generated from these ETL processes is accurate. Figure 14.4 shows an expanded view of these tables, with some additional data obtained by questioning the DE team that owns the jobs that populate the data into the tables.
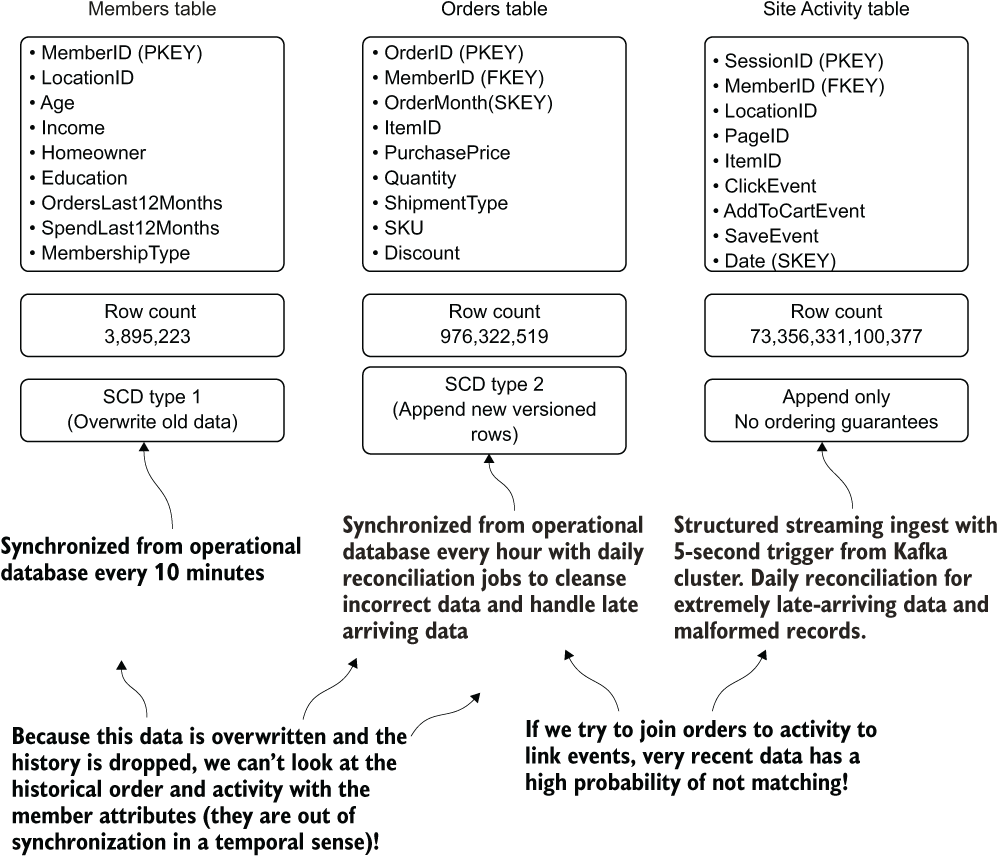
Figure 14.4 The additional information gained from chatting with the DE team about where the data comes from, how it gets there, and critical details about what can and can’t be done with it
Having these new details from the DE team, we can make some fairly critical decisions about the data sources. We could then enter this information in our data catalog solution. Examples of this might look like table 14.1.
Table 14.1 Data catalog entries for our sample user-tracking data
Based on these notes collected in the feature store, the DS team can understand the nuances of the data a great deal better. Thoroughly cataloguing the nature of source data systems can prevent one of the worst possible issues that can plague an ML solution: insufficient data available for generating quality predictions.
By taking extra time at the start of the production development phase to understand just where, when, and how data arrives at the source system used for both training and inference, a great many problems can be avoided. We can understand what data can and cannot be used for particular use cases (in this example scenario, the join between member attributes and either of the other tables for historical correlation purposes). We can identify a project’s limitations based on the defined characteristics of end use; in our example, we would clearly not be able to use the activity data for an extremely low-SLA use case. If the project requires a freshness of data that’s shorter in update frequency than that provided by the current ETL process, we can explore shortening that ETL process ahead of time to prevent a catastrophic production release issue.
With adequate time to prepare, the DE team can be working in parallel to the ML development work to provide the required data in the format needed to ensure that the implementation is acting upon recent-enough data to support the project’s needs.
These issues of data provenance become compounded greatly when we start thinking of compliance issues. Here are some elements to think carefully about:
- Are there regulations surrounding the data that you want to use for modeling, such as the European Union’s General Data Protection Regulation (GDPR), personally identifiable information (PII), or Health Insurance Portability and Accountability Act (HIPAA)? If so, please adhere to those requirements.
- Are there internal restrictions about visibility into the data that you’re using?
- Is there an inherent bias in your data that could ethically compromise the model that you’re building? (If you’re interacting with data about humans, the answer is likely a resounding yes, and you should think carefully about the provenance of the data being collected.)
- How often do the source systems and processes feeding these tables go down for maintenance or fail outright? Is the ETL generally stable?
- How often does the schema change on these tables? Are there rules and processes for nested elements in the data structures (mostly applicable to web-based datasets) that govern whether they can be changed?
- Is the data that is generated coming from an automated process (an application) or from human input?
- Are data validation checks running to ensure that only clean data is allowed to be entered into these tables?
- Is the data consistent? Is the source durable? Is isolation involved in the writing of data to the tables to eliminate the chances of correctness issues?
We have an exhausting litany of other things to check for with regards to data quality when information comes from disparate systems. The important thing to keep in mind, above all others in regard to data, is to trust nothing and verify everything before using any dataset. Ask questions and get the information about your data before wasting time on building models that wouldn’t work for a use case based on the nature of the data you’re using to train on.
Throwing unknown and potentially incorrect data into a model is a surefire way to create total and completely unusable garbage for a solution. Trust me, I’ve learned this lesson more times than I’d care to admit.
14.1.3 Find a source of truth and align on it
I’ve yet to work at, with, or for a company that has immaculate data. While many organizations have nearly perfect data models, highly robust data engineering pipelines, and effectively flawless ingestion architecture, the concept of perfection in the data itself is a nigh-impossible goal to attain.
Let’s imagine that we’re in a business-to-business company, providing HR services to a wide breadth of industries. Our DE team is world-class and has employed from the very early days of the company a data model that has handled business changes over the years remarkably well. The information is laid out in a flexible relational star schema and allows for rapid access for analytics within the data warehouse.
Three years ago, things began to change with the advent of moving to cloud computing and the paradigm shift that a cost-effective data lake (cheaper than an on-premises solution) brought with it. Gone were the days when all new data source generation for analytics had to go through the DE team. Any group in the company could create data, upload it to the object store, register the source as a table, and utilize it for their purposes. The democratization of data access promised by the cloud vendor was surely to be a true revolution in the effectiveness and insights into our company!
It didn’t quite work out that way, though. As the lake festered and became a swamp, multiple copies of similar-seeming data began to be birthed. Figure 14.5 shows a single hierarchal representation of industry types in multiple locations within the analytics layer of the data lake.
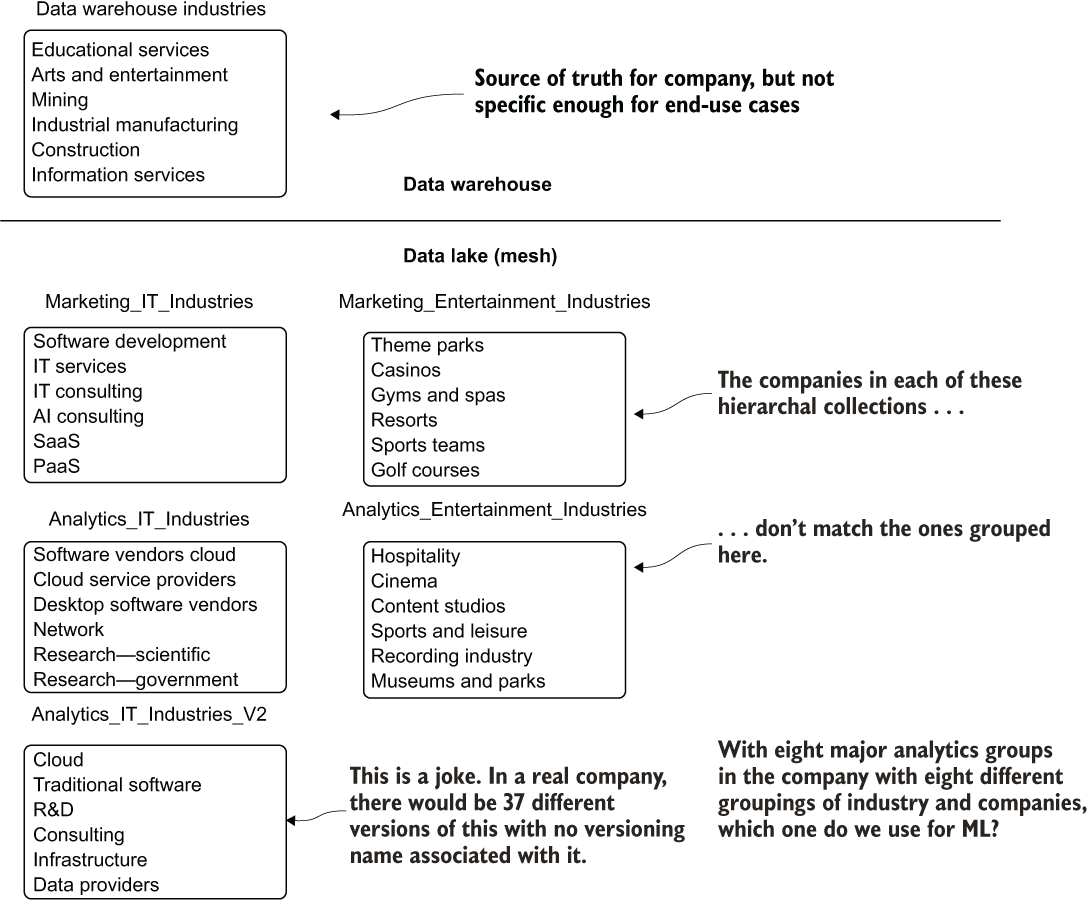
Figure 14.5 With self-service enabled on a data lake, having no unified source of truth can make everyone’s lives more difficult.
If we’re about to work on our ML project by using these product hierarchies available in the data lake, which one do we choose from? With so much overlap and inconsistency, how do we figure out what is the most relevant?
There is simply no way to test all of them—particularly, as is mentioned at the bottom of figure 14.5, considering that multiple versions from the same group exist at various commit periods. What should be done?
The most successful approach that I’ve found is to align the teams on a process that provides a single source of truth that meets each of their needs. This doesn’t imply that everyone needs to conform to the same definition of which groups of companies need to go in which aggregation bucket, though. Rather, it means the following:
- Maintaining a single copy of each department’s definitions that supports its needs for interacting with the data (no _V2 or _V37 copies of the same data, adding confusion).
- Choosing the correct type of slowly changing dimension (SCD) updates to accommodate the needs and uses of each team for this data. (Some teams may need historical references, while others may need only the most recent values.)
- Standardizing. If it’s a duck, call it a duck. Calling things by unique and cute names like aquatic_avian_waterfowl_fun_plumage doesn’t do anyone any favors.
- Periodic housekeeping. If the data isn’t getting used, archive it. Keeping the lake healthy means that everyone can swim in it.
- Inventorying the data. Use entity-relationship (ER) diagrams in a knowledge repository, build or buy a data catalog, or maintain detailed documentation about each column in each table.
While all of these tasks may seem like an awful lot of work—and they are—they’re the foundation on which modern businesses run. Having intelligible data doesn’t just benefit ML projects, but allows for the same (mostly) clean data to be shared among the analytics groups and the DS group(s). It translates to everyone speaking the same language when conversing about the state of the business and the innovative future work that can leverage that data.
In the vein of data quality, one thing that you should never attempt to do as part of an ML project is to correct the data yourself (even if it is tempting to do so). The single-source-of-truth concept is far more important than you might believe.
14.1.4 Don’t embed data cleansing into your production code
This is going to be a sensitive subject. Particularly for your data engineering friends.
Let’s pretend that we’re working on a project intended to estimate whether a customer should be automatically enrolled in a credit card offer that provides a higher limit than their current card. We’ve explored the data available in the data warehouse and have settled on the minimal number of features for building a prototype (keeping things simple to begin with) and the three tables required to source the data.
While doing data exploration and validation on the data, we encounter issues. From duplicate data, to inconsistent product descriptions, to scaling factor issues with the raw financial transaction historical data present, we have our work cut out for ourselves.
If we were to utilize the data-cleansing tools available in our ML platform to address these issues, we’d have an entire module in the code base devoted simply to data preprocessing tasks in order to fix the data. Running the data through the preprocessing stages, followed by feature engineering, and finally model training and validation, we’d have a process that works pretty well for generating a model.
What happens at prediction time, though? With the source data in such a poor state of quality, we have three options if we stick with this paradigm:
- Replicate the imputation, de-duplication, and regex code for a prediction job. (A bad idea because of maintainability concerns.)
- Create an independent utility preprocessing module that can be called from both the training and the inference jobs. (A better idea, but still not ideal.)
- Build the cleansing logic into a full pipeline object. (An even better idea, but potentially wasteful and expensive.)
Let’s suppose that, in our rush to get the project out quickly, we completely forget to do any of these things. Our logic for data cleansing is built fully within our training code base, the model has been validated to work quite well, and we’re ready to ship it to production.
While testing on an extremely small subset of the production data volume, we start to realize through our monitoring of model performance that multiple customers are getting contacted repeatedly, their credit limits being increased several times over. Other seemingly well-qualified customers are getting credit-limit increase requests for cards and services that they don’t currently have. Basically, we’ve built a great model that is predicting state on garbage data. Figure 14.6 illustrates the situation that has been created with this project.
Figure 14.6, although an extreme case of forgetfulness and chaos, exposes the options that are listed as possible solutions when an ML team chooses to repair data-quality issues. When moving in this direction of fixing the data yourself, you now are responsible for that. Instead of building a solution with the data, you own a solution and the data-repair tasks.

Figure 14.6 Fixing data-quality issues within ML code can create a great deal of chaos.
While this particular scenario is unavoidable in certain organizations (such as small startups where a DS may be serving the role of DE as well as DS), the recommended course of action remains the same: specifically, that the data-cleansing code should never remain linked to a modeling solution. Figure 14.7 shows a better solution to data-quality issues.
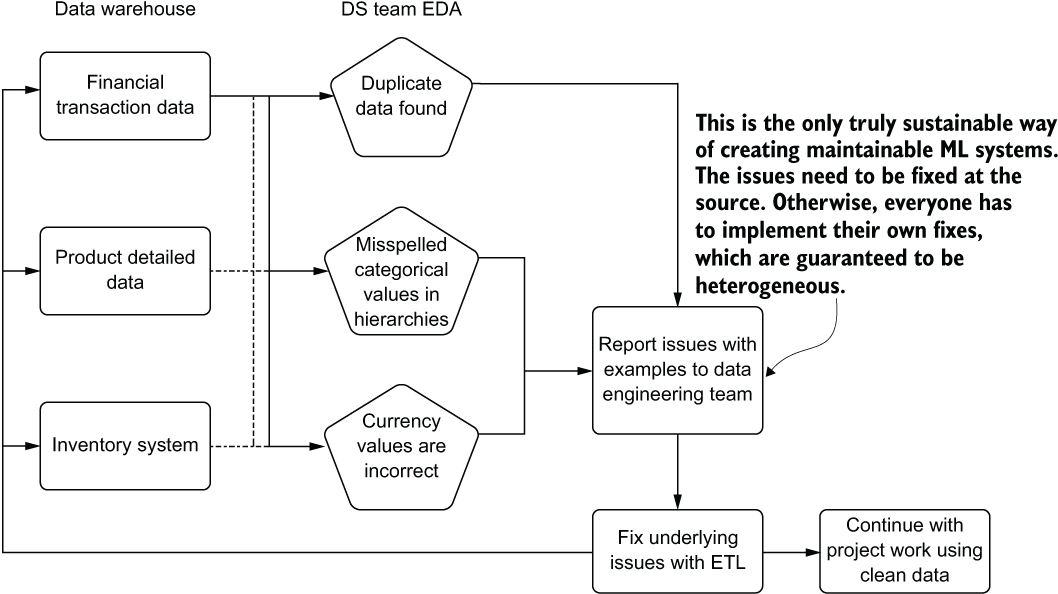
Figure 14.7 The better way forward for fixing data-quality issues: not embedding data repair tasks in ML code
The far more sustainable and preferred way of keeping data-repair tasks functional in a long-lasting manner is to fix the data at the source. This helps solve several problems:
- The data is cleaned for other use cases.
- Expensive de-duplication, correction of issues, interpolation, and complex joins are removed from model training and inference code (reducing complexity).
- The data is reliable for usage between training and inference (no risk for mismatched logic between training and inference).
- Feature monitoring (drift detection) is greatly simplified.
- Analytics and attribution measurement are greatly simplified.
Keeping a clean state for data used for modeling is a cornerstone of stable and production-grade ML solutions. While ML packages include a lot of tools for correcting issues in data, the most reliable manner of enforcing data correctness is doing it at the source: where the data is stored.
14.2 Monitoring your features
An often-overlooked part of production ML deployments is keeping a close watch on the features that are going into models. As professional DSs, we spend a truly obscene amount of time and effort analyzing each and every attribute associated with our features. Many times, solutions get shipped to production and the only thing that is monitored is the output of the model. This results in unexpected surprises when performance degrades, leaving us in a position of scrambling to diagnose what changed, why it may have changed, and how to go about fixing the problem.
Let’s suppose that we’re working at our dog-food company from appendix A. We’ve shipped a model to production, have monitoring set up on the predicted dog-food demand, and the amount of product wastage is decreasing dramatically. We have a thorough and automated attribution-analysis system in place that is keeping track of the forecasting performance, showing a higher-than-anticipated performance result for the project.
Many weeks later, our predictions stop making sense. They’re predicting far less inventory to order for each of the distribution sites. Luckily, we have humans in the loop to validate the order requests, so all is not lost. We watch, with growing concern over a period of days, as the order predictions for each product type drop to extremely low levels for all products.
We panic, retrain the model, and see the results become so nonsensical based on our understanding of prior demand for products that we turn off the prediction system altogether. It’s not for another week of delving deeply into our feature data that we find the culprit. Figure 14.8 shows one of the key features that our model was using for predictions.
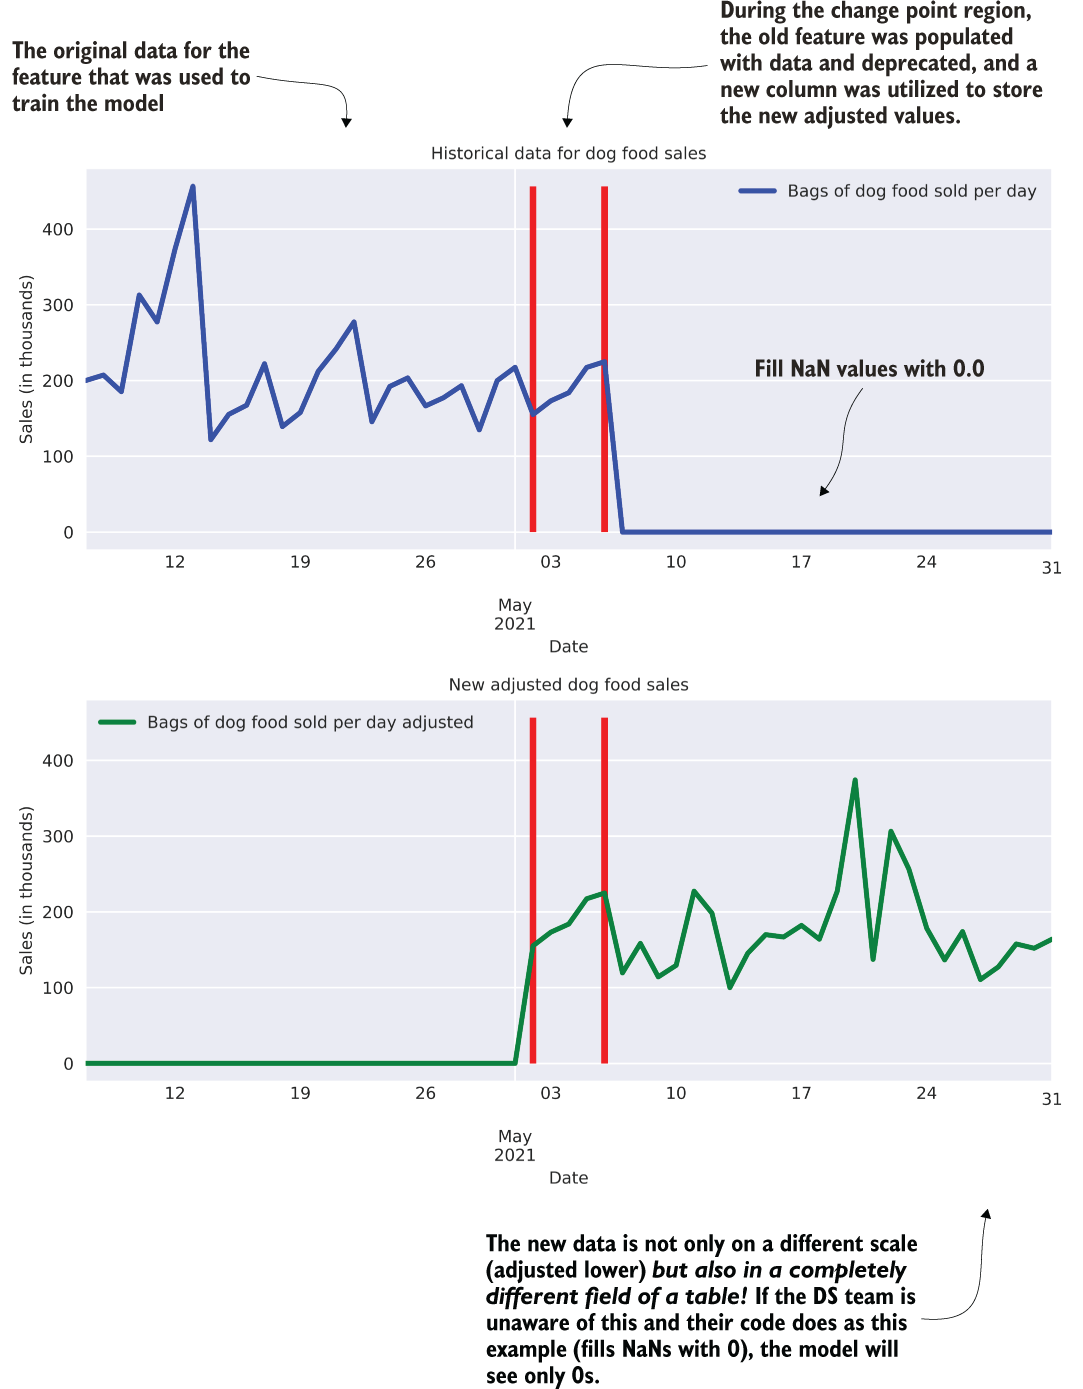
Figure 14.8 A change in the ETL of a key feature becomes a very sad week for the DS team.
The graph at the top of figure 14.8 shows the sales figures for one of our regional distribution centers, while the graph at the bottom shows the newly adjusted sales figures that the finance team asked the DE team to create for the new, “more accurate” reporting paradigm for the company. During the period of overlap (the transition period), both of these columns of sales data were populated, but at the end of the transition period, data stopped feeding into the original column.
So, what happened with our model? Since the sales figures were such a critical part of the model, and because we were using imputation methods based on a recency window applied to the last seven days of data, the imputed values for missing data began to rapidly trend to zero. The model, having such a large weight applied to this feature, not only received data that it hadn’t evaluated during training (zero sales, after all, is a bad thing and hadn’t been present in our non-bankrupted company), but the impact of this value being so low effectively drove the demand predictions for all products to zero in a short period of time.
Setting aside the debate about null-value handling in ML (fill with 0, impute over the training set data’s values, smoothing imputation, and so forth), how could we have caught this issue before it became a truly bad problem? Even if we had no prior warning of this change, how could we have had alerting established on the feature values so that the first day of values dropping to zero would have let us know that this particular feature had a problem?
The simplest solution is to collect basic statistics about each feature during training (alternatively, approximate statistics if you’re on a distributed system with a large training set). These statistics can be stored in a table that is versioned in accordance with each training iteration using a basic SCD type 2 methodology: append new rows for the features’ data and increment the version with each subsequent run. A daily job can then be scheduled whose only purpose is to compare the values used for prediction for the last n hours or days to those of the features as they existed during the last training run. The following listing shows basic examples of this concept, run against the data shown in our scenario (the top graph in figure 14.8).
Listing 14.1 A simple feature-monitoring script
import numpy as np
prior_to_shift = np.append(ORIGINAL_DATA,
BOUNDARY_DATA)                                              ❶
prior_stats = {}                                            ❷
prior_stats['prior_stddev'] = np.std(prior_to_shift)        ❸
prior_stats['prior_mean'] = np.mean(prior_to_shift)
prior_stats['prior_median'] = np.median(prior_to_shift)
prior_stats['prior_min'] = np.min(prior_to_shift)
prior_stats['prior_max'] = np.max(prior_to_shift)
post_shift = np.append(BOUNDARY_DATA,
np.full(ORIGINAL_DATA.size, 0))                             ❹
post_stats = {}                                             ❺
post_stats['post_stddev'] = np.std(post_shift)
post_stats['post_mean'] = np.mean(post_shift)
post_stats['post_median'] = np.median(post_shift)
post_stats['post_min'] = np.min(post_shift)
post_stats['post_max'] = np.max(post_shift)
bad_things = "Bad things are afoot in our sales data!"
if post_stats['post_mean'] <= prior_stats['prior_min']:
    print(bad_things +
      " Mean is lower than training min!")                  ❻
if post_stats['post_mean'] >= prior_stats['prior_max']:
    print(bad_things +
      " Mean is higher than training max!")                 ❼
if ~(prior_stats['prior_stddev'] * 0.5
  <= post_stats['post_stddev'] <=  2.
  * prior_stats['prior_stddev']):
    print(bad_things + " stddev is way out of bounds!")     ❽
>> prior_stats
{'prior_stddev': 70.23796409350146,
 'prior_mean': 209.71999999999994,
 'prior_median': 196.5,
 'prior_min': 121.9,
 'prior_max': 456.2}
>> post_stats
{'post_stddev': 71.95139902894329,
 'post_mean': 31.813333333333333,
 'post_median': 0.0,
 'post_min': 0.0,
 'post_max': 224.9}
>> Bad things are afoot in our sales data! Mean is lower than training min!
❶ The prior-to-shift data from our scenario (the original column of sales data)
❷ A simple dictionary for safely storing our statistical values from the feature data
❸ The as-trained feature statistics (standard deviation, mean, median, min, and max)
❹ The post-shift data being used to compare against the trained statistics
❺ A per validation run dictionary (health-check job script that measures these statistics on each feature)
❻ Basic example checks for whether the mean of the feature now is below the minimum during training
❼ Similar check for whether the mean is above the max of training values
❽ A broad check on whether the variance of the feature has dramatically shifted
This code is intentionally simplistic and is intended to merely raise awareness of the need for monitoring relatively simple elements to calculate. The rules for a particular feature-monitoring toolkit that you may eventually develop can become as complex and feature rich as needed for your own use case or can stay relatively simple and built as a low-weight utility framework for monitoring basic statistics about any features used in your models.
In a real-world scenario, not only would we be retrieving data from all of our features, but we would be querying a table (or service that stores these statistics such as MLflow’s tracking server). The alerting would clearly not be a simple print statement, but rather a notification through a pager duty alert, email, or similar mechanism to let the team know that a rather large problem and disruptive day is ahead. The architecture surrounding all of those needs is highly specific to the infrastructure that you might be running in, so we’re keeping it simple here with print statements and dictionaries.
Active-in-development open source packages are being crafted at the time of this writing that are looking to solve this problem for the open source community. I highly encourage you to conduct some research to determine which one works well for your language, platform, and ecosystem. However, in the name of simplicity first, even building a simple validation script based on the logic in listing 14.1 can get the job done. The only thing that you don’t want to do is to completely ignore the features after releasing a solution to production.
14.3 Monitoring everything else in the model life cycle
In chapter 12, we talked at length about monitoring drift in features. That’s incredibly important, but for a production ML solution, it’s but one part of the full story around proper ML monitoring.
Let’s imagine that we’re working at a company that has an established ML footprint of projects in production: 14 major projects, all solving different use cases throughout the business. With our team of 10 DSs and 4 ML engineers, we’re finding it difficult to scale the team to support additional workloads.
For all of us, large portions of our day are relegated to just keeping the lights on. On any given day, some model needs a bit of attention. Whether we’re busy with a degradation in predictions that end users bring to our attention, or routine analytical maintenance required to check the health of a particular solution ourselves, we have precious little time to think about taking on another project. If we were to analyze our time spent on maintenance tasks for our solutions, we might see something similar to figure 14.9.
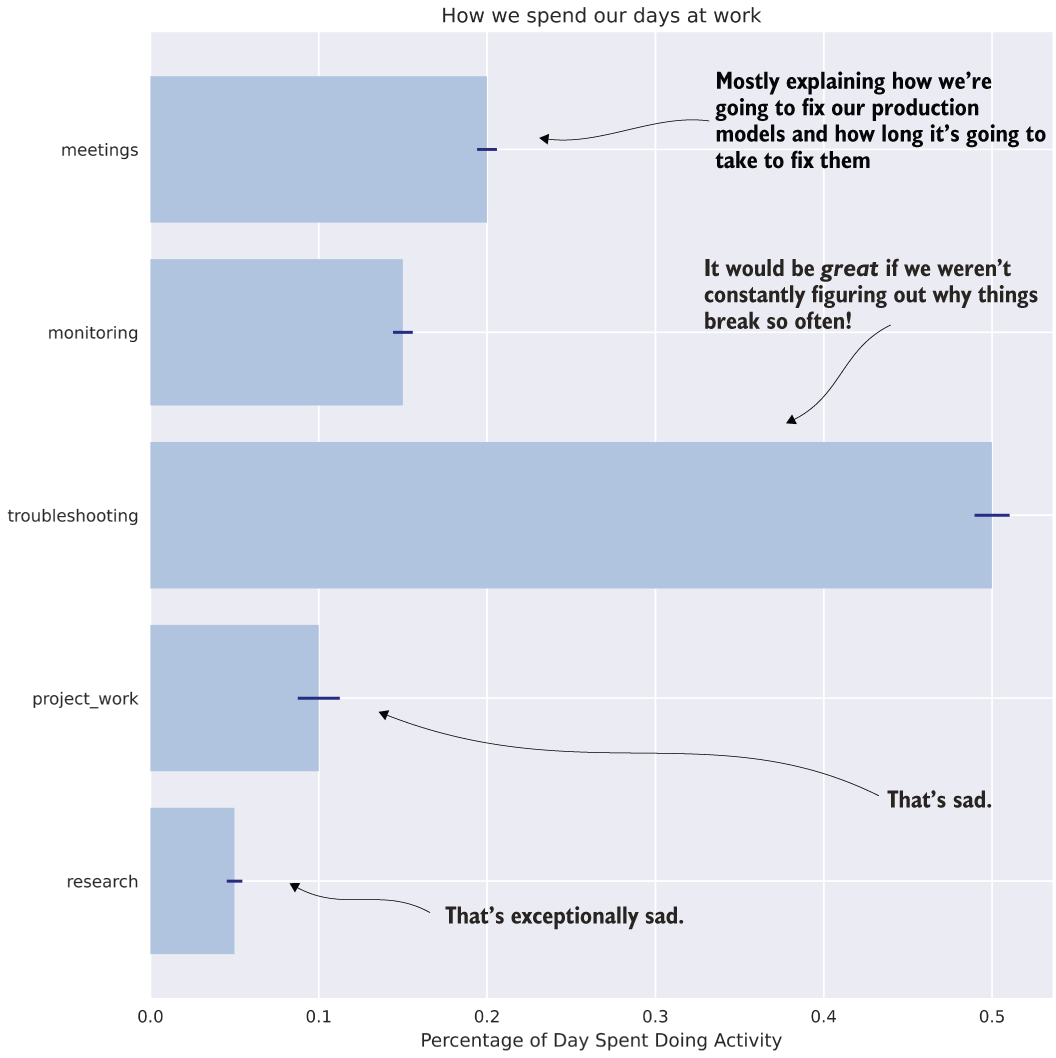
Figure 14.9 Even though we have a lot of models in production, we spend most of our time figuring out why they drift, how to fix them, meeting about why we’re having to fix them, and doing repair work. This is “keeping the lights on” DS work.
This daily life is a sad one. It’s not that the models are bad, nor that the solutions that incorporate them are bad. The fact is that models will drift and performance will degrade. If we’re not actively monitoring our models with automated solutions, we’ll end up exhausting our team’s resources in troubleshooting and repairing issues to such a degree that the only options available to take on new project work are to either hire more people (good luck with getting budget for that over a long period of time!) or to have visibility into the following:
- What is changing
- How it is changing
- What likely suspects are for drift (in features, model retraining, and predictions)
By having visibility into all aspects of our model life cycle, we can reduce the troubleshooting burden dramatically (and, at the same time, remove the manual act of monitoring altogether!). Figure 14.10 illustrates the portions of the model life cycle that should have some form of monitoring in place to alleviate the terrible burdens from figure 14.9.
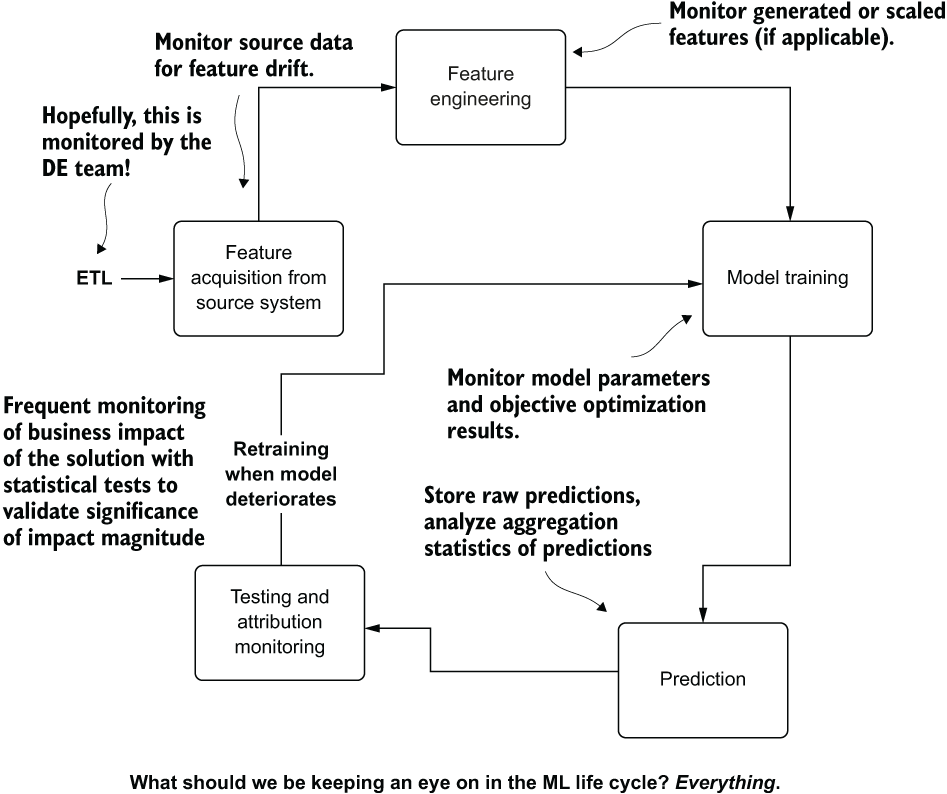
Figure 14.10 The parts of ML projects that need monitoring
The observations in many of these stages may seem like a bit of overkill. Why, for instance, should we be monitoring our feature-engineering data? Shouldn’t the predictions be good enough?
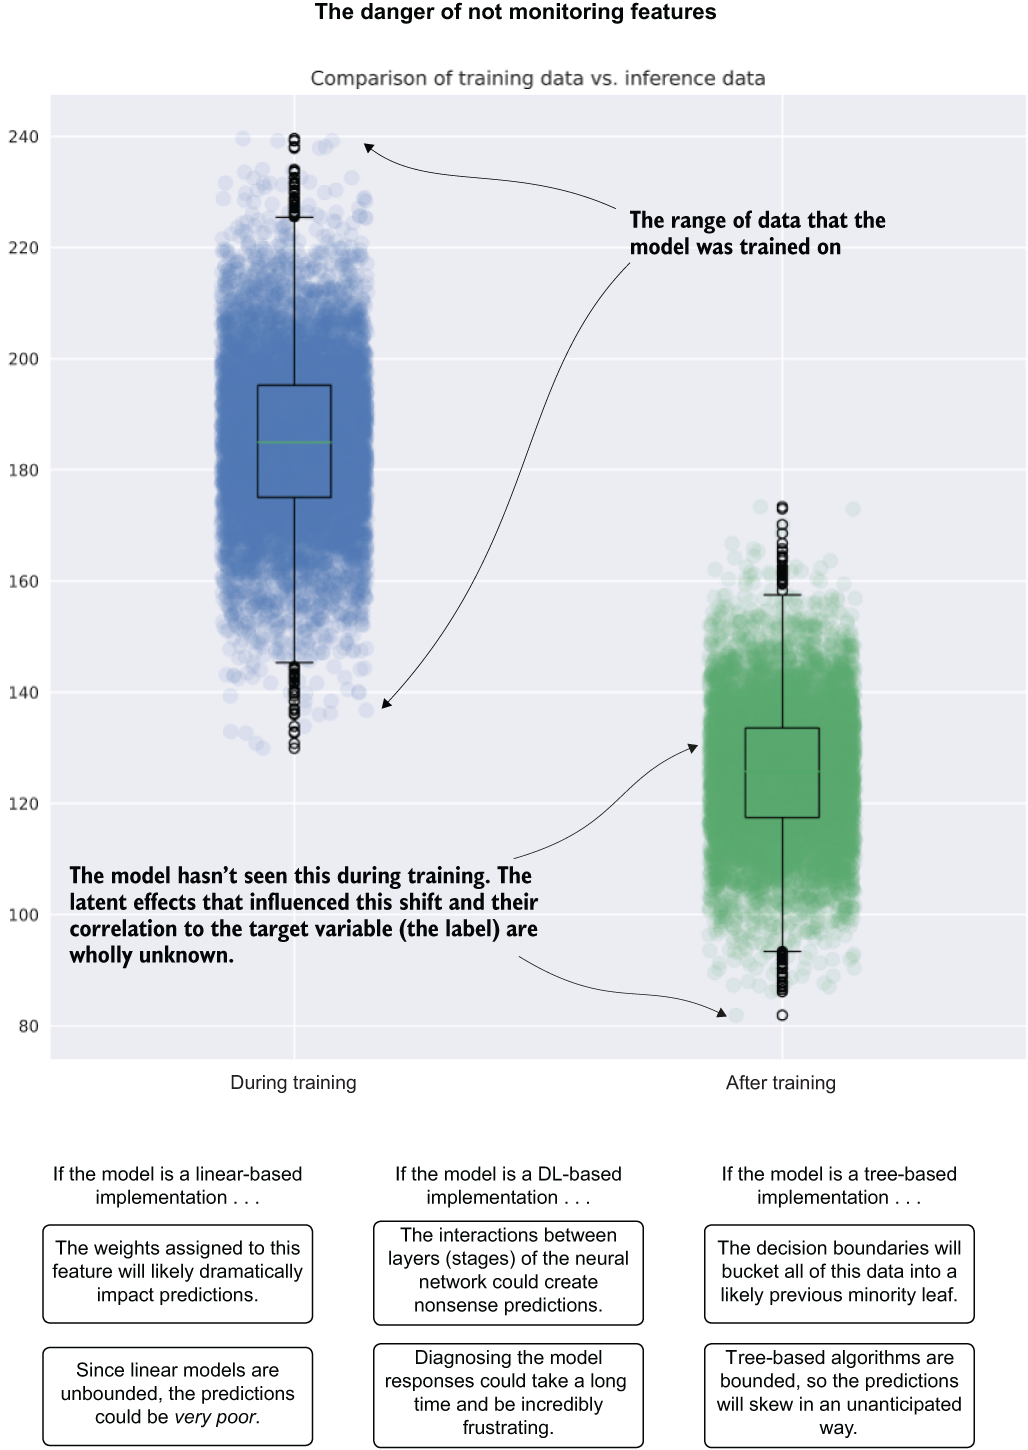
Figure 14.11 Significant feature drift and effects on different types of models
Let's take a look at why our bogged-down team should be monitoring features and any modifications that they might be doing to them. Figure 14.11 compares the same feature's distribution as seen during training (left) and later during production inference (right).
The model saw the feature within the confines of the range of data shown. Later, the feature drifts well outside the range that the model was exposed to during training. Depending on the model used, this could manifest itself in various ways, all equally bad (provided that the feature was at least somewhat significant to the model).
What would the process look like for the team members experiencing this, provided that they weren’t monitoring for this shift in distribution? Let’s keep it simple and say that their implementation was fairly pared down to begin with, having only 30 features. When the predictions start to suffer from incomprehensibly confusing results, an analytics process will have to be conducted on both the current state of the features and on the historical values as they existed during training. Many queries would be executed, references made to training events, graphs plotted, statistics calculated, and a thoroughly time-consuming root cause analysis would need to be performed.
In the immortal words of Kimberly “Sweet Brown” Wilkins, “Ain’t nobody got time for that.” These post hoc investigations are lengthy. They’re involved, monotonous, and draining. With 14 production projects running, a team of 14 supporting the ML needs of the company, and no monitoring of processes going on, this team is going to be absolutely swamped with zero value-add work. In a best-case scenario, they’d likely be looking at two to three investigations a week, each one taking at least one person’s full workday to complete and another day to initiate a new training run and evaluate the test results.
By setting up monitoring on every aspect of the pipeline, however, the team could identify what shifted, by how much, and when the deviation began. This could save whole person-days of effort, freeing up the team to automate away this monotonous work of investigating why their model started to fall apart, giving them all time to work on new projects.
This monitoring system doesn’t stop at simply looking at the features coming into the model. It also means looking at the following:
- Generated features—Interactions, scaling, and heuristics-based data manipulations
- The model(s)—Metrics for each training run
- The predictions—Distributions over time for either
pmforpdf, means and variance for regression, confusion matrices, and metrics for classification - The attribution—Stability of business metrics that gauge the effectiveness of the solution for the problem it is trying to solve
- Performance considerations—For batch, job runtime; for online, response SLAs
- Effectiveness of features over time—Periodic recursive feature elimination and subsequent culling of unnecessary features
By focusing on monitoring each component throughout the life cycle of an ML-backed solution, you can help scale your team by eliminating drudgery-type work. When people aren’t just keeping the lights on, they can focus more on new and innovative solutions that can prove greater business value over time. Another large part of responding to monitored health checks is keeping a solution as simple as possible while still solving the problem.
14.4 Keeping things as simple as possible
Simplicity is a unique form of elegance in ML applications. Scoffed at by many who are new to the field, because they initially believe that complex solutions are fun to build, the simplest solutions are the ones that endure. This is true for no greater reason than that they’re easier to keep running than intensely complicated ones—mostly because of cost, reliability, and ease of upgrading.
Let’s imagine that we’re relatively new to a somewhat junior team. Each team member is steeped in the latest technological advancements in the field of ML, highly capable at developing a solution using these cutting-edge tools and techniques. Let’s pretend for an instant that these coworkers of ours believe that people using “old” techniques like Bayesian approaches, linear algorithms, and heuristics in solving problems are mere Luddites who refuse to learn the technology of the future.
One of the first projects that comes along to the team is from the operations department. The senior vice president (SVP) of the retail group approaches the team in a meeting and asks for a solution that the operations department simply can’t scale very well. The SVP wants to know if the DS team can, with only images as fodder for a solution, determine whether the people in the pictures are wearing a red shirt.
The DS team immediately goes to what they’re experienced with in their toolboxes of latest and greatest solutions. Figure 14.12 illustrates the events that unfold.
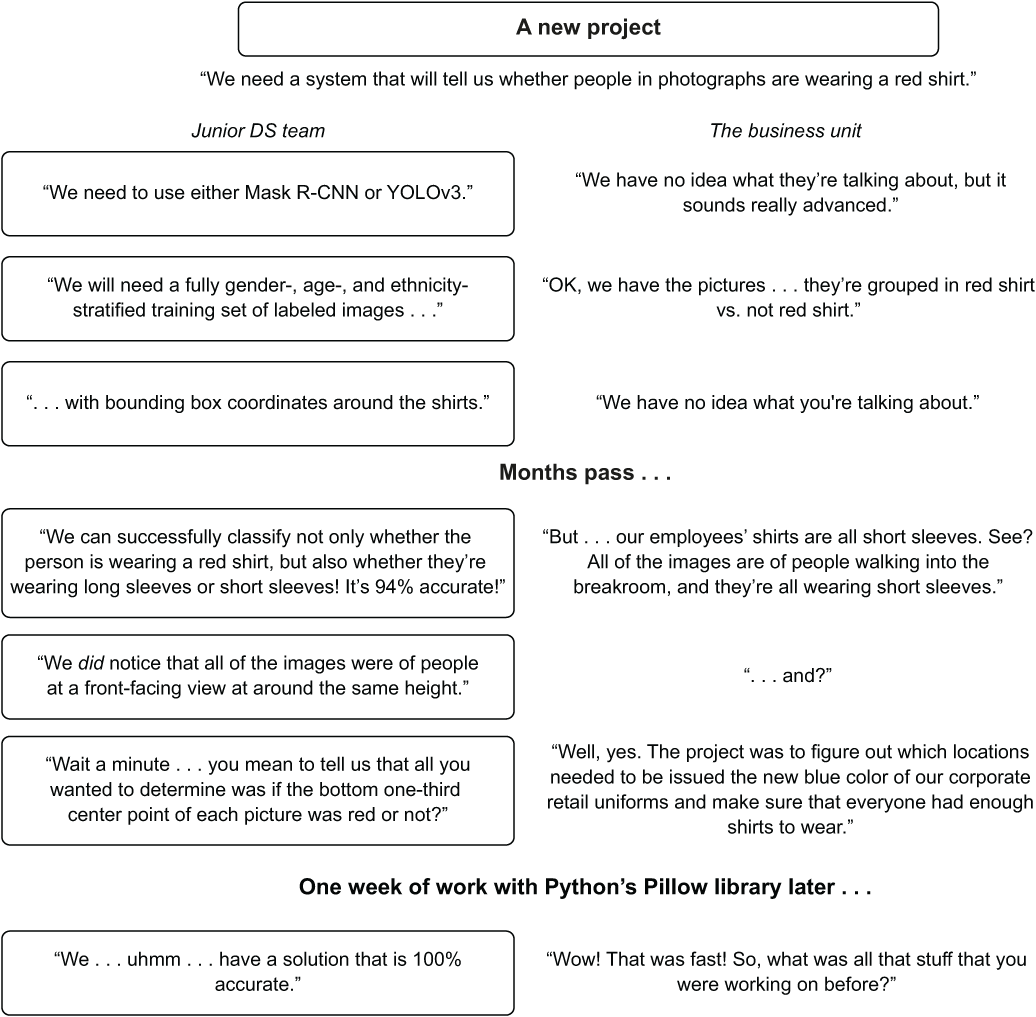
Figure 14.12 The discouraging results when advanced approaches are attempted before simpler ones
What happens in this scenario? The largest issue is in the complex approach that the team members take without validating simpler approaches. They choose to focus on technology over a solution. By focusing on a highly advanced solution to the problem and not entertaining a far simpler approach (grab a swatch of pixels at one-third of the way up in the center line of each image, determine the hue and saturation of those pixels, and classify them as either red or not red), they waste months of time and likely an awful lot of money in the process of solving the problem.
This scenario plays out remarkably frequently in companies—particularly those that are nascent to ML. These companies may feel a need to go fast with their projects because the hype surrounding AI is of such a deafening roar of cacophony that they think their businesses will be at risk if they don’t get AI working at whatever the cost. In the end, our example team recognizes what the easiest solution could be and rapidly develops a solution that runs at massive scale with minimal cost.
The idea of pursuing simplicity exists in two main facets of ML development: defining the problem that you’re trying to solve and building the most minimally complex solution to solve the problem.
14.4.1 Simplicity in problem definitions
In our preceding scenario, the problem definition was clear to the business and the ML team both. “Predict red shirts for us, please” couldn’t get distilled to any more of a basic task than that. A fundamental breakdown still occurred in the discussion that was conducted, however.
The pursuit of simplicity in defining a problem centers around the elemental attributes of two important questions to be given to the internal (business unit) customer:
- What do you want a solution to do? This defines the prediction type.
- What will you do with the solution? This defines the decision aspect.
If nothing else aside from these two questions was discussed in the early-phase meetings with the business unit, the project would still be a success. Having the core need of the business problem addressed can more directly lead to project success than any other topic. The business simply wanted to identify whether employees were wearing the old company-branded red shirts in order to know to send them the new branded blue shirts. By fixating on the problem of red shirt versus blue shirt, a far simpler solution can be achieved.
Throughout the discussion that follows, we’d get the information about the nature of the photographs and their inherent homogeny. With these two fundamental aspects defined, the team can focus on a smaller list of potential approaches, simplifying the scope and work involved in order to solve the problem. Without these questions defined and answered, however, the team is left to an overly broad and creative exploration of possible solutions—which is risky.
The team members heard image classification, instantly went to CNN implementations, and for months on end locked themselves into a highly complex architecture. Even though it eventually solved the problem fairly well, it did so in a way that would have been incredibly wasteful. (GPUs and DL models being trained on them are significantly more expensive than a pixel-hue-and-saturation bucketing algorithm that could run on a smart toaster oven.)
Keeping the problem definition for a particular prospective project to such simple terms will not only help guide initial discussions with the business unit requesting a solution, but also provide a path toward implementing the least possible complexity in whatever gets built.
14.4.2 Simplicity in implementation
If we were to continue on the path of analyzing our scenario for red-shirt classification, we could simply look at the end solution that the team came up with to illustrate what they should have done first.
I, and many others I’ve known in this profession over the years, have learned this painful lesson many times over. By building something cool for the sake of the cool, we often regret it terribly when we realize how difficult that cool implementation ends up being to maintain. We suffer through fragile code and highly complex coupling of processes that seemed like something really fun to build, but end up being a complete and total nightmare to debug, adjust, or refactor when the code fully breaks.
Instead of belaboring an example, I’ll illustrate the way I think about problems that I’m asked to help solve. Figure 14.13 shows my thought process.
This flow chart isn’t much of a caricature at all. I nearly always think through a problem at first as though I’m trying to solve it with basic aggregations, arithmetic, and case/switch statements. If that doesn’t work, I move to Bayesian approaches, linear models, decision trees, and so forth. The last thing that I’m going to try to implement out of the gate is an adversarial network that requires hundreds of hours to train and, when it breaks, spend days (or weeks) troubleshooting mode collapse and how to adjust my Wasserstein loss to compensate for vanishing gradients. Thank you very much, but I’ll use those only when I’ve exhausted all other approaches to solving a problem.
In its most pure form, figure 14.13 demonstrates a core component of my psyche: I’m lazy. Really, truly, and profoundly lazy. I don’t want to develop custom libraries. I don’t want to build insanely complex solutions (well, that’s partly true; I love building them, I just don’t want to own them).
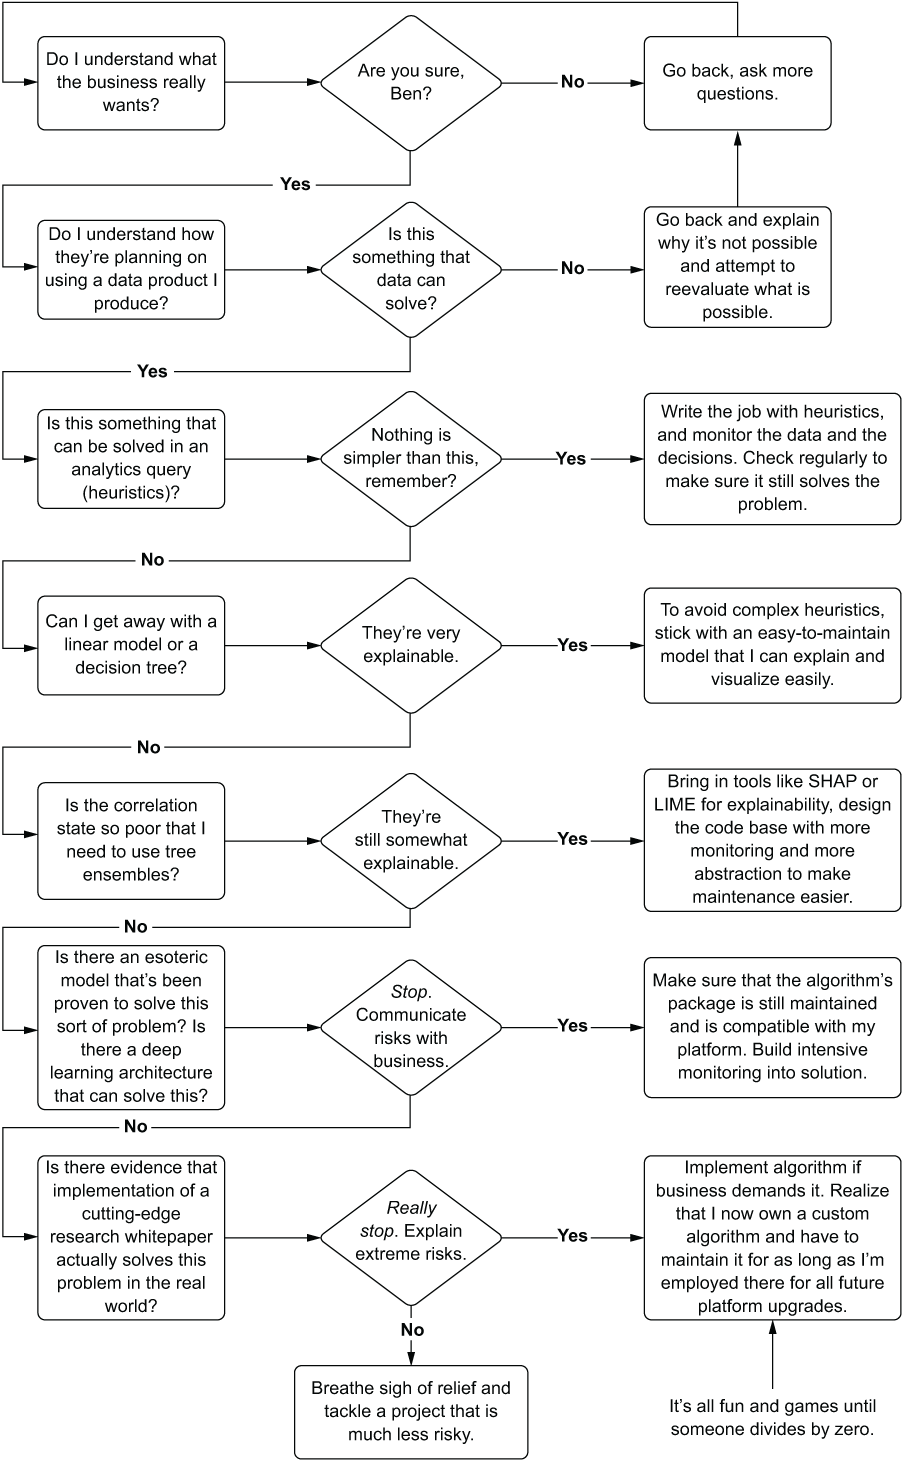
Figure 14.13 Author’s thought process when evaluating ML approaches to problems
I simply want to solve problems in a way that the code just works. I want to solve problems so effectively that people forget that my solution is running until someone freaks out that a platform service disruption happens and we all collectively remember what was actually running some critical part of the business. The only way that you get to achieve that penultimate version of laziness is by building something in the simplest way possible, having monitoring set up to alert you before anyone else notices that things are not OK, and having a clean code base that makes your repairs take hours instead of weeks.
The other benefit of selecting a simple design to solve a problem is that the process of developing the solution (the nitty-gritty hands-on-keyboard part of the software engineering aspect) becomes much easier. The design becomes easier to architect, develop, and collaborate in. That all starts with building effective wireframes for code bases.
14.5 Wireframing ML projects
We all learn a truly painful lesson after our first real-world production ML project (universal, at least, to peers I’ve interacted with in my career). This truly painful lesson is experienced in a mild form during the development of a solution, but only after months of supporting a solution is the teaching fully complete. This is the lesson of code architecture and how a lack of it can generate a truly crippling level of technical debt so that in order to make even small changes to a code base, significant parts of it need to be refactored (or rewritten!).
Because of an aversion to having monolithic scripts weighing down maintenance and enhancements to a solution, the freshly enlightened typically go down a path of, during code development, working at separating major functionality of their code as they go.
Let’s see how this plays out as we look at a team of newly wise ML practitioners. They’ve been supporting their first major (and arguably messy) code base for a few months and have identified multiple ways that they organized their code that didn’t work well for maintainability.
They decide to, during various sprints, as new features need to be developed, split their code apart so that functionality is separated. Figure 14.14 illustrates their processes.
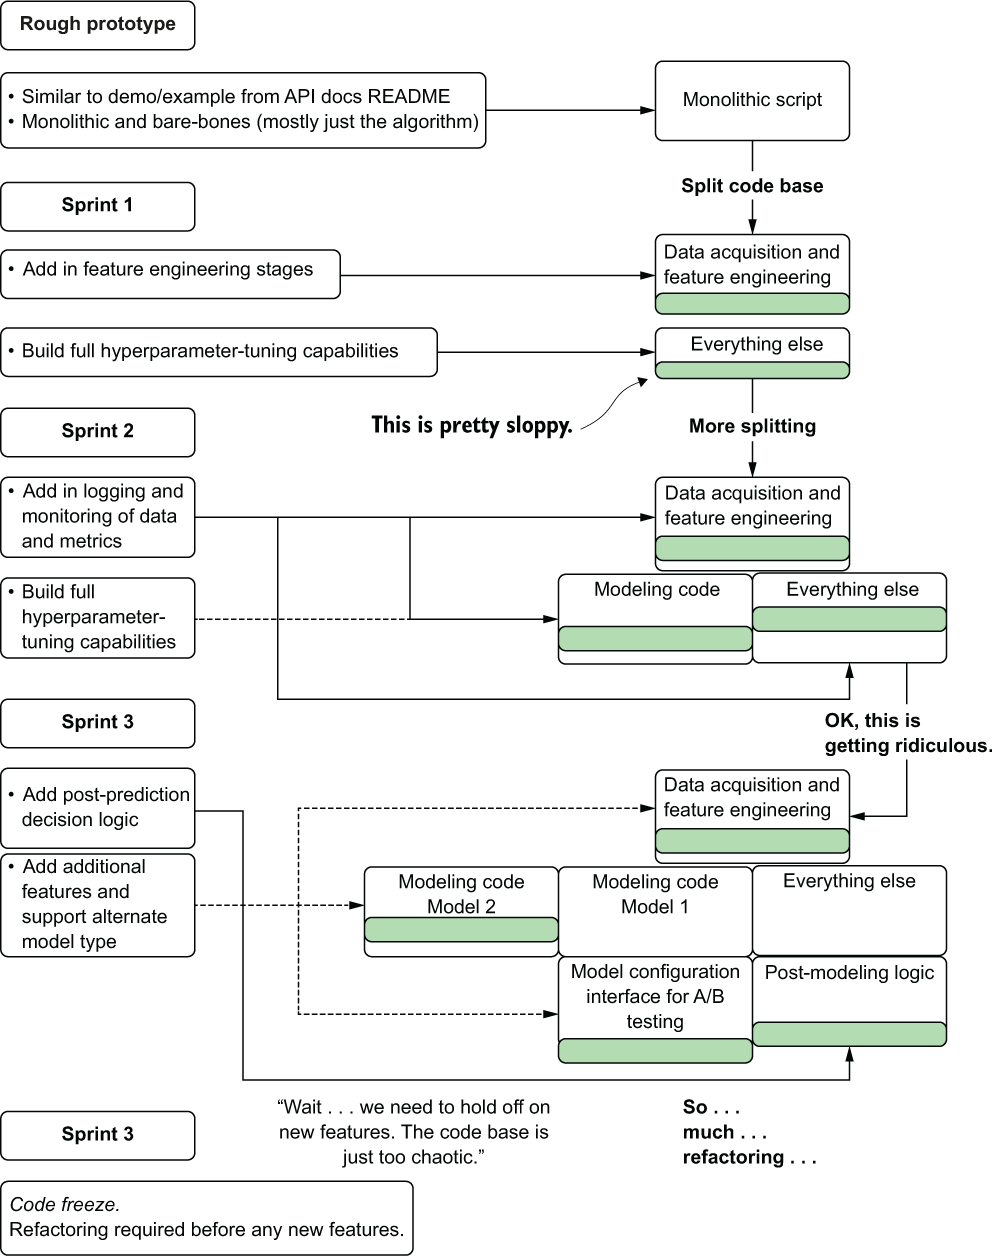
Figure 14.14 Without a general project code architecture, you’re in for a lot of refactoring.
It takes a short time for them to realize that although their approach is worthwhile, it isn’t the easiest way to go about building a project. Why is this the case with ML code?
- There are tight dependencies in scripts, particularly the hack-a-thon “just make it work” script.
- Experimental prototypes focus mostly on the algorithm, not on the data processing. Most of the eventually developed code base is in the realm of data processing.
- The code changes frequently during development (and after production release).
What the team ends up realizing by their third sprint is that refactoring all of their code into distinct modules as development progresses creates so much additional work and confusing code that new features become difficult to implement. Approaching code architecture in this way is simply not sustainable; managing code is hard enough with only a single person contributing, but nigh impossible if multiple people are working on a constantly refactored code base.
A better solution exists, and it involves setting up a basic wireframe for a project. While I balk at the term template when involving code, this is, in essence, essentially that, albeit a loose and mutable one.
Most ML projects’ architecture, at its most basic level, can be grouped into core groups of functionalities:
- Data acquisition
- Data validation
- Feature engineering, feature augmentation, and/or feature store interaction
- Model training and hyperparameter optimization
- Model validation
- Logging and monitoring
- Model registration
- Inference (batch) or serving (online)
- Unit and integration testing
- Post-processing prediction consumption (decision engines, if applicable)
Not every project is guaranteed to have all these components, while others might have additional requirements. (A deep learning CNN implementation might need a data serialization layer for batch-file processing and image augmentation, while an NLP project might need a module for ontological dictionary updating and interfaces, for example). The point is that distinct separations of functionality make up the wholly functioning part of the project. If they are all lumped haphazardly into modules where the boundaries of responsibility in the code become blurred (or, in the worst case, all in a single file), modifying and maintaining the code becomes a truly Herculean effort.
Figure 14.15 shows an alternative architecture that can be used immediately after the experimental prototype (the hack-a-thon-like rapid prototype is completed to prove the applicability of a model to the company’s data). While the modules in this architecture may not contain much of anything to begin with, they serve as placeholders (stubs) based on what the team expects to need throughout the project. If new modules are needed, they can be created. If a stub is never populated during the final sprint before release, it can be removed.
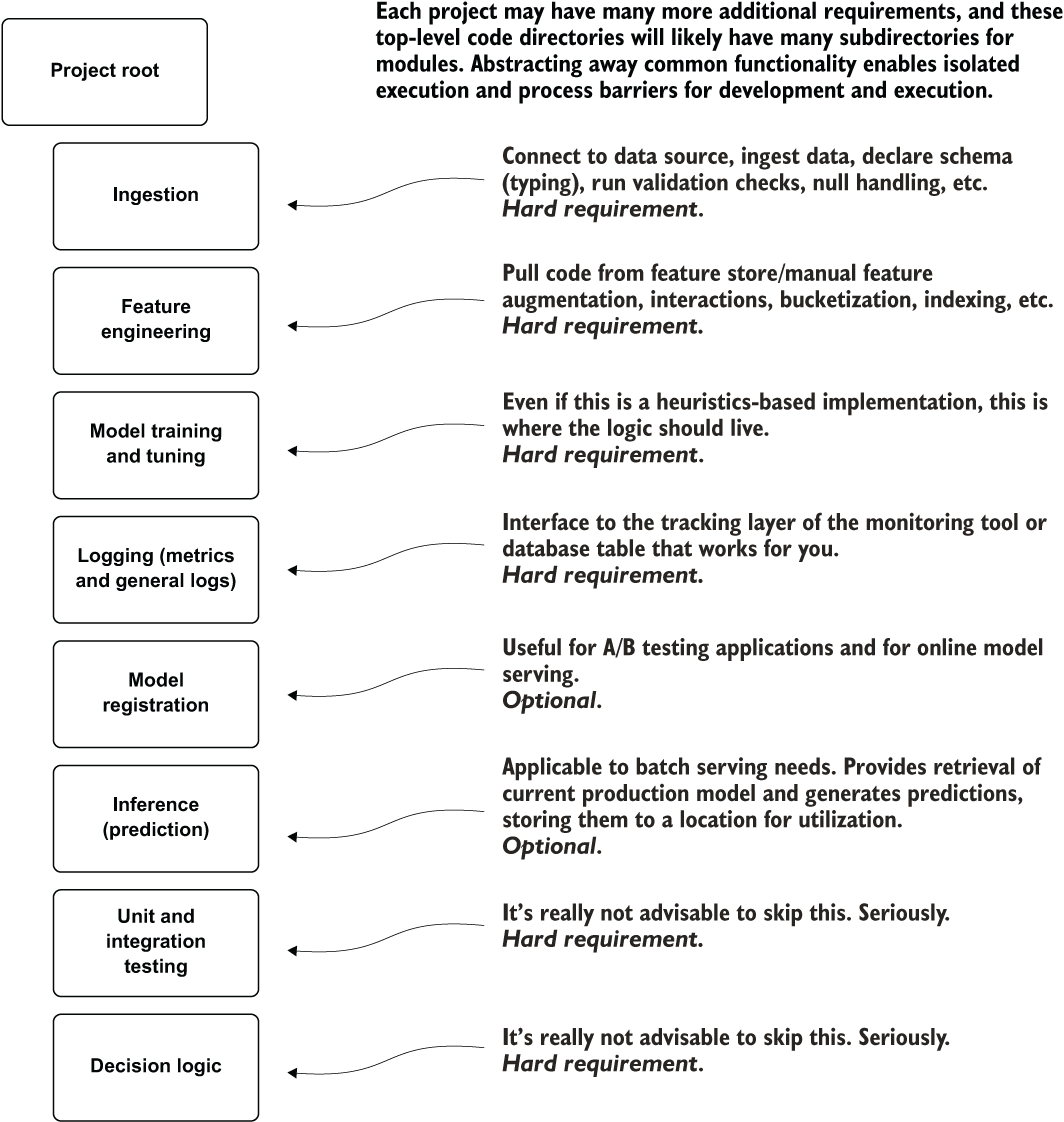
Figure 14.15 A generic ML project code wireframe to keep code logically organized, easier to develop within, and easier to maintain
This general template architecture enforces an encapsulation of concerns. It not only helps guide the sprint planning but also helps avoid merge conflicts in the code base at the end of sprints. It keeps the code organized from the beginning of the development period, makes searching for functionality easier, and helps make unit testing and troubleshooting far simpler.
While organizing stubs and creating abstraction may seem like excessive overkill for even simple projects, I can promise you, from having spent entire months of my productive working life doing nothing other than rewriting and refactoring fundamentally broken code architecture, it is anything but. It’s far easier to collapse abstraction and remove placeholder modules than it is to translate a code base into some semblance of logical order from pure, distilled chaos.
As an example of what not to do, and just how bad an interconnected mess of a poorly designed ML code architecture can be, see figure 14.16. (Yes, it was one of mine.)
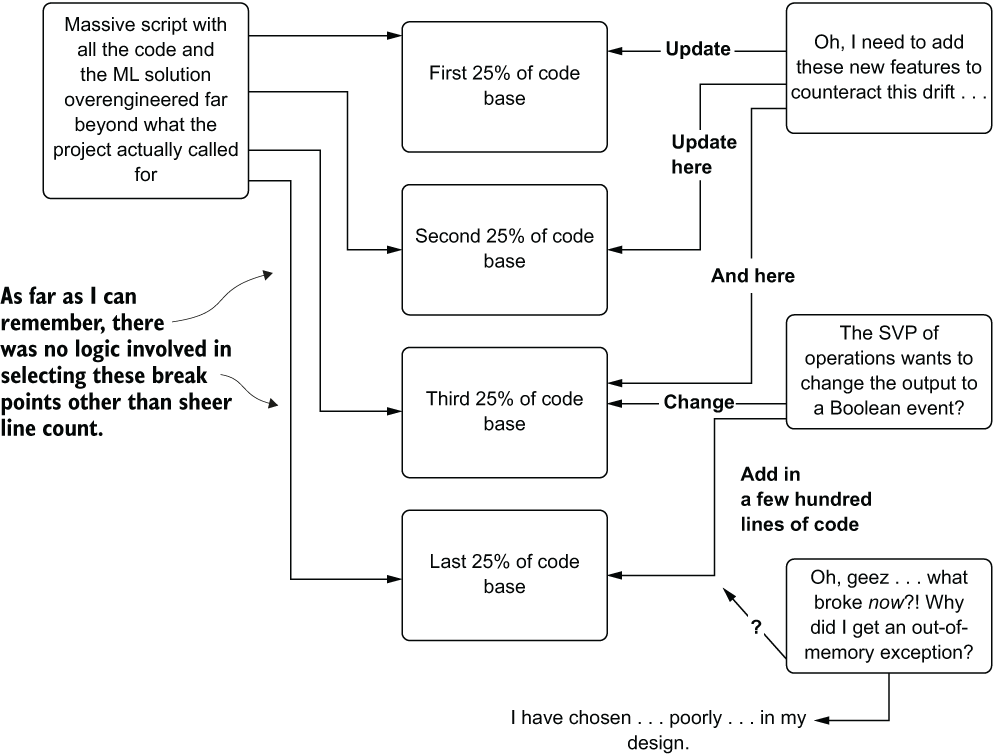
Figure 14.16 One of my earlier works of art before I knew what code design was and how abstraction, encapsulation, and inheritance work. Don’t do this.
This example represents one of my first projects (details of the use case removed so I don’t have a certain company’s lawyers calling me) and allows me to convey the magnitude of the lesson that I learned from this. It was, shall we say, substantial.
Having almost no logical design for a large code base does more than impact the initial development. It certainly is a major reason why providing a wireframe is important (particularly when an entire team is working on a project and needs to ensure that code merges aren’t overwriting one another’s changes). The lack of a logical design becomes acutely more painful when inevitable changes need to be made. Hunting through a massive script is incredibly time-consuming and frustrating even if you use clever naming conventions for variables and functions.
I learned to never underestimate the time savings that comes from proper code design. When framed properly, it enables the following:
- Stepping through modules for debugging or demonstration
- Writing isolated submodule unit tests and module-level unit tests to give peace of mind that large swaths of code are functional
- Driving directly to a place in the code in seconds (rather than searching for minutes or hours through a code base)
- Easily extracting common functionality from a code base and placing it in its own package for reuse by another project
- Significantly reducing the chances of having duplicated functionality in an ML code base, as it encourages abstraction and encapsulation from the start of development
Even for those who prefer to develop wholly within notebooks—which is OK, by the way, particularly if you’re on a small team or a team of one—having such a separation of activities can make your development and long-term care of your project code orders of magnitude simpler than it otherwise would be. The alternative, after all, is what I did early in my career, continuing from the experimental scripts, bolting on functionality with reckless abandon until I was left with a Frankenstein’s monster that I was as happy to look at as a villager with a pitchfork would be to see a real monster.
14.6 Avoiding cargo cult ML behavior
I’ve hammered quite heavily on avoiding hyped trends in ML throughout this book. In this section, I’m going to hammer away heavily on what I see as the most damaging form of the hype cycle: cargo cult behavior.
Let’s imagine that we’re in a company that has a relatively new ML footprint. Some key critical business problems have been solved, generally using proven and arguably unsophisticated statistical methods. The solutions are running well in production, they are monitored effectively, and the business is aware of the value of these solutions because of the thorough attribution determinations and testing that have been conducted. Then someone reads an article.
It’s a blog post from a famous and successful tech company that walks through how it has solved a previously unsolvable problem that affects our company as well. The article’s author mentions the newly open sourced solution that their company developed to solve the problem, provides a detailed explanation of how the algorithm works, and spends the vast majority of the post explaining the technical side of the implementation.
It’s a great article, and it serves its purpose well as a recruiting tool for attracting top technical candidates to their company. What the reader at our company fails to realize is that the reason for writing the article is to recruit, not to let a small company pick up their open source tooling and magically solve this problem in a few weeks.
The desire for this solution to be tackled is so high, though, that everyone is on board with using this new software solution. A project plan is developed, experimentation is done, API documentation is thoroughly read and understood, and a basic prototype is built.
It seems as though things are progressing well in the early stages of the project, but after a month or so, cracks in the plan begin to emerge. The team realizes the following:
- The algorithm is incredibly complex and difficult to tune well.
- The company that invented the algorithm probably has a lot of internal tools that help make using it easier.
- The data formats required for many elements of the code are different from how they store their data.
- The tool requires expensive cloud infrastructure to run and the establishment of a great many new services that they are unfamiliar with.
- Not enough data has been collected to avoid some of the overfitting issues that they’re seeing.
- Scalability concerns (with cost) restrict training times to days, slowing development.
It doesn’t take too much additional time after these cracks appear for the team members to decide to try a different approach that is far less sophisticated. They find that their solution, although unable to match the purported accuracies shown by the creator of the tool, is still quite successful. The other chief benefit is that their solution is far less complex, orders of magnitude cheaper to run, and requires infrastructure that their platform for ML already supports.
This result is possible only if the team is lucky enough to abandon the path that they’ve started down early enough in the project timeline. I truly wish that I hadn’t seen the alternative as many times as I have: teams spending months struggling to get something to work, spending a massive amount of time and money, with nothing to show for it in the end.
The thought processes that I’ve seen played out many times with this cargo cult behavior are exemplified in figure 14.17.
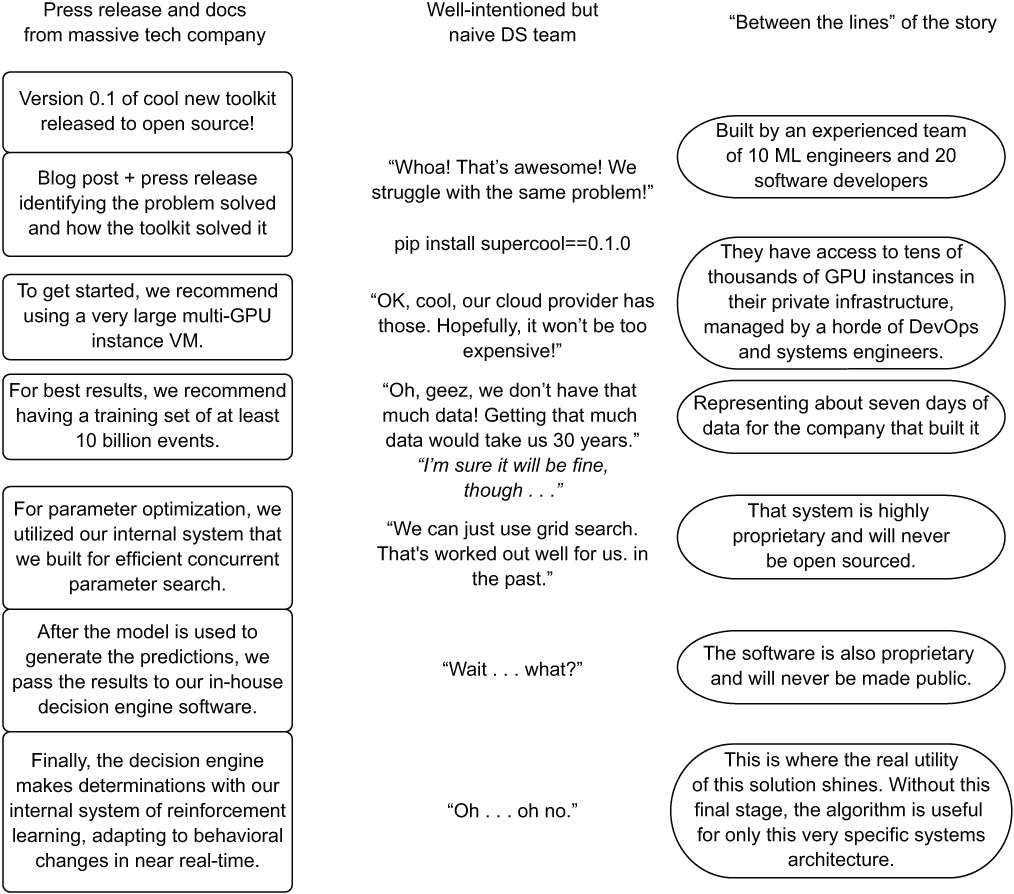
Figure 14.17 Blindly trusting the promises of a README and a blog post on a new package can waste a vast amount of time.
The team in this example erroneously believes that the new package is going to give them the same levels of success shown by the massive tech company’s press release. The team equates the miraculous performance of this company with everything that comes out of the doors of that organization.
This isn’t to say that these large companies are not successful. They generally employ some of the most profoundly innovative and clever software engineers in the world, in fact. The problem is that they’re not releasing all the goods in order for others to leverage everything that makes them successful. Companies that try to copy these examples, expecting the same results, will almost always fail at replicating them. This is due to several critical factors:
- They don’t have the same data.
- They don’t have the same infrastructure and tooling.
- They don’t have the same number of highly competent engineers available to support these complex solutions.
- They’re likely not dealing with the exact same use case (different customers, different ecosystem, or a different industry).
- They don’t have the same budget (in both time and money) to make it work.
- They don’t have the same R&D budget to spend months iterating on solving a problem in a very advanced way.
I’m not in any way, shape, or form stating that new technologies shouldn’t be used. I use them all the time—and most of the time, I enjoy doing so. My colleagues do as well with, similar to my own experience, varying success. New technology is great, particularly when it solves previously unsolvable problems. What I am cautioning against, however, is placing blind faith in those technologies, assuming that they will magically solve all of your woes, and that if you copy the way some massive and innovative company does its ML, it will work out the same way for you.
The key to avoiding cargo cult behavior in ML can be distilled down to a few elemental steps covered in earlier parts of this book. Figure 14.18 shows a visual guide that has always worked well for me when evaluating new possible technologies.
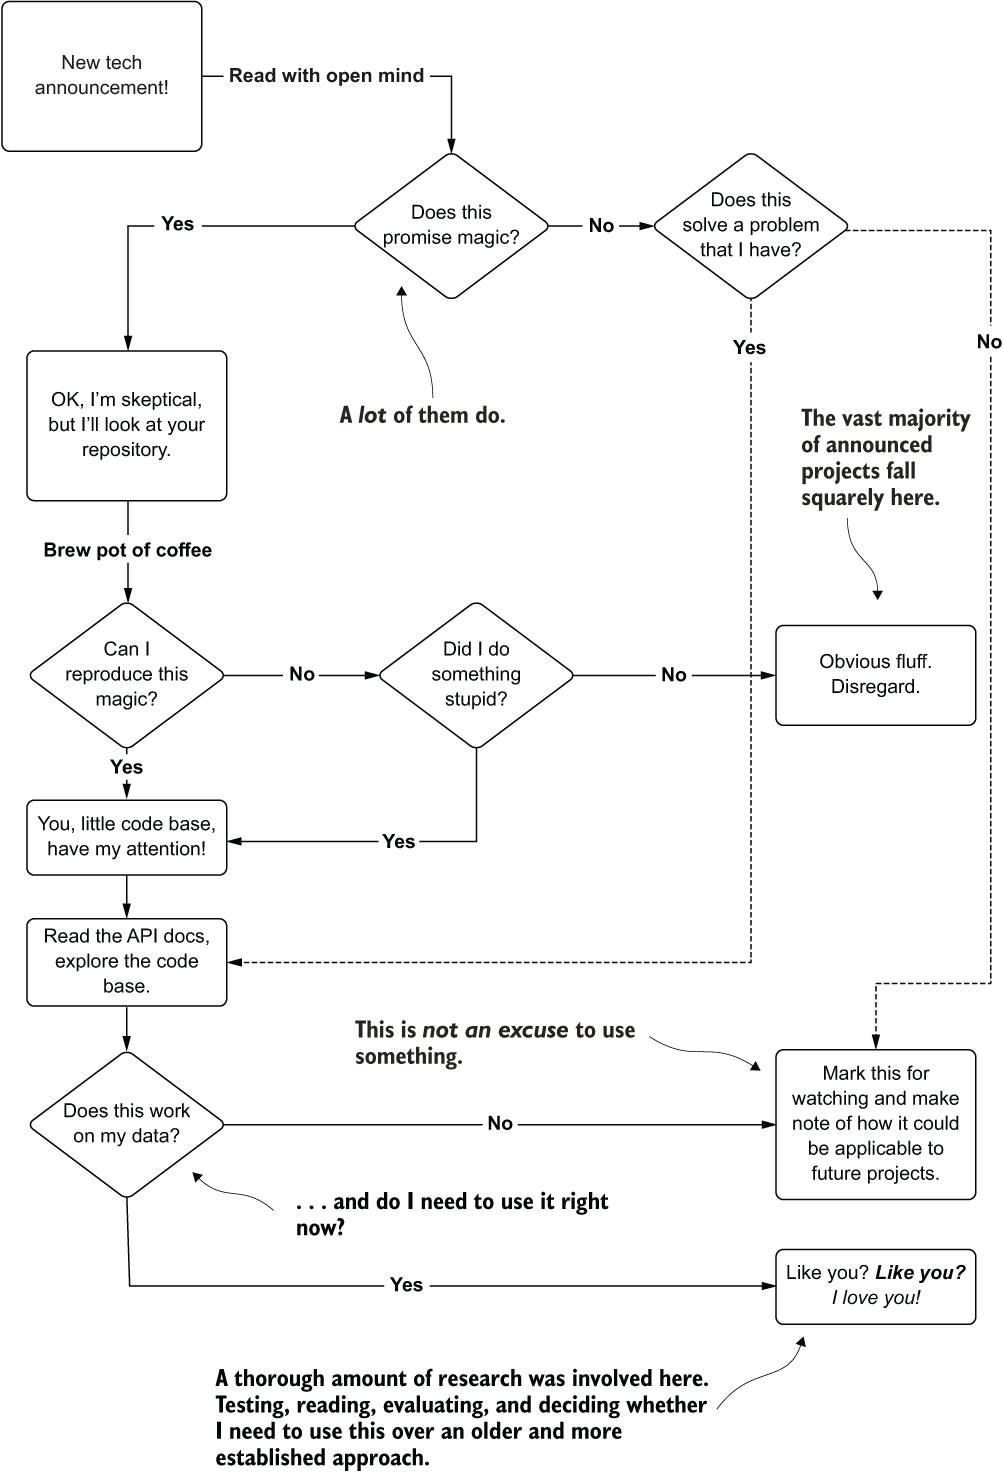
Figure 14.18 My process for evaluating newly announced ML technology
I try to do my due diligence when evaluating new things that are announced in the field of ML. With the rapid pace of advancements and the seemingly never-ending megaphone-blast of hype coming out of the space, there simply isn’t time to evaluate everything. However, if something does look promising, comes from an established and reputable source, and actually claims to solve a problem that I am struggling with (or have in the past), then it’s a candidate for this rigorous evaluation.
The sad state of affairs is that the vast majority of projects (even those espoused by large and successful tech companies) either never end up gaining community traction or aim to solve a problem that is far beyond the team’s capabilities (or the current state of technology’s capabilities) to be worthy of spending much time on. This becomes dangerous when teams don’t evaluate the tech in the scope of their needs. Even if the technology is super cool and exciting, it doesn’t mean that it’s the right thing for your company to be using. Remember, using new tech is a high-risk activity.
Sticking to the simplest approach doesn’t mean using the “new hotness.” It means using the new hotness if, and only if, it makes your solutions easier, more maintainable, and easier to keep running. Everything else is, either to you or to everyone else in general, just fluff.
Summary
- Thoroughly vetting the provenance, characteristics, and properties of any data being considered for use in a model should be conducted before attempting to utilize it in a model. Time spent confirming its utility early on will save many frustrating investigations later in a project.
- Any data that is going to be used for an ML solution needs to be monitored fully with abnormalities handled in a predictable way. Unexpected behavior based on changes to both training and inference data can easily render a solution useless.
- Monitoring feature data is essential, but it is only one part of the model life cycle that should be watched. From ETL ingestion, to feature engineering, model training, model retraining, prediction, and attribution, each stage has metrics that should be collected, analyzed, and alerted upon if their behavior is unexpected.
- Focusing on simplicity in design and implementation, an ML project will get to production sooner, be easier to maintain, and likely cost far less, leaving any DS team free to solve additional problems that bring value to a company.
- By using a standard architecture for ML project code bases, refactoring can be kept to a minimum throughout development, team members can readily understand where abstracted logic resides, and maintenance will be far easier than if using custom designs for each project.
- Ensuring that any new technology that you take on as part of your repertoire is applicable to your team, your projects, and your company will help make all ML project work more sustainable and reliable. Evaluation, research, and skepticism will all benefit you.