
Chapter 16. Optimizing Your .NET 2.0 Code
IN THIS CHAPTER
- Understanding Boxing and Unboxing
- Using Proper String Manipulation Techniques
- Efficient Loop Construction
- Speeding Up Application Start Times
- Code Profiling Using the Performance Wizard
As you will see throughout this book, you can increase the performance and scalability of Windows Forms, Web Forms, and web services in many ways. This chapter focuses on the things that you can do at the Framework level that can help optimize any code that you write, regardless of the target platform. You will see some habits that are easy to adopt that will help keep your application running smoothly and quickly, as well as a tool that can be used to speed up the application launch process and a tool that can be used to analyze an existing code base and point out a wide variety of potential performance problems.
Understanding Boxing and Unboxing
Early in this book, you learned about the difference between value types and reference types. A value type is a type in which the corresponding data is always contained within the variable of that type and is passed as method parameters on the stack. A reference type corresponds to what developers of unmanaged code might refer to as a pointer. A variable that represents an instance of a reference type doesn’t contain the raw data. Rather, it contains information about where to find the raw data within the managed heap.
Every time a method is invoked, the stack is built and then deconstructed in order to get at the parameter data. As a result of this, as a general rule, developers should avoid creating value types that are very large, to keep stack operations running as quickly as possible.
One aspect of value and reference types that hasn’t been mentioned yet is the concept of boxing and unboxing. When a value type needs to be treated as though it were a reference type, the value type is Boxed.
Boxing is the process by which the data for a value type is placed on the managed heap and then a pointer to that data is used as the contents of the newly created reference type instance. For example, the following lines of code illustrate the use of boxing:
object o = 21; // boxing operation occurs, "21" becomes reference
int z = 42; // no boxing here, all value type operations
object y = z; // boxing operation occurs, "z" becomes reference
The process of boxing a variable takes time because new space needs to be allocated on the managed heap for the variable that would otherwise remain in the relatively fast stack. Then, when the boxed variable is no longer needed, that same space needs to be reclaimed by the garbage collector, further reducing performance.
Conversely, when a boxed value type (value contained in a reference) needs to again be treated as a value type, the value needs to be retrieved from the managed heap and placed on the stack. This process is called unboxing and also incurs an overhead cost.
If you write your code in such a way that you avoid boxing and unboxing, especially within loops, you will find that your code performs faster. Although the occasional use of boxing or unboxing won’t drag your application down, large loops that use boxing inside frequently invoked methods in large, multiuser applications can definitely have a negative impact on performance.
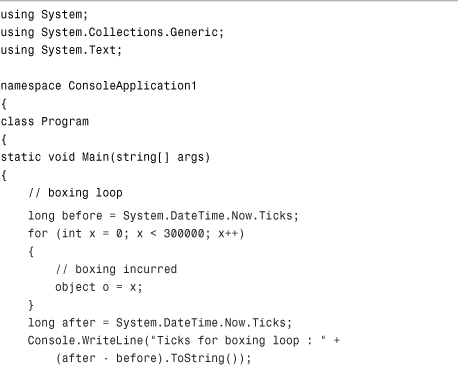
The code in Listing 16.1 uses the Ticks property of a DateTime instance to show the difference in execution time for a 300,000-iteration loop with and without boxing. On the author’s machine, the boxing loop took 156,250 ticks, whereas the loop that did not use boxing took place in less than 1 tick. Although that still is a small amount of time on its own, when you attempt to scale that out to a method that is being invoked thousands of times per minute by thousands of users on a large application, the difference in time will become quite noticeable.
Listing 16.1 Timing Boxing Operations
The general rule of thumb is to treat value types as value types unless you absolutely cannot avoid it. In previous versions of the .NET Framework, there were many scenarios where an int would have to be passed as an object in order for a class to be able to work with multiple data types. You can use generics in these situations so that, at runtime, the value type will be treated as a value type and will not incur the boxing overhead.
Using Proper String Manipulation Techniques
Within the .NET Framework, strings are immutable. This means that a string cannot be changed after it has been created. For example, suppose you create a string as follows:
String x = "Hello World";
The string “Hello World” appears on the managed heap and x contains a reference to that string. To optimize the CLR, strings were made immutable. Examine the following three lines of code:
String x = "Hello World";
x += " from ";
x += " C# 2005 Unleashed by SAMS Publishing";
Developers with experience in other languages might expect that the x variable is initialized with “Hello World” and then is dynamically expanded twice to first add " from " and then add the remaining string literal.
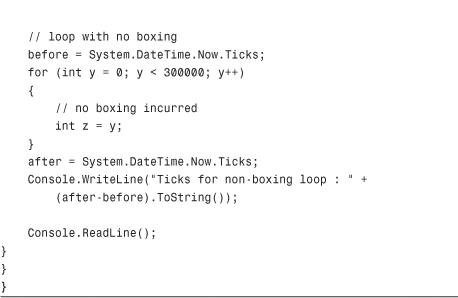
Here’s what actually happens: Three different strings are created on the managed heap, and each time a new one is created, the x variable shifts to point to the newly created string. Because strings are immutable, any change to an existing string creates a new string stored on the heap. Interim strings that are out of scope (such as " from ") will eventually be collected by the garbage collector. Figure 16.1 illustrates what happens to the managed heap as a string is concatenated using the += operator.
Figure 16.1 String concatenation on the managed heap.
To avoid the problems that arise from repeated string concatenation using the += operator, you should instead use the StringBuilder class, as shown in the following example:
StringBuilder sb = new StringBuilder();
sb.Append("Hello World");
sb.Append(" from ");
sb.Append("C# 2005 Unleashed by SAMS Publishing");
The StringBuilder class also has an AppendFormat method that allows you to format a string at the same time it is being appended, which comes in handy. To access the string within the StringBuilder, simply use the ToString() method as shown:
Console.WriteLine(sb.ToString());
Efficient Loop Construction
Performance problems that might appear small or insignificant can swell to application-crippling sizes when those problems are executed within a loop or are executed by hundreds or thousands of users simultaneously. Loops act like a magnifying glass for small performance problems and can make them considerably larger.
One of the most common loop mistakes is in invoking an additional cost during loop iterations. Take the following loop for example:
for (int x=0; x < myObject.GetItems().Count; x++)
{
// perform task
}
There are two main problems with the preceding loop:
- The maximum bound of the loop could be changed by the code within the loop, creating unpredictable results. For example, if the code within the loop adds an item to the list of items returned by
myObject.GetItems(), the loop could end up being infinite or running for longer than expected. - The call to
GetItems()could potentially take a long time. Placing this call within theforstatement invokes this method during every single loop iteration. IfGetItems()not only takes a long time to execute but returns a large number of items, the loop could take an extremely long time to execute.
A better way to rewrite the preceding loop would be to place the GetItems() call at the beginning of the loop to guarantee consistency in the list of items as well as to incur the overhead cost of the method only once rather than once per iteration:
List<CustomObject> list = myObject.GetItems();
int maxBound = list.Count;
for (int x=0; x < maxBound; x++)
{
// perform task on 'list' variable
}
Even accessing the Count property of a list still costs more than accessing a previously defined int variable. The preceding code might have more lines than the first example, but this code runs faster. By pulling expensive calculations out of the loop and performing them before the loop begins, you incur the cost only once instead of once per iteration. In terms of computer science notation, the cost of the GetItems() method is “O(N)” (operational cost is directly related to the number of items in the loop) when placed inside the loop, and “O(1)” (operational cost only incurred once) when placed before the loop.
Speeding Up Application Start Times
When a .NET application is first loaded, the JIT (Just-in-Time) compiler takes the MSIL (Microsoft Intermediate Language) code that is contained within the assembly and compiles that code into a native image. That native image is then stored in the native image cache to be used for subsequent application executions so that the JIT step can be skipped.
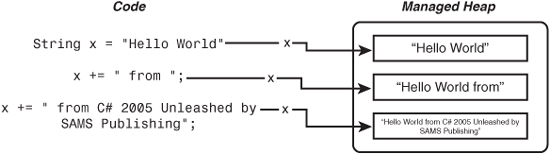
When you use the Microsoft CLR Native Image Generator tool (NGen.exe), it will manually perform the initial native image generation so that the application will load faster the first time it is executed. When you run the Ngen tool against a .NET application, you get output that looks something like this:
Application developers often include execution of Ngen.exe upon initial installation to generate the native image and place it in the native image cache so that the application will start more quickly.
Code Profiling Using the Performance Wizard
Code profilers are an often-underrated tool when in fact they can be one of the most powerful tools a developer can possess. Profilers sift through the code and record thousands of data points that are then turned into useful information for the developer. For example, code profilers can show you which method took the most time to execute within the entire application, what variable consumed the most memory, and which operations were the most costly. When developers get into the habit of running a profiler on their code, they will be able to find and correct many performance problems that might not otherwise be immediately obvious.
Visual Studio 2005 has several editions that come with a built-in code performance analyzer. You can get to this performance analyzer by launching the Performance Wizard from the Performance Tools menu under the Tools menu.
To see the Performance Wizard in action, first create some code that does something that is quite obviously a performance problem. The code in Listing 16.2 represents a quick console application that will definitely cause some blatant results in a code profiler.
Listing 16.2 Inefficient Use of String Concatenation and Looping
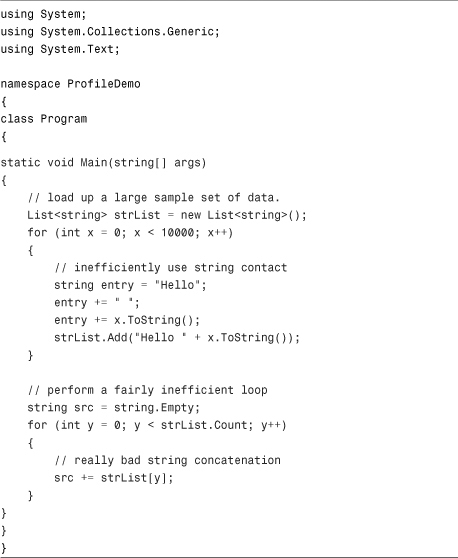
You have already seen that string concatenation within a loop can cause a massive waste of space on the heap. After running the profiler, you will see exactly how much space is wasted. To launch the profiler, first build the application and then launch the Performance Wizard from the Performance Tools menu. At the prompt, select the default project for the target (the project you created for this sample) and choose the Sampling method of analysis. This will create a new performance session. To run the analysis and get results, click the Launch button in the Performance Explorer panel that appeared after creating the session.
When the analysis is complete, a new file with the extension .vsp will be added to your solution. This file is a report that contains several tabs.
Click on the Call Tree tab. From this tab, shown in Figure 16.2, you can see that string concatenation accounted for roughly 96% of the work done by the application.
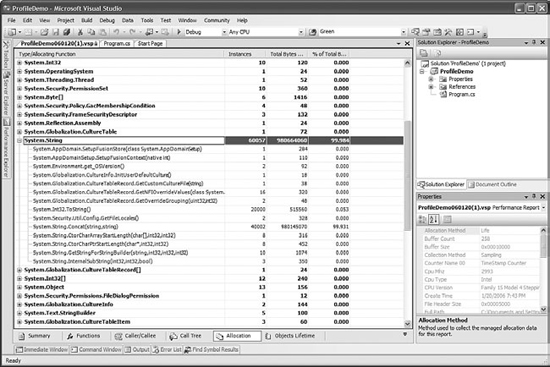
Next, click on the Allocation tab and you will see a list of the bytes allocated for every single type used in the application, as shown in Figure 16.3. Something really troubling in this figure is that the results of string concatenation were responsible for 99.93% of all allocation within the application; 930MB worth. Even though there were only 10,000 strings in the list, 40,002 instances of strings were created as a result of string concatenation.
Figure 16.2 The Call Tree tab of a performance report.
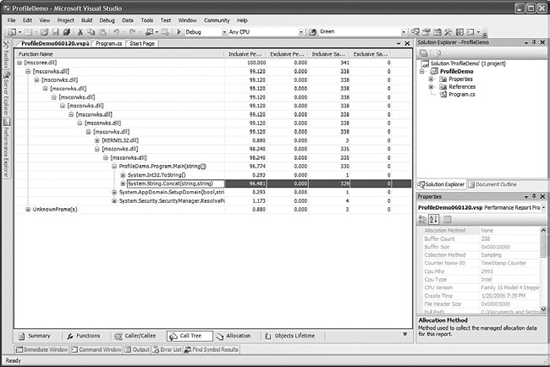
Figure 16.3 The Allocation tab of a performance report.
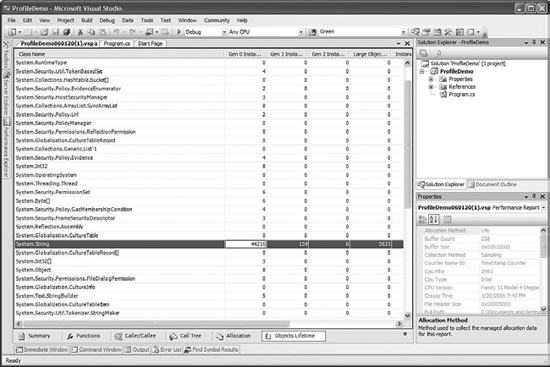
Finally, click the Objects Lifetime tab of the report. This shows you how long objects resided in memory categorized by what the garbage collector refers to as generations. A generation is a group of objects with similar uncollected lifetimes. When the garbage collector does a pass through the heap looking for objects to dispose, Generation 0 objects will be disposed immediately. Objects that could not be disposed will be moved to Generation 1 to be disposed later. Finally, if an object cannot be disposed from within Generation 1, it is moved to Generation 2. In order to keep the performance of the garbage collector at a maximum, you want to aim to keep as many of your objects as possible in Generation 0. Figure 16.4 shows that roughly 44,000 strings were Generation 0 objects, 159 lasted long enough to make it into Generation 2, and 5,633 objects were considered “large objects” by the garbage collector.
Figure 16.4 The Objects Lifetime tab of a performance report.
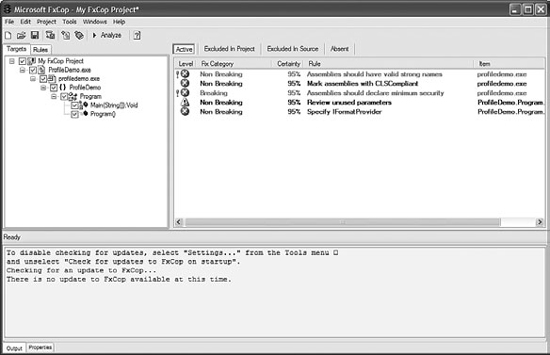
In addition to performance profiling, you can also use another tool provided by Microsoft that actually validates your code against more than 200 rules of design dictated by the .NET Framework design guidelines. This tool is called FxCop and you can download it from Microsoft. Figure 16.5 shows a screenshot of FxCop after analyzing the preceding code for failures to comply with standard .NET Framework application design guidelines.
Using FxCop and the Visual Studio Performance Wizard, you can get a blueprint of how your application is performing and how well it conforms to accepted .NET Framework design guidelines and best practice rules. Both of these tools should be used regularly by developers to maximize the efficiency and design guideline conformance of their applications.
Figure 16.5 FxCop in action.
Summary
This chapter has provided you with an overview of some of the techniques that you can use to increase the performance of your code regardless of whether you are building Windows Forms, Web Forms, or even console applications. This chapter discussed the concepts of boxing and unboxing as well as the proper techniques to be used when looping and manipulating strings. This chapter also contained an overview of some tools that you can use to speed up your application, such as NGen.exe, and tools that can recommend ways to increase performance and enhance conformance to design guidelines, such as the Visual Studio Performance Wizard and FxCop.