2.2. Explosion
The term “explosion” is used to describe a rapid release of energy. The energy released in an explosion is normal from chemical energy, fluid expansion energy, or vessel strain energy. Damage caused by explosions varies according to different energy dissipation mechanisms, such as a pressure wave, projectiles, thermal radiation, and acoustic energy. Taking overpressure as an example, 5–7 psig (pounds per square inch gauge) will nearly cause complete destruction of houses (Clancey, 1972).
This section first briefly introduces basic concept about explosion, for example, classification and characterization of explosion, deflagration, and detonation. Then it demonstrates some models for explosions caused by different energy types, explosion types, and explosion damage. Finally, it presents several ways to prevent explosion.
Table 2.1
Parameters Significantly Affecting the Behavior of Explosions (Crowl and Louvar, 2011)
| Parameter | Description |
| 1 | Ambient conditions (pressure and temperature) |
| 2 | Composition of explosive material |
| 3 | Physical properties of explosive material |
| 4 | Nature of ignition source: type, energy, and duration |
| 5 | Geometry of surroundings: confined or unconfined |
| 6 | Amount of combustible material |
| 7 | Turbulence of combustible material |
| 8 | Time before ignition |
| 9 | Rate at which combustible material is released |
Although extensive efforts, including theoretical, semiempirical, and empirical studies have been undertaken toward explosion (Stull, 1977; Baker et al., 1983; Crowl, 2010), it is difficult to characterize explosion behaviors. Based on previous research, Crowl and Louvar summarized some parameters significantly affecting the behavior of explosions as stated in Table 2.1.
2.2.1. Deflagration and Detonation
There are two kinds of explosion from combustion of flammable gas: deflagration and detonation. The criterion to distinguish them is to compare the reaction front propagation speed with the speed of sound in the unreacted gases. Assuming the unreacted gases as ideal gases at 20 °C, it is a detonation if the reaction front propagation speed is faster than 344 m/s; otherwise, it is a deflagration. Figure 2.3 demonstrates the physical differences between a detonation and a deflagration (Crowl and Louvar, 2011). In a detonation, the reaction front moves faster than sound, driving the shock front immediately preceding it. In a deflagration, the reaction front moves slower than sound, while the pressure front moves away from the reaction at the speed of sound. Accompanied by a strong, sharp overpressure, detonation causes much more catastrophic consequences than deflagration.
A deflagration can evolve into a detonation by continuously offering energy to pressure waves. This is called a deflagration to detonation transition (DDT). DDT is now one of major unsolved problem in theoretical combustion theory. It is a complicated process, involving highly nonlinear interactions among flames, shocks, boundary layers, and turbulence (Oran and Gamezo, 2007). Several theoretical and numerical efforts were made to understand the DDT. For example, computational analysis of shock–flame interactions was performed in acetylene–air, ethylene–air, ethylene–air, and hydrogen–air with one, two, or three dimensions. Oran and Gamezo state that “hot spots” created by a series of shock–flame interactions will produce a detonation through the Zeldovich gradient mechanism. Figure 2.4 demonstrates time sequence of density fields showing the overall evolution of a Mach 1.5 incident shock interacting with a low-pressure acetylene–air flame.
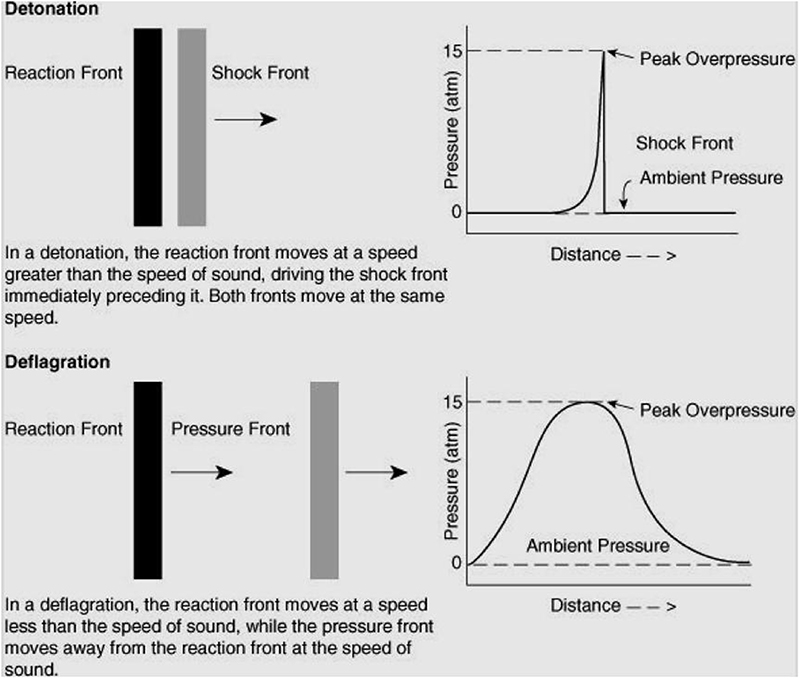
Figure 2.3 Comparison of detonation and deflagration gas dynamics (Crowl and Louvar, 2011).
2.2.2. Explosion Energy
The energy released from an explosion normally comes from chemical energy, mechanical energy, or nuclear energy. The former two are much more common and will be discussed here in more detail.
2.2.2.1. Energy of chemical explosions
Kinney and Graham (1985) discussed that the energy quantities characterizing a high explosive are the energy of explosion, the heat of explosion, and the heat of combustion. The energy of explosion is necessary to estimate the effects of an explosion:
 (2.37)
where P is the absolute pressure, V is the volume, and W is the work of expansion. However, it is difficult to evaluate the integral. This equation is simplified by using the following relationship (Moore, 1962):

Figure 2.4 Time sequence of density fields showing the overall evolution of a Mach 1.5 incident shock interacting with a low-pressure acetylene–air flame (Oran and Gamezo, 2007).
 (2.38)
In many situations, the Gibbs free energy is used instead of the Helmholtz free energy due to the limited availability of data on the Helmholtz free energy and because of the small difference between Gibbs and Helmholtz free energy.
The heat of explosion corresponds to the internal energy change for the explosion:
![]() (2.39)
(2.39)
where  is the standard heat of formation for products, and
  is the standard heat of formation for reactants.
For chemical explosions, energy comes from thermal heating of the reaction products and the change in the total number of moles by reaction. Usually, the change in the total number of moles is very small and can be ignored. Taking the combustion of propane in air as an example:
![]()
The initial total number of moles is 24.8, while the final total number of moles is 25.8. Therefore, the energy released from the reaction can be easily calculated by using heat of combustion.
2.2.2.2. Energy of mechanical explosions
Energy of mechanical explosions usually comes from a pressurized gas. For different situations, four methods can be used to estimate the energy released.
Brode's equation (Brode, 1959)
It determines the energy required to raise the pressure of the gas at constant volume from atmospheric pressure to the final gas pressure, also known as the difference in the internal energies of the gas. Since the internal energy is:
![]() (2.40)
(2.40)
The Brode equation is:
![]() (2.41)
(2.41)
where E is the energy of explosion, P1 is the ambient pressure, P2 is the final pressure, V is the volume, and γ is the heat capacity ratio for the gas:
![]() (2.42)
(2.42)
where Cp is the heat capacity at constant pressure, and Cv is the heat capacity at constant volume.
Isentropic expansion
This determines the energy released by the gas expanding isentropically. Baker's equation (Baker, 1973) is based on the work done on the surroundings in an isentropic expansion:
![]() (2.43)
(2.43)
where E is the energy of explosion, and 1 and 2 denote the initial and final conditions. During an isentropic expansion:
![]() (2.44)
(2.44)
Therefore, the energy released during an isentropic expansion can be expressed as:
 (2.45)
Isothermal expansion
This expression determines the energy released by the gas expanding isothermally. Kinney's equation (Kinney, 1962) is based on work done on isothermal expansion:
![]() (2.46)
(2.46)
where Rg is the ideal gas constant, n is the number of moles, and subscripts 1 and 2 denote the initial and final conditions.
Thermodynamic availability
The thermodynamic availability represents the maximum mechanical energy available. After analyzing batch thermodynamic availability, Crowl (1992) obtained the following equation to predict the maximum amount of energy that can be released from a gas contained within a vessel:
![]() (2.47)
(2.47)
2.2.3. Explosion Types
Lees classified explosions in the process industries into the following types (Mannan, 2005):
1. Physical explosion: The catastrophic rupture of a pressurized gas/vapor–filled vessel by means other than reaction, or the sudden phase-change from liquid to vapor of a superheated liquid (CCPS, 1994).
2. Condensed phase explosion: An explosion that occurs when the material is present in the form of a liquid or solid (CCPS, 1994).
3. Vapor cloud explosion (VCE): The explosion resulting from the ignition of a cloud of flammable vapor, gas, or mist in which flame speeds accelerate to sufficiently high velocities to produce significant overpressure (CCPS, 1994).
4. BLEVE: A type of rapid phase transition in which a liquid contained above its atmospheric boiling point is rapidly depressurized, causing a nearly instantaneous transition from liquid to vapor with a corresponding energy release. A BLEVE is often accompanied by a large fireball if a flammable liquid is involved, because an external fire impinging on the vapor space of a pressure vessel is a common BLEVE scenario. However, it is not necessary for the liquid to be flammable for a BLEVE to occur (CCPS, 1994).
5. Confined explosion with reaction: An explosion of fuel–oxidant mixture inside a closed system (e.g., vessel or building).
6. Vapor escapes into and explodes in buildings (VEEBs).
7. Dust explosion.
New types of explosion such as aerosol explosion should be taken into consideration as well. The following sections discuss three types of explosions: VCEs, BLEVEs, and dust explosions.
2.2.3.1. Vapor cloud explosion
A VCE occurs when the combustion of a cloud of flammable vapor gives rise to an overpressure. Many of the lethal incidents in the chemical industry have resulted from VCEs, for example, the explosion at the Flixborough plant in 1974, the Piper Alpha explosion in 1988, and the Texas City explosion in 2005.
Work on fundamental models has been described by a number of authors (Taylor, 1946; Kuhl et al., 1973; Strehlow, 1975, 1979; Gugan, 1979; Wiekema, 1980; Baker et al., 1983; Van den Berg, 1985; Williams, 1985). Other work has been directed to the correlation of experimental results and to the development of semiempirical models (Van Wingerden et al., 1989, 1990, 1994). As described by Van den Berg (1985), the TNT (trinitrotoluene) equivalent model has been widely applied to VCEs. In this empirical model, the explosion is taken to be equivalent to that of a TNT explosion with the same energy of explosion. The basic TNT equivalent model was proposed by Brasie and Simpson (Brasie and Simpson, 1968), and the expression was written as:
![]() (2.48)
(2.48)
where ETNT is the energy of explosion of TNT (kJ/kg), ΔHc is the heat of combustion of the hydrocarbon (kJ/kg), W is the mass of hydrocarbon (kg), WTNT is the equivalent mass of TNT (kg), and α is the yield factor.
Brasie and Simpson (1968) obtained values of the yield factor α of 0.03–0.04 by analyzing three VCE incidents and proposed the value to be 0.02–0.05, which is widely used now. Harris and Wickens (1989) also present a TNT equivalent model. In this model, the mass of gas participating in the VCE is restricted to the confined and congested part of the plant. This model is expressed as
![]() (2.49)
(2.49)
where Egas is the heat of the hydrogen. ETNT is the energy of explosion of TNT, Mgas is the mass of gas (in the confined/congested region), MTNT is the mass of TNT, and α is the yield factor.
By taking 
![]() (2.50)
(2.50)
Assuming the density of the hydrocarbon–air mixture is 0.08 kg/m3, the equation becomes
![]() (2.51)
(2.51)
Based on explosion experiments, Baker (1973) found that the overpressure can be estimated using an equivalent mass of TNT:
![]() (2.52)
(2.52)
where ze is the scaled distance (m), and R is the actual distance (m).
From Figure 2.5, for every scaled distance, a corresponding “side-on” overpressure can be found. The correlation can also be expressed as
 (2.53)
where P0 is the peak side-on overpressure, and Pa is the ambient pressure.
Harris and Wickens (1989) found that the peak overpressure at the edge of the vapor cloud is 4 bar, and the scaled distance of an overpressure of 4 bar on Figure 2.5 is 16 (m/te1/3), the authors proposed the use of an effective scaled distance of
![]() (2.54)
(2.54)
where ze is the scaled distance (m), and R is the actual distance (m).
2.2.3.2. Boiling liquid expanding vapor explosion
A BLEVE is defined by the CCPS as an explosion resulting from the failure of a vessel containing a liquid at a temperature significantly above its boiling point at normal atmospheric pressure (CCPS, 1994).
Abbasi and Abbasi published a literature survey on BLEVE (Abbasi and Abbasi, 2007) and detailed the typical BLEVE sequence of events in a few steps, as shown conceptually in Figure 2.6 (Laboureur et al., 2012). A BLEVE happens when a reservoir filled with liquid is submitted to an aggression that results in the reservoir rupture. Based on a compilation of 88 BLEVE events that occurred in the world since 1926, Abbasi and Abbasi (2007) identified the two major causes of BLEVE rupture as fire or mechanical damage. When the reservoir releases due to rupture, the vapor expands and the liquid becomes superheated, triggering the liquid boiling. This phenomenon has three major consequences: formation and evolution of a fireball, generation and propagation of a blast wave, and fragment projection. In this section, the propagation of blast wave is discussed.
A blast wave is produced when a pressure vessel ruptures due to the rapid expansion of the contents of the vessel. As opposed to a gas reservoir rupture, in a BLEVE, flash vaporization occurs in addition to vapor expansion. Blast wave signals, recorded at different distances from a BLEVE experiment (Van der Voort, M. M., et al, 2012) with 40-l liquid CO2 bottle can be observed in Figure 2.7; however, the physical justification of the different peaks (i.e., whether the peaks are due to the vapor expansion, the flash vaporization or both) is still not understood.
In the literature, most blast wave models focus on the prediction of the first peak amplitude, and generalized thermodynamic models are used to predict overpressure. The procedure first consists of calculation of expansion energy based on the change in thermodynamic state of the substance stored in the vessel from the initial state to the final state. The initial state is the moment before the explosion and final state is where the fluid is at boiling temperature and atmospheric pressure. The expansion energy (E) can be expressed differently depending on the model, but all the models use it in the calculation of a scaled distance. This scaled distance can be expressed as Sach's scaled distance, associated with the distance from the source and the atmospheric pressure, as defined in Eqn (2.55). The peak side-on overpressure or the positive impulse can then be finally evaluated based on scaled peak or impulse overpressure curves (see Figure 2.8, right).
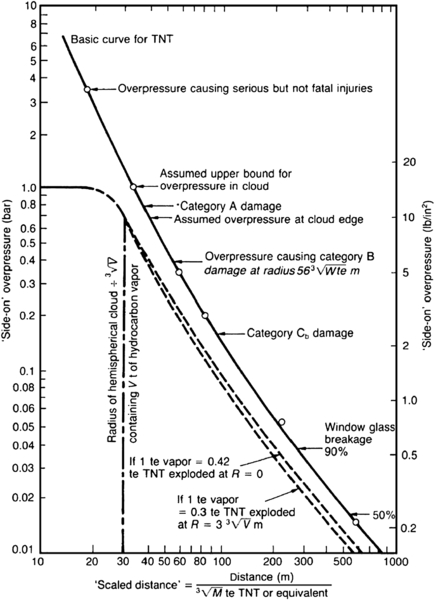
Figure 2.5 Correlation between scaled distance and explosion peak side-on overpressure (Harvey, 1979).
Figure 2.6 BLEVE principle (Laboureur et al., 2012).
Figure 2.7 Overpressure–time records observed at 1, 2 and 3m distance from a BLEVE experiment (Van der Voort, M. M., et al, 2012) with 40-l liquid CO2 bottle.

Figure 2.8 Overpressure graphs. Left: TNT equivalent (Silvestrini et al., 2009). Right: Sach's scaled distance (Van Den Bosh and Weterings, 1997).
 (2.55)
![]() (2.56)
(2.56)
In a literature review of the expansion energy models (Abbasi and Abbasi, 2007; Laboureur et al., 2013), Laboureur et al. listed three models based on Sach's scaled distance: the Yellow Book of TNO (Van Den Bosh and Weterings, 1997), Roberts (2000), Genova et al. (2008), and four other models based on the TNT equivalent mass scaling: Prugh (1991), Planas-Cuchi et al. (2004), Casal and Salla (2006), and Birk et al. (2007).
The TNO method (Van Den Bosh and Weterings, 1997) models differentiate the expansion energy of the liquid and vapor phases, as expressed in Eqn (2.57). For each phase, the energy is defined as the product of the fluid phase mass with the difference in internal energies, assuming an isentropic expansion. The total expansion energy is then multiplied by a factor related to the geometry of the reservoir (generally a factor of 2 for ground effect). A special procedure for the calculation of the overpressure in near field has been developed by the TNO and is detailed elsewhere (Birk et al., 2007).
![]() (2.57)
(2.57)
The TNO method was improved (Roberts, 2000) by considering that at the final state, a part of the liquid has flashed to vapor; both phase fractions were calculated from ratios of entropy differences. Finally, Genova et al. (2008) assumed that the expansion energy is mainly due to the liquid flash as a thermal phenomenon, related to excess of heat stored in the liquid. The expansion energy was modeled as Eqn (2.58), where β is an empirical coefficient, set to 7% following a comparison with experimental results.
![]() (2.58)
(2.58)
Based on the literature review of the models based on a TNT equivalent mass, Prugh (1991) first defined the expansion energy by assuming an isentropic expansion and an ideal gas behavior expressed in Eqn (2.59). The volume V∗ used in Eqn (2.59) is the sum of the vapor volume and the volume occupied by the flashed fraction of liquid (see Eqn (2.60)).
 (2.59)
![]() (2.60)
(2.60)
Planas-Cuchi et al. (2004) stated that modeling the expansion energy as an isentropic expansion leads to an overestimation. They proposed that the real expansion energy ranges between the energy based on an isentropic expansion (U) and the energy based on an adiabatic and irreversible expansion where the only work performed is the one associated with the variation of volume (V). Iteration on the final vapor fraction that satisfies Eqn (2.61) is therefore needed. The expansion energy from both the Prugh and Planas-Cuchi models is multiplied by a factor of 0.4 for ductile failure or 0.8 for brittle failure; taking into account that a part of this energy is transformed into kinetic energy that propels the reservoir fragments.
![]() (2.61)
(2.61)
Casal and Salla (2006) defined the liquid superheating energy (SE) as the difference between the enthalpy of the liquid prior to rupture and the enthalpy of the liquid at the saturation temperature at atmospheric pressure. The expansion energy is then modeled as a fraction of the SE: 5% if an irreversible expansion is considered or 14% for an isentropic expansion. Finally, Birk et al. (2007) concluded, based on analysis of medium-scale experiments, that the liquid part does not contribute to the blast wave generation. Their new model is based on the TNO model but uses only the vapor part to calculate the expansion energy.
Laboureur et al. (2013) compared the overpressure models reviewed here with different scales of experiments published in the literature, involving a few tens of grams to a ton. From the different scale comparisons, the models of Genova and Casal with an irreversible expansion were found to fit the best the measured overpressures, whatever the reservoir scale, as observed in Figure 2.9. But these two models underestimate the predicted overpressure for some of the experiments, and if a conservative approach is preferred, the model of Prugh should be chosen. These models estimate the side peak overpressure. The final overpressure was measured as lower, especially for reservoirs with a large length-to-diameter ratio.

2.2.3.3. Dust explosion
In addition to gases, combustible dusts can cause disasters. Combustible dusts are defined as “a combustible particulate solid that presents a fire or deflagration hazard when suspended in air or some other oxidizing medium over a range of concentrations, regardless of particle size or shape” (NFPA, 2002). Five elements are required to produce conditions conducive for a dust explosion: combustible dusts, confined area, oxygen, ignition source, and suspended cloud. Nagy and Verakis (1983) present plots showing that explosion characteristics are influenced by chemical composition, particle size, moisture content, oxygen concentration, inert gas, and admixed dust concentration. Also, other features in the dust explosion system, such as particle shape, dispersion method, agglomeration, ignition source, confinement, and so on, may also be critically important for dust explosion mechanism as well as in determining the overall explosion process (Cloney et al., 2014). Correspondingly, an organizational framework for studying dust explosion phenomena is developed by combining two factors: the pseudo-geometric scales and the evolution of the physical process, as shown in Figure 2.10.
In Figure 2.10, evolution of the physical process is identified as dust/oxidant, dispersion, ignition, flame propagation, and system interaction based on dust explosion development, while the pseudo-geometric scale is labeled from 1 (smallest scale) to 5 (largest scale) based on geometric scales: molecule (<1 nm); subparticle (1 nm to 1 μm); particle (1 μm to 1 mm); laboratory testing (1 mm to 1 m); device scale (1 m to 10 m); and plant scale (10 m to 1 km). For example, the parameters of the smallest scale, leveled as 1, varies from molecular level (thermal conductivity) to subparticle level parameters (chemical composition). Currently, researchers tend to simplify dust explosion as two-scale phenomena: subsystem scales and system scales or particle scale and cloud scale (Bind et al., 2012).

Figure 2.10 Organizational framework map for dust explosion model development based on evolution of the physical process (columns, left to right) and on pseudo-geometric scale (labeled: smallest scales (1) to largest scales (5)) (Cloney et al., 2014).
To estimate explosibility of various dust explosion scenarios, different methodologies are suggested to apply to different dust explosion systems and explosibility characteristics. Important explosibility characteristics of dust suspensions are (Mannan, 2005):
1. Explosibility classification
2. Minimum ignition temperature (MIT)
3. Minimum explosive concentration (MEC)
4. Minimum ignition energy (MIE)
5. Maximum permissible oxygen concentration to prevent ignition
6. Explosion pressure characteristics
a. Maximum explosion pressure (Pmax)
b. Maximum rate of pressure rise [(dp/dt)max]
c. Average rate of pressure rise
Some explosibility characteristics only describe the very initial steps in dust explosion without involving flame propagation. For these explosibility characteristics, for example, MIT, MEC, and MIE, it is more practical to treat the dust explosion system as an equilibrium system with mass balance, energy balance and relevant particle properties. However, for explosion pressure characteristics, Pmax and (dp/dt)max, mechanisms are much more complicated. Therefore, the two-scale method is most widely used for traditional dust particles.
For non-traditional dust particles, especially nanoparticles, features at molecular, micro-scale, and meso-scale are more important than those for traditional dust particles (Worsfold et al., 2012). Therefore, it will be very informative to investigate mechanisms at multi-scale. While these research efforts are currently limited, this section will discuss the explosibility of traditional dust particles.
Explosibility classification
Dust explosion characteristics can be stated by the cubic law.
![]() (2.62)
(2.62)
where KSt is the deflagration index for dust, (dP/dt)max is the maximum pressure increase rate during the explosion, and V is the volume of explosion development. The cubic law for dust explosion basically states that for the same dust of identical concentration, the same deflagration index will be obtained regardless of the volume of the confined area. The stronger the explosion, the higher is the deflagration index, and, depending on the value of the deflagration index, dusts are classified into four classes (Table 2.2).
The main variable involved is the maximum pressure increase rate, which is discussed separately later.
Minimum ignition temperature
MIT is the lowest temperature needed to ignite the dust layer or dust cloud. Ignition occurs when the heat generation by the reaction exceeds the heat losses. It can be determined by following ASTM E1491, Standard Test Method for Minimum Autoignition Temperature of Dust Explosion (ASTM, 2012).
Using an energy balance on a particle
![]() (2.63)
(2.63)
At the ignition temperature, using the “Van't Hoff and Taffanel Le Floch” conditions
 (2.64)
![]() (2.65)
(2.65)
![]() (2.66)
(2.66)
where ΔHcomb is the combustion enthalpy, h is the coefficient of heat convection, dp is the particle diameter, Ts, Tg, and Twall are the temperature of solid, gas, and wall, respectively, ε is the particle emissivity; and σ is the Stefan–Boltzmann constant. By neglecting the radiation term,  , the ignition temperature could be expressed as (Bouillard et al., 2010)
 (2.67)
where Tign is the ignition temperature, ρs is the density of particle, dp is the diameter of particle, Ea is activation energy, ΔHcomb is the combustion enthalpy, τb is combustion, Nu is the Nusselt number, λg is the gas conductivity, and R is the gas law constant. Therefore, the ignition temperature is lower when the density of the particle is lower, the combustion enthalpy is smaller, or the activation energy is lower.
Minimum explosive concentration
MEC is the minimum concentration of dust needed to cause an explosion. It is determined according to ASTM E 1515, Standard Test Method for Minimum Explosible Concentration of Combustible Dusts (ASTM, 2007a). Usually, when the particle size decreases, the volatile matter content, oxygen concentration, moisture content, and admixed inert dust concentration increase, and the MEC decreases.
The influence of the particle size on the MEC has been studied (Eckhoff, 2003). Based on Jaeckel's theory (Jaeckel, 1924) and “Van't Hoff and Taffanel Le Floch” conditions, the MEC is defined as:
![]() (2.68)
(2.68)
where Cpg is the heat capacity of the gas, ρg is the density of the gas, Tu is the temperature of the unburnt gases, Cps is the heat capacity of solid, Tign is the ignition temperature, Qlost is the radiation and convection heat loss, X is the reaction conversion, and ΔHcomb is the combustion enthalpy.
When the radiation and convection heat losses are neglected, the MEC can be expressed as
 (2.69)
Combined with the previous equation concerning Tign,
(2.70)
Minimum ignition energy
MIE is the energy required to sustain ignition and inflammation at an initial temperature Tu while the burning medium is at a final temperature Tad, the flame adiabatic temperature (Ballal and Lefebvre, 1979; Williams, 1985; Stephen, 2000). It is determined according to ASTM E 2019, Standard Test Method for Minimum Ignition Energy of a Dust Cloud in Air (ASTM, 2007b). Usually, when the particle size decreases and the volatile matter content, oxygen concentration, moisture content, and admixed inert dust concentration increase, the MIE decreases.
According to the definition of MIE, for a sphere with an initial diameter D0 and a final diameter Dc, MIE can be written as
![]() (2.71)
(2.71)
where  are the average density for burnt and unburnt gas, and
  is the average heat capacity.
By considering the mass conservation, it can also be written as
![]() (2.72)
(2.72)
By using the ideal gas law, the relationship between density at a given temperature of burnt gas and unburnt gas can be expressed as
![]() (2.73)
(2.73)
where Mu and Mg are molar weights for the unburnt and burnt gas.
Hence, the MIE can be expressed as:
![]() (2.74)
(2.74)
Explosion pressure characteristics
Explosion pressure characteristics Pmax and (dp/dt)max define the severity of dust explosions. Therefore, properly modeling dust explosions is essential to determine explosion behaviors and help safety system design. A two-scale reaction engineering model was presented and validated for aluminum and starch dust explosions (Bind et al., 2012). In this model, the combustion behavior of the cloud is first defined by the interparticle distance. If the interparticle distance is at least twice the flame radius of the particle, the individual combustion will take place; otherwise, it will be the group combustion or cloud combustion (Annamalai et al., 1994).
Therefore, for aluminum particles, there is little probability that group combustion will occur in case of aluminum particle combustion and the rate of consumption of particle phase could be (Bind et al., 2012):
![]() (2.75)
(2.75)
where α is volume fraction of fuel,  is the surface reaction rate,
  is the volumetric reaction rate, and dp is the particle diameter. can be estimated by incorporating the particle scale dynamics though an appropriate correlation that models the particle scale combustion.
For organic particles, because of the volatile components, the interparticle distance is very small, and the combustion rate is determined by cloud combustion. Then the density-based solver of commercial CFD software Fluent can be used to solve the following equations (Bind et al., 2012):
Continuity:
![]() (2.76)
(2.76)
Momentum:
![]() (2.77)
(2.77)
Energy:
 (2.78)
Species:
![]() (2.79)
(2.79)
where ρ is the cloud density,  is the cloud viscosity, κeff is the efficient cloud thermal conductivity, p is pressure, Yi is the mass fraction of vapor phase of species ‘i’, E is energy, Di,eff is the efficient diffusivity of species ‘i’, T is temperature, h is the coefficient of heat convection, Sh is the entropy, Sc is the Schmidt number, and
  is the efficient shear stress.
This modeling work is validated by experimental data in a 20 L spherical apparatus. However, for a larger explosion tunnel, the geometric layout of explosion confinement is another important factor effecting dust explosion behaviors. Then, computational fluid dynamics (CFD) is also needed to build a three-dimensional (3D) hexahedral mesh of the tunnel (Humphreys et al., 2010).
2.2.4. Explosion Prevention
To prevent or limit the potential damage from explosions, a threefold strategy is used: prevent formation of flammable mixtures, prevent the initiation of explosion, and minimize the damage after an explosion has occurred. This section will mainly discuss some widely used methods to prevent explosions: inerting, controlling static electricity, and ventilation.
2.2.4.1. Inerting
Inerting is a process of reducing the concentration of oxygen below the LOC. LOC is about 10% for gases and 8% for dusts. Usually, an inert gas, such as nitrogen, carbon dioxide, or steam, is added into a combustible mixture. Vacuum purging, pressure purging, combined pressure–vacuum purging, and sweep-through purging can be used in the inerting process.
Vacuum purging
Vacuum status is always reached in a vacuum purging procedure. From the perspective of safety, vacuum purging is only applied to vessels that are designed to withstand vacuum. A typical vacuum purging procedure consists of following steps:
1. Use a vacuum to pump out the gas inside vessels until the pressure reached the lower desired value PL
2. Pump inert gas into the vessel until the higher desired pressure is reached. Usually, the higher pressure is the atmospheric pressure
3. Repeat step 1 and step 2 as many times as needed until the oxygen concentration is below the required value.
The process for vacuum purging is shown in Figure 2.11:
The concentration of oxygen after j purge cycles, vacuum, and relief, yj is calculated as the following equation to estimate the number of repeating cycles needed.
 (2.80)
where PL and PH are the vacuum-purged pressure and the initial pressure, nL and nH are the vacuum-purged and the initial moles of gas, and y0 is the initial oxygen concentration.
The total moles of inert gas added for j cycles, Δninertgas is
![]() (2.81)
(2.81)

Figure 2.11 Vacuum purge cycles (Crowl and Louvar, 2011).
Pressure purging
The pressure purging procedure is very similar to the vacuum purging procedure, except that a pressurized status will be reached during the procedure rather than a vacuum status. Consequently, this method is applied to vessels that can withstand high pressures. Here are the typical steps for pressure purging:
1. Pump inert gas into the vessel until the desired high pressure PH is reached.
2. Then draw a vacuum on the vessel until the lower pressure PL is obtained. Usually, the value of the lower pressure is equal to the atmospheric pressure.
3. Repeat step 1 and step 2 as many times as needed until the oxygen concentration is below the required value.
The process for pressure purging is shown in Figure 2.12.
The same equations as vacuum purging can be used when PL and PH are the initial and pressurized pressures.
Combined pressure–vacuum purging
While the vacuum purging needs less inert gas to reach the desired oxygen concentration than the pressure purging, the pressure purging helps save time for the operating cycles because the pressurized procedure is much faster than the vacuum procedure. In some cases, pressure purging and vacuum purging can be combined to reach a balance between inert gas consumption and time consumption. A combined pressure–vacuum purging consists of the following steps:

Figure 2.12 Pressure purge cycles (Crowl and Louvar, 2011).

Figure 2.13 Vacuum–pressure purging with initial pressurization (left) and vacuum–pressure purging with initial evacuation (right) (Crowl and Louvar, 2011).
2. Vacuum the pressurized system until a low pressure value PL, which should be lower than the atmospheric pressure.
3. Repeat step 1 and step 2 to reach the desired oxygen concentration. For steps 1 and 2, whichever comes first is fine.
The process for combined pressure–vacuum purging is shown in Figure 2.13.
Sweep-through purging
The sweep-through purging is a process of adding inert gas at one opening and withdrawing the mixed gas from another opening. When assuming perfect mixing, constant temperature, constant pressure, and same rate of adding and withdrawing, the material balance around the vessel is
![]() (2.82)
(2.82)
where V is the vessel volume, C is the concentration of oxidant within the vessel (mass or volumetric units), C0 is the inlet oxidant concentration (mass or volumetric units), QV is the volumetric flow rate, and t is time.
The inert gas needed to reduce the oxidant concentration from C1 to C2, QVt, is determined as
![]() (2.83)
(2.83)
2.2.4.2. Controlling static electricity
Controlling static electricity is another widely used way to prevent explosion because the static electricity is treated as an ignition source. Many methods are applied in industries: relaxation; bonding and grounding; dip pipes; increasing conductivity with additives; and handling solids without flammable vapors (Crowl and Louvar, 2011).
2.2.4.3. Ventilation
Proper ventilation can efficiently prevent fires and explosions. The primary concept behind ventilation is to lower the concentration of flammable gas or dust cloud until it is lower than the LFL or MEC. The relationship between concentration Cppm, the ventilation rate Qv, and the mass flow rate Qm from the leak can be expressed as (Crowl and Louvar, 2011):
![]() (2.84)
(2.84)
where T is the temperature, P is the pressure, M is the molecular weight of the material, Rg is the gas constant, and k is the nonideal mixing factor; it is usually between 0.1 and 0.5.
Also, the mass flow rate Qm can be measured according to 
![]() (2.85)
(2.85)
where is the concentration of gas measured at a point (y, z), u is the wind speed, and σy, σz are dispersion coefficients on y and z directions; they can be determined by the geometry and weather condition of a place. When using the value of LFL as Cppm, the minimum ventilation rate QV can be obtained.
..................Content has been hidden....................
You can't read the all page of ebook, please click here login for view all page.