2.5. Process Safety Challenges and Looking at the Future
2.5.1. Introduction
Over the last few decades, process safety has become paramount in the chemical industries. To increase the safety of the existing operations, plant personnel have identified and reduced potential hazards by installing adequate measures. A majority of companies have used tools like HAZOP, LOPA, and FTA to mitigate the dangers associated with process operations. Current incidents seem almost always the result of a combination of organizational issues, lack of competency, and technical failures of equipment (Knegtering and Pasman, 2009). Increase in complexity and sophistication of the process installations and control systems have compromised the safety of the operations. The implementation of an effective safety program with the potential to overcome the current challenges is desired.


2.5.2. Current Regulations
Before 1936, occupational health was not given adequate importance by the government agencies. Many regulations were created in the next 30 years to enhance occupational safety. In 1970, there was a major breakthrough in process and occupational safety. The U.S. Congress enacted OSHA, which brought about revolutionary changes in industrial practices. To fulfill the government responsibilities mentioned in OSHA, the Occupational Safety and Health Administration was established. In the same year, the U.S. Environmental Protection Agency (EPA) was created to enforce regulations concerning human health and environment.
In 1985, the American Institute of Chemical Engineers established the Center for Chemical Process Safety (CCPS) to integrate process safety with chemical processing (Berger, 2009). Following this, the administrator of the EPA promulgated the EPCRA in 1987. The act instructed the officials to provide emergency response personnel with MSDS information. The EPA also conducted studies to determine the toxic substances in the communities under the Toxic Release Inventory Survey (Atlas, 2007). In 1990, the Clean Air Act Amendments were promulgated that addressed wide ranging environmental and safety issues. As mandated by the Clean Air Act Amendments, OSHA promulgated the “Process Safety Management” (PSM) standard in 1992. The 14 elements of the PSM standard are the basis of process safety programs in the industry for the management of hazardous chemicals. Similar to OSHA's PSM standard, EPA promulgated the “Risk Management Program” (RM Program) regulations in 1996. The RM Program was designed to safeguard the environment and the public from exposure to hazardous substances. Also, the Clean Air Act Amendments required the establishment of the U.S. Chemical Safety and Hazard Investigation Board (CSB) for investigation of chemical incidents (Willey et al., 2005).
Similar to the United States, a number of regulations were passed in the United Kingdom. The U.K. government took stringent measures after the Flixborough incident of 1974. Following the incident, the Health and Safety at Work Act, was passed to monitor the health and safety at workplace. As mandated by the Act, the Health and Safety Executive (HSE) was established in 1974. In 1978, the HSE published the First Canvey report, which highlighted the likely hazards of the ammonium nitrate installations in Canvey Island and suggested means to reduce risks (Griffiths, 1984). Results from hazards models, which included consequence analysis and risk assessments, were included in the report. The hazard models were improved and newer injury relationships were introduced in the Second Canvey report (HSE, 1981). The Control of Major Accident Hazards (COMAH) was developed by HSE to assist the industrial operators to reduce risks. to deal with the onshore hazards, Notification of Installations Handling Hazardous Substances (NIHHS) regulations were developed (The National Archives) in 1982. The regulation prescribed threshold values for the quantities of hazardous substances that can be stored at an onshore site. Any industrial site exceeding this limit had to notify the HSE. For onshore non-nuclear major hazards the Control of Industrial Major Accident Hazards (CIMAH) regulations were established in 1984. Sites were expected to prepare comprehensive safety reports, which included the probability of anticipated major incidents along with the expected effects on the local people. to increase the awareness of the external stakeholders and to inform them about the HSE decision-making, “Reducing Risks, Protecting People” was published (HSE, 2001).
2.5.3. Recent Major Incidents in Industry
Despite the stringency in process safety, the industry has been a victim of many devastating disasters. The following section provides a brief overview of the major incidents in process industry in the past 30 years. This is followed by a concise illustration of the common characteristics of most incidents.
2.5.3.1. Flixborough disaster (Venart, 2004; Crowl and Louvar, 2011)
Nypro Ltd, Flixborough, UK, was exposed to fire and explosion on June 1, 1974. The ignition of a vapor cloud containing flammable cyclohexane was responsible for the incident. The incident caused 28 fatalities and injured 36 people. The structures in the vicinity of the incident were severely affected by the explosion and flying debris. About 1821 houses and 167 shops and factories were affected by the incident.
The Flixborough works of Nypro Limited was constructed to produce caprolactam. About 70,000 tons of caprolactam was produced on a yearly basis. The caprolactam was a basic raw material used in the synthesis of nylon. The production of caprolactam involved the use of cyclohexane at high pressures (7.9 atm) and temperatures (155 °C). Oxidation of cyclohexane to cyclohexanone and cyclohexanol was carried out in the presence of air and catalyst in a chain of six reactors.
A vertical crack in the stainless steel structure of reactor 5 had resulted in the disengagement of that reactor. A decision was made to continue the production process by connecting reactor 4 to reactor 6 using a dog-leg–shaped pipe section of 20-inch diameter. Flexible bellows were used, as the diameter of the feed line was 28 inches. The dog-leg pipe section connecting the reactors was structurally weak and was not adept to handle high pressures. On June 1, 1974, the bypass pipe section ruptured, releasing 30 tons of cyclohexane. The released liquid vaporized forming a flammable vapor cloud, which ignited after 45 s. The resulting explosion is considered to be the largest peacetime explosion in the United Kingdom.
2.5.3.2. Seveso disaster (Crowl and Louvar, 2011)
Higher temperatures in a trichlorophenol reactor due to loss of control lead to large concentrations of 2,3,7,8-tetrachlorodibenzoparadioxin (TCDD), a potent toxin. The chemical was vaporized and released through the relief system into the atmosphere affecting the people in the town of Seveso, Italy, on July 10, 1976. Due to improper communication between the Icmesa Chemical Company (the plant owners) and the local authorities, the local people were not evacuated until several days later.
Icmesa Chemical Company produced hexachlorophene, a chemical used as a bactericide. The plant was situated in Seveso, which is 15 miles from Milan, Italy. TCDD was produced as a byproduct during the synthesis of one of the intermediate, trichlorophenol. TCDD is a dangerous toxin, which is very difficult to separate owing to its insolubility in water.
On July 10, 1976, one of the batches producing trichlorophenol experienced a runaway leading to high reactor temperatures. The temperature went above 200 °C, leading to a large production of TCDD. The internal pressure of the system increased to a large extent, leading to the failure of the safety devices. A mixture containing TCDD and other reactive chemicals was released into the atmosphere and formed a white cloud. The chemical mixed with the rainwater and reached the soil, contaminating it. The chemical in the air affected people, leading to 250 cases of chloracne. Apart from this, more than 2000 people had to have their blood tested.
2.5.3.3. Bhopal disaster (Willey et al., 2005; Crowl and Louvar, 2011)
On December 3, 1984, accidental release of deadly methyl-isocyanate (MIC) into the atmosphere caused the death of 2000 civilians in the city of Bhopal, India. MIC was stored in a plant owned by Union Carbide. Exposure of MIC to water triggered an uncontrolled exothermic reaction, which led to pressure build up in the tank. The safety devices failed releasing the poisonous gas into the atmosphere.
Union Carbide's plant in Bhopal (Madhya Pradesh, India) produced insectides. MIC was used as an intermediate in the process. The company was aware of the reactive, toxic and flammable nature of the gas. Also, MIC reacts violently with water producing large amounts of heat. The absence of adequate cooling can lead to boiling of the liquid. Hence, proper refrigeration of the MIC storage tanks is a must.
The plant had many layers of safety systems. For example, the pressure relief system of the storage tanks was connected to the scrubber and flare systems. However, these systems were not operational during the time of the incident. On the night of December 2, 1984, one of the MIC storage tank was contaminated with water. The resulting exothermic reaction vaporized the MIC, which passed through the relief system. About 25 tons of the MIC vapor escaped into the atmosphere and spread to the adjacent town. Heavy vapors settled to the ground, affecting the people severely. Though none of the plant workers were affected, more than 20,000 civilians were injured.
2.5.3.4. Naples disaster
The petroleum depot near Naples, Italy, exploded in December 1985. The explosion produced a blast wave, which killed four people and injured 170. The severity of the explosions was such that it destroyed 12 large buildings, 448 small industrial units, and 220 small houses affecting property within a 5-km radius. Accidental spill of gasoline and the resulting vapor cloud was the main cause of the incident.
On December 21, 1985, there was accidental gasoline spill from one of the tanks in a petroleum depot near Naples. Gasoline overflowed through the roof of tank 17 for 1.5 h, releasing 700 tons of the liquid. The spilled liquid produced a vapor cloud of about 4500 m3, which was ignited by an unknown source. Instantly, 20 tanks were set ablaze destroying terminal buildings and nearby industrial and residential structures. About 2000 residents had to be evacuated from the nearby site. The fire lasted for a week, demolishing all the equipment in the vicinity. Fixed roofs, cooling devices, and other fire protection devices were blown away by the blast (Mannan, 2011).
2.5.3.5. Chernobyl disaster (Saenko et al., 2011)
The Chernobyl Nuclear Power Plant was hit by one of the biggest nuclear disasters on April 26, 1986. The breakdown of the cooling system led to the overheating of the nuclear core followed by a major explosion. Exposure to intense radiations killed five firemen and two staff members and affected many others in the aftermath.
Located in the north of Ukraine, the Chernobyl Nuclear Power plant was one of the largest nuclear plants. The main reactor was heated to high temperatures by the nuclear fission reaction involving uranium. Hence, water was passed through the reactor core to cool the system to lower temperatures. The water used for heat removal was boiled to produce steam, which was passed through turbines. Graphite rods controlled the fission reaction and the power output by absorbing the fission products (neutrons).
On April 26, 1986, there was sudden unexpected power surge due to an operator error. Due to this, there was excessive heat transfer to the coolant water producing a shock wave. This shock wave was responsible for disruption of the cooling water pipes and instant vaporization of water to steam. Due to loss of cooling, the nuclear fuel in the core vaporized, leading to a massive explosion. The reactor and the surrounding building were completely destroyed. Also, reactor debris and radioactive materials were thrown in the vicinity. Twenty-eight the 237 firemen died in the next 4 months due to radiation exposure. The firemen who were not killed by the exposure suffered from acute radiation sickness and were hospitalized. The effect of the disaster was so devastating that 19 more deaths were seen until the year 2004.
2.5.3.6. Piper Alpha disaster (Shallcross, 2013)
The Piper Alpha platform in the North Sea was set on fire due to the accidental passage of gas through a condensate injection pump, which was isolated from its pressure safety valve. The explosion, which occurred on July 6, 1988, resulted in the death of 165 people on the platform. This is one of the worst offshore oil platform disasters to date.
The 31-km2 Piper oil field in the North Sea was discovered in 1973. By 1976, the Piper Alpha platform was built and produced 40,000 m3 of oil per day. The Tartan and Claymore oil platforms were built in the vicinity to exploit the surrounding regions.
The process involved extraction of oil accompanied by water and gas. The oil was separated from the mixture using separators and transported to the export line. The water was treated to remove the oil traces and discarded into the sea. The gas is passed through a series of condensation and compression stages to extract the condensate, which was added to the oil in the export line. Piper Alpha had two condensate injection pumps (A and B). During the time of the incident, the condensate injection pump was under preventive maintenance and the pressure safety valve attached to the pump needed inspection. A work permit was issued and the valve was removed for recertification. As it was past the normal working hours, the supervisor failed to replace the disengaged valve and returned the work permit to the control room. However, the absence of the valve on the pump was not properly communicated to the control room officials. Unfortunately, the second condensate pump B failed the same evening. According to the officials, the preventive maintenance work on Pump A had not started and hence they decided to connect the pump to the system. A large amount of gas leaked and ignited, leading to fire and explosion. The walls used for construction did not have explosion proofing and collapsed, damaging the platform severely. Two operators attending to the gas leak were killed instantly. Only 61 of the 226 men on board survived.
2.5.3.7. St. Herblain disaster
On the morning of October 7, 1991, there was an unconfined vapor cloud explosion in Nantes, France, near a petroleum depot. The faulty nature of a filling valve resulted in release of lead-free gasoline, which initiated the event. The blast claimed the life of one employee while severely injuring five others. The impact destroyed the foundations of the structures in a 100-m radius.
The tank farm, located to the west of greater Nantes area had a series of 11 storage tanks with a total capacity of 80,000 m3. The tank farm was located along the Loire River and was supplied by a quay located 125 m away. The facility opened at 4 a.m. in the morning and had two employees to handle the loading operations.
On the morning of the 7th, normal loading operations resumed. The remote controlled opening of a valve located at the base of one of the tanks was improper and released lead-free gasoline. This produced about 23,000 m3 of a large vapor cloud, which started spreading to the surrounding area. In 15 min, the cloud had increased its depth to 1.5 m and extended 50 m to reach the road. The humidity and the nature of the wind assisted the stabilization of the vapor cloud, leading to an ignition and explosion in the next 5 min. The explosion was equivalent to about 2.7 tons of TNT and destroyed two tanks, 15 tanker trucks, a wash station, and four cars (Mannan, 2011; French Ministry of Environment, 2006).
2.5.3.8. Warffum disaster
A small-scale explosion rocked the Dutch petroleum company located in Warffum, Netherlands, in May 2005. The welding activities ignited a small residue of natural gas condensate present on a tank. Three people were affected by the blasts (Knegtering and Pasman, 2009).
Since February 2005, maintenance activities had been carried out at the Dutch petroleum company (Shell). The vapor recovery pipe of a tank was being renovated. The entire project was outsourced to external contractors who took care of the planning and the hardware installations. The tank was connected to a valve to limit the exposure of its contents to air.
On May 31, 2005, three GTI employees were working on the pipe when the tank exploded leading to a fatal fire. The presence of natural gas condensate on the tank's welding triggered the explosion. Two GTI contractors were killed while the third one was seriously injured. The fire fighter received first-aid for minor burns developed during the subsequent rescue operation.
2.5.3.9. Texas city disaster
On March 23, 2005, a refinery in Texas City, USA, owned by BP and believed to be the third largest refinery in the United States, sustained one of the worst disasters in history (CSB, 2007). The blast was caused by discharge of hydrocarbon liquid from a refinery unit, which lead to the formation of flammable vapor cloud. Fifteen people were killed and 180 were injured in this tragic incident. The incident damaged property in a 1.2-km radius. The estimated financial loss was about $1.5 billion.
The refinery's isomerization (ISOM) unit was on a maintenance outage. It was being restarted on March 23, 2005. Liquid hydrocarbon was being charged to the tower. The charging time on that day was about 3 h, which was contradictory to the general startup procedures. The liquid overflowed the 52-m-tall tower and entered the overhead pipe. The alarms and control system were faulty and did not warn the operator. The liquid in the overhead pipe ran down the side of the tower toward the pressure relief valve located 45 m below. The three pressure relief valves released the flammable hydrocarbon liquid into the blow-down drum. The entire blow-down system was improperly designed and was not connected to any flare systems. The vent stack, 34 m in height, was open and released the flammable liquids. On reaching the ground, the liquid evaporated and formed a flammable vapor cloud. It is believed that the backfire of a diesel pickup truck located 7.6 m from the drum ignited the vapor cloud. Fifteen contract employees who worked in the vicinity of the drum bore the brunt of the explosion and were killed.
2.5.3.10. Buncefield disaster
The Buncefield oil storage depot in Hemel Hempstead, Hertfordshire, UK, saw an explosion in December 2005. Like many other previous incidents, the disaster was caused by the unexpected discharge of liquid gasoline. The explosion was so huge that it caused massive fires, which injured more than 40 people. Apart from plant personnel, the explosion damaged property in a 10-km radius. This was one of the largest peace time explosions in Europe for 50–60 years.
Buncefield oil storage facility is a major transfer point for petroleum derivatives in the UK. On December 10, 2005, about 8400 m3 of unleaded gasoline was brought to the site. It was decided that a part of the oil would be transferred to one of the tank (912). According to the attached pressure gauge, the tank was two-thirds full and had about 4971 m3 of empty volume (Mannan, 2011).
On the morning of the 11th, tank 912 was filled with gasoline. From 3 a.m. in the morning, the tank gauge remained static showing that the tank was two-thirds full. As the gasoline filled the tank, its temperature increased. At about 5:35 a.m., tank 912 began overflowing. The installed CCTV cameras showed images of mist engulfing the facility site. After the incident, when the people in the vicinity were interrogated, they confirmed this fact. It was further revealed that a distinctive odor of gasoline swamped the surroundings in the early hours of December 10. Until 6 a.m. in the morning, about 300 metric tons of gasoline was released from the tank. The flammable vapor cloud ignited at 6 a.m. and there was a major explosion. This explosion was succeeded by other explosions, which led to fires causing damage to people and property. Figure 2.28(a) shows a picture of the first day of the fire.
2.5.3.11. Fukushima disaster (Steinhauser et al., 2014)
The tsunami resulting from a major earthquake was responsible for flooding and disrupting the cooling system of Fukushima Daiichi Nuclear Power Plant on March 11, 2011. The consequent meltdown of the fuel rods was responsible for a major explosion.
Tokyo Electric Power Company constructed Fukushima Daiichi Nuclear Power Plant between the years 1971–1979 in Japan. The plant consisted of six boiling water reactors and was protected by a 10-m sea wall. Reactors 4, 5, and 6 were nonoperational during the incident. An earthquake of magnitude 9 on the Richter scale hit the eastern coast of Japan on March 11, 2011. The seismic signals generated by the earthquake triggered an automatic shutdown of the first three reactors in the plant. The earthquake created a tsunami which breeched the sea walls of the nuclear power plant. The water intake buildings of the NPP were completely flooded and blocked by the floodwaters. Owing to this, the entire cooling system of the plant was disrupted. The battery-driven cooling pump meant to cool the reactor core in the event of a cooling failure was started. However, the failure of heat removal systems from the building was responsible for shortage in the supply of steam required to drive the pump. The pump stopped functioning leading to the meltdown of the reactor core. Reaction between zirconium and water at higher temperatures led to large amounts of hydrogen gas and hydrogen explosions. Though there were no reported casualties, the Fukushima disaster is considered to be one of the biggest environmental disasters in modern times.

Figure 2.28 Disasters in industries. (a) Buncefield facility on the first day of the fire. (b) Smoke from Naples (Hailwood et al., 2009).
2.5.3.12. Common characteristics of major industrial incidents
Analysis of most major industrial incidents indicates that none of the disasters were initiated by unanticipated hazards or unpredictable situations. The concerned authorities were aware of the properties of the involved chemicals and the hazards associated with it. In fact, it could be postulated that many of these incidents could be averted if the safety principles were properly implemented.
Another factor that is common in many major industrial incidents is that incidents do not happen due to a single failure or defect. A number of problems culminate into a big disaster. Hence, it is very difficult to isolate a single flaw, which could have triggered the entire event. Reason (1990) used a Swiss cheese model to explain this phenomenon. In the Swiss cheese model, the organizational barriers against failure are considered as slices of cheese. The weaknesses in different parts of the system are represented as holes in these slices. When the holes in each of the slices align momentarily, an incident occurs. Figure 2.29 describes the influence of failing system barriers, operator error, preconditions, latent failures, and fallible decisions of management on the incident (Knegtering and Pasman, 2009).
Faulty control systems, inadequate maintenance, lack of awareness, constant focus on production, improper communication, and poor management are responsible for many process safety incidents.

Figure 2.29 Swiss cheese model (Reason, 1990).
2.5.4. Process Safety Challenges and Opportunities
The main challenges and therefore opportunities to improving the safety performance in the process industries can be summarized as follows.
2.5.4.1. Organizations have no memory
The integration of past knowledge and present situation helps avert dangers. It is generally seen that when individuals leave organizations, they leave with their knowledge. Their experiences and wisdom are lost forever and the organization as a whole is deprived of their intelligence. The past incidents and mishaps are overlooked and the same mistakes are repeated (Kletz, 1993). Most of the industries focus on developing consequence models or doing risk assessments to increase safety (Qi et al., 2012). The most common reason behind many incidents is that most organizations do not appreciate the fact that “Human memory is weak and corporate memory short” (Knegtering and Pasman, 2009). According to Kletz (1993), an organization loses vital information regarding past incidents every 10 years due to personnel changes. Many plant workers are unaware of the importance of certain safety practices or the need of some equipment, which was introduced after major incidents.
The lack of proper analysis of past incidents affecting other industries is another cause of failure. For example, before the Buncefield incident, there were many reported incidents, which involved overfilling of a gasoline tank. The Naples incident, mentioned in the previous section, is one such example. Another similar incident was the New Jersey Texaco incident, which occurred in 1983 (Hailwood et al., 2009). In this incident, about 80,265 tons of unleaded gasoline was released into the surroundings, which ignited under favorable conditions. Other such incidents are summarized in Table 2.13.
Similar to Buncefield, the Warffum incident was preceded by incidents involving explosion due to welding activities.
Table 2.13
Incidents Similar to Buncefield Explosion (Knegtering and Pasman, 2009)
| Location | Date | Comments: Background | Comments: Explosion |
| Houston, Texas, USA | April 1962 | Severe leak from a gasoline tank. Ignition near adjacent highway. | Described as a blast, but no details are available. |
| Baytown, Texas, USA | January 1977 | Overfilling of a ship with gasoline. | Congestion must have caused the leak. |
| Texaco, Newark, New Jersey, USA | January 1983 | Overfilling of a tank containing unleaded gasoline. 80,265 tons released. Ignition source 300 m away. | Relatively noncongested area. High overpressures reported, but not quantified. Three minor explosions preceded the main blast. |
| Jacksonville, Florida, USA | January 1993 | Overfilling of a tank containing unleaded gasoline. 132 tons released. | High overpressure produced. |
| Laem Chabang, Thailand | December 1999 | Overfilling of a gasoline tank. | High overpressure and congestion. |

As such, there is a dearth of an efficient system, which can document past knowledge and act as a retention tool. There is a grave need to examine past case histories and extract useful information from them. Currently, most industries have ample documents and data corresponding to safety principles and codes of conduct. However, the specific experience gained from designing or operating a piece of equipment is still not easily accessible to a beginner, who has just joined the plant. Owing to the inadequate interaction between the designer and worker in the field, experience from the field does not flow back sufficiently to new design (Knegtering and Pasman, 2009).
2.5.4.2. Disadvantages of probability-based approaches
As mentioned earlier, probability-based approaches are used widely in industrial risk assessment process. But a variety of limitations affect the effectiveness of these techniques. The following provides a discussion of some of these limitations and disadvantages.
Limitations of fault tree analysis
1. As the complexity of a process increases, the size of the fault tree increases. Current industrial processes demand fault trees with thousands of gates and numerous intermediate events. This increases the computation time and makes it onerous.
2. The fault tree analysis requires the knowledge of failure probabilities. These values are not known accurately and in some cases are not known at all.
3. Fault trees assume that the failure probability of one component is not affected by the failure of another component. Owing to this assumption, failure probabilities are underestimated in some cases, affecting the overall probability and risk calculations.
4. The development of a fault tree depends to a large extent on the engineer. Different people create different structures, which give different values of failure probabilities (Crowl and Louvar, 2011).
5. Fault tree analysis has been used extensively on a commercial scale. However, the use of fault trees for reduction of hazards in laboratory and pilot scale systems is relatively sparse owing to lack of initiative and shortage of experience.
Limitations of event tree analysis
1. Quantitative data are needed for each event to predict failure frequencies.
2. Detailed processes have huge event trees.
3. An event tree consists of an initiating event and terminates with a large number of consequences. The certainty of a concerned consequence arising from a selected failure is low (Crowl and Louvar, 2011).
4. Similar to fault tree methodology, the applicability of event tree analyses to laboratory and pilot scale plants is limited.
2.5.4.3. Deficiencies in consequence-based approaches
Fire consequence modeling
Major problems arise during the estimation of thermal heat radiation from a fire. The physical height of the flame depends to a large extent on the circumstances of release. The basic assumption that a fire resembles a uniform cylinder is not always true. Apart from this, smoke production affects the total fire area due to shielding effect. Second, the modeling of the extent of damage caused by a particular intensity of heat radiation to people and objects is complex. Most of the models are simple and neglect the effect of intervening objects (e.g., houses, trees) in their calculations of hazard distances. These calculations play a pivotal role in determining the hazard zones near an industry. The location of an industry (e.g., urban, rural, industrial) will influence the density of surrounding obstacles and thereby influence the hazard zone calculations. To make the models more comprehensive, the absorption of the thermal radiation by the atmosphere has to be included in the models. The radiative properties (e.g., absorptive, reflective) of the receiving surface are not considered while assessing the impact of a thermal radiation on the surroundings. The radiative properties of a surface determine the thermal inertia of a body, which governs the thermal response of a body. For example, the damage caused to a human depends to a large extent on (a) amount of skin exposed, (b) amount of clothing, (c) physiological response (sweating), (d) wind velocities, and (e) ability to take shelter (Raj, 2007).
Explosion consequence modeling
The inability to predict confined vapor clouds is a major drawback of the TNT equivalency model. to overcome this limitation, a new model called TNO Multi-Energy Method was introduced. This model takes into account the degree of confinement of a volume and includes it in the calculations. The congested areas of a field are inspected to identify the potential blast sources. The blast strength is represented by a number (1–10). For example, a strong blast is characterized by strength of 10 and a blast arising from a quiescent part is considered to have blast strength of 1. For each of the blasts, the scaled distance is calculated using the following equation (Crowl and Louvar, 2011) and using Figure 2.30.
 (2.97)
where  is scaled distance, R is distance from the charge (m), E is charge combustion energy (J), and Po is ambient pressure (Pa).
Based on the value of the scaled pressure, the overpressure is calculated using the following formula,
![]() (2.98)
(2.98)
where po is scaled distance and Pa is ambient pressure (Pa)
The selection of the severity factor for various confinements is a complicated process. Combining the results from each blast is another challenge. Current techniques involve adding the combustion energies from each source and assuming maximum initial blast strength of 10. However, this is valid only for blast sources located in close proximity. Also, the model cannot adequately depict partially congested geometries.
Currently, consequence models have widespread use in process industries. Though they are infinitely scalable, these models have not been adapted on a laboratory or pilot scale. to validate these models for a laboratory/pilot scale system, proper testing is required.
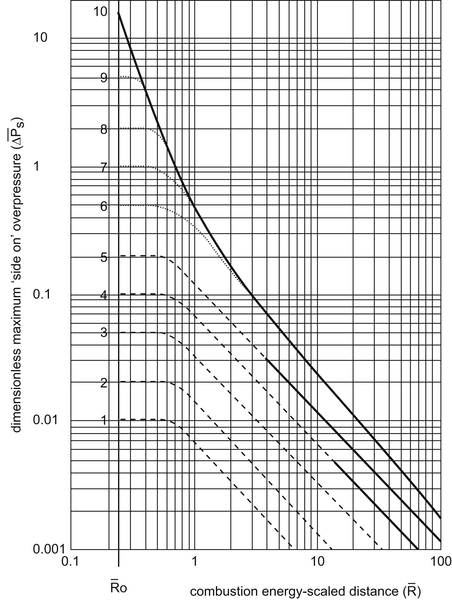
Figure 2.30 Scaled pressure versus scaled distance. CCPS (1994).
2.5.4.4. Disadvantages and limitations of qualitative and semiquantitative techniques
Layer of protection analysis
Major limitations exist in the process of inclusion of human actions and activities within LOPA. Most companies give independent protection layers (IPLs) more credit than can be substantiated. It is necessary that all companies provide thorough training to their operators so that they are capable of carrying out their actions.
Second, the use of dependent IPLs in the analysis process often leads to ineffectiveness. High priority should be given to include IPLs, which are independent of each other. For instance, common issues arise from the use of the same operator or operator group in multiple IPLs.
Also, the data for initiating events and IPLs are based on initial conditions. It is necessary that efforts are concentrated toward maintaining the IPLs at these conditions. It is often seen that the IPLs lose their reliability with time. The human IPL is one such example. The human IPL may change depending on factors such as work structure, recruitment process, and presence of temporary workers.
Another common problem experienced during the application of LOPA is the inappropriate use of data from handbooks and standards. People tend to use failure probabilities from literature without assessing the applicability of the data for a particular plant, site, or process. The validation of the selected data for a particular plant plays an important role in the successful implementation of LOPA (Myers, 2013).
HAZOP approach
One of the main disadvantages of HAZOP approach is that it is tedious and requires ample amount of time (Crowl and Louvar, 2011). Second, a HAZOP is not meant to and is incapable of detecting all the design flaws. For example, a weakness in the layout cannot be discovered by a HAZOP analysis. A HAZOP inherently assumes that the plant is supposed to function as designed. All the assumptions made during the design phase must be incorporated during construction and operation for ensuring the success of a HAZOP analysis. For instance, if a different material is used for construction problems may result. The HAZOP method focuses entirely on identification of hazards. Some of the identified hazards may have low probability or consequence. HAZOP approach in itself is not comprehensive and requires risk-based calculations for validation (Kletz, 2001).
2.5.4.5. Inherently safer design principles are not followed
Inherently safer design (ISD) is a philosophy that focuses on safety issues in design and operation of equipment involved with hazardous chemicals (Hendershot, 2010; Kletz and Amyotte, 2010) as conceptually shown in Figure 2.31. ISD involves minimizing or substituting the use of hazardous chemicals or operating at moderate conditions to reduce the overall risk. Reduction of complexity of operations is another salient feature of ISD. It is better to incorporate ISD in the initial design phase of process development. Generally, the engineering and financial decisions made in the later stages of development do not permit proper incorporation of ISD techniques in process development (Heikkilä, 1999). The industry has acknowledged the importance of ISD and has implemented various programs to implement the concepts. However, the implementation of ISD as a routine practice is hindered by many factors.
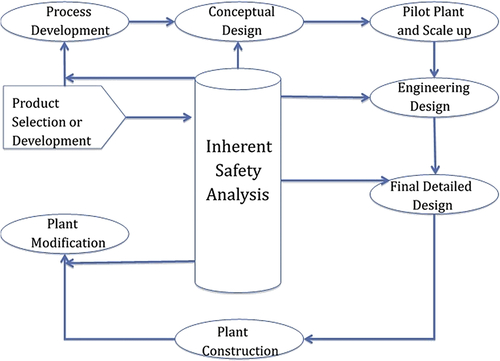
Figure 2.31 ISD in process design life cycle (Khan and Amyotte, 2002).
Why ISD is not a routine
The first factor, which limits the application of ISD, is the lack of awareness of ISD concepts among designers and chemists (Khan and Amyotte, 2003). Since the application of ISD begins at the onset of a project, the design engineers and the chemists need to have a thorough understanding of ISD. Most of the designers are not adept in incorporating the ISD principles into the design. Apart from this, most industries opt for the high-performance materials to maximize profits. A case in point is the use of solvent-based paints over aqueous latex paints. The aqueous paints are safer but may show substandard performance under certain conditions. The innocuous nature of a chemical may not guarantee its amiability toward the surroundings. Many chemicals, which might be inherently safer, might be highly deleterious to the environment. For example, chlorofluorocarbons (CFCs) are used as a substitute for ammonia in refrigeration system. Though inherently safer, CFCs tend to deplete the ozone concentration in the environment. The process of developing ISD is technically challenging and demands research and development efforts. Especially, in the case of implementing it to an existing plant, the cost of the improvements may override the relatively small gains. Also, the additional time required to incorporate the changes might make it impracticable.
Quantification of ISD
Measurement techniques and analysis tools have been constantly developed to measure ISD. Traditional methods were based on Boolean principles, which used tentative and subjective information (Gentile et al., 2003). These methods were replaced by sophisticated techniques like qualitative ranking schemes, quantitative risk analysis, and formal decision-making tools. These techniques vary from simple “what-if” analysis and critical examination to comprehensive decision analysis techniques (Khan and Amyotte, 2003).
Hazard index is another way of characterizing ISD. In this method, index values are attributed to chemicals and processes of a plant. The Mortality Index is one of the basic methods to measure ISD. In this method, the average number of human deaths caused by an explosion of one ton of a liquefied flammable gas is obtained from historical records. For example, the Mortality Index of chlorine is 0.3 while that of ammonia is 0.02 (Kletz and Amyotte, 2010). This means that 1 ton of ammonia is 15 times safer than 1 ton of chlorine.
![]() (2.99)
(2.99)
However, the index does not account for nature or frequency of leaks that can occur in a plant. For example, a certain chlorine plant might have lower number of pumps or drainage points (leak sources) compared with an ammonia plant. Hence, more sophisticated indices have been devised.
The Dow Fire and Explosion Index (F&EI) is another safety metric used in industrial design and optimization. This is used to analyze the fire, explosion, and chemical exposure hazards (Suardin et al., 2007). The details of this method were introduced elsewhere. The Mond Fire Explosion and Toxicity Index (FETI) is another type of index used commonly in the industry. It is similar to the F&EI with certain modifications. Additional hazard factors like special material hazard factor and layout hazard factors are introduced. to account for the material inventory a quantity factor is considered. Most importantly, a toxicity index is determined for every chemical based on the amount and the toxicological properties. The toxicity index is characterized on a scale of 1–7 (1 is low, 7 is severe) (Khan et al., 2001).
Another popular safety metric is the Safety Weighted Hazard Index (SWeHI). The SWeHI measures the radius of area under moderate hazard due to a certain plant. This can be given by the following expression (Khan et al., 2001):
![]() (2.100)
(2.100)
where B is quantitative damage caused by a plant and A represents credits due to the existing safety and control measures.
The term B comprises two parts: (a) damage due to fire and explosion (B1), and (b) damage due to toxic release (B2).
1. The estimation of SWeHI begins with the classification of industrial units as storage units, units involved in physical separations, units involving chemical operations, transportation units, other units (furnace, boilers).
2. This is followed by the calculation of energy factors and penalties for each case.
The following procedure describes the entire process (Khan et al., 2001). The calculations are performed for a storage unit. Similar calculations can be carried out for other units.
Calculation of B1 for storage units
Three energy factors are used to account for the chemical (F1) and physical energies (F2, F3) of the storage units.
![]() (2.101)
(2.101)
![]() (2.102)
(2.102)
 (2.103)
where M is mass release rate (kg/s), Hc is heat of combustion (kJ/mol), K is constant (3.148), PP is processing pressure (kPa), V is volume (cu·m), VP is vapor pressure (kPa), and T is temperature (°C).
The effect of the various parameters on damage potential is obtained using energy factors and penalties. For instance, the effect of temperature is modeled using penalty (pn1) where
![]()
if (fire point > temperature > flash point)
pn1 = 1.34.
or
(Autoignition temperature > temperature > fire point)
pn1 = 1.55
or
pn1 = 1.1
Similarly, two energy factors (F2, F3) and a single penalty (pn2) are used for modeling the pressure.
If(VP > AP)
If(PP > VP)
F = F2 + F3
pn2 = f(operating pressure)
or
F = F2
pn2 = f(operating pressure)
or
F = F3
pn2 = f(operating pressure)
where VP is vapor pressure (kPa), AP is atmospheric pressure (kPa), PP is processing pressure (kPa), and f is function of operating pressure.
Other parameters like the presence of a hazardous unit (pn3), amount of chemical inventory (pn4), flammability/reactive characteristics of chemicals (pn5), congestion associated with the concerned unit (pn6) are also modeled using penalties. Apart from this, external factors like earthquakes (pn7) and incident vulnerability of an area (pn8) are also considered. For example, if the frequency of occurrence of an earthquake is 1/year, then a penalty of two is assumed. All the energy factors and penalties are used to obtain the hazard potential.
 (2.104)
![]() (2.105)
(2.105)
Calculation of B2 for storage units
The parameter B2 corresponds to the radius of the area affected by a toxic release. The load should have 50% probability of causing death. The air quality is assumed to be slightly stable (something between highly stable and highly unstable). The index B2 is derived from factors like (a) amount of chemicals in the unit, (b) physical state of the chemicals involved, (c) toxic nature of the chemical, (d) operating conditions, and (e) site characteristics.
The calculation begins with estimation of the G factor. The expression used to derive G is
![]() (2.106)
(2.106)
where m is release rate (kg/s), and S depends on release conditions.
The value of S is obtained from the following table (Table 2.14).
The penalties for operating pressure and temperature are estimated in a manner similar to B1. Apart from this, penalties for vapor density (pnr3), toxicity (pnr4), and site characteristics (pnr5) are evaluated as follows.
Table 2.14
S Values for Various Types of Chemical Release (Khan et al., 2001)
| NFPA Rank | Liquid | Liquefied Gas | Gas | Solid |
| 4 | 4.00 | 8.00 | 13.40 | 0.1300 |
| 3 | 0.40 | 0.80 | 1.34 | 0.0130 |
| 2 | 0.20 | 0.40 | 0.67 | 0.0060 |
| 1 | 0.07 | 0.10 | 0.25 | 0.0025 |

![]() (2.107)
(2.107)
Dense vapors like ammonia tend to settle down and have a larger impact on the environment. They tend to disperse slowly leading to a buildup of toxic load.
![]() (2.108)
(2.108)
where NH is NFPA ranking for health hazard.
![]() (2.109)
(2.109)
where fp is population density function.
Also, the calculated values of penalties for external factors (pnr6) and plant vulnerability (pnr7) are used.
Using the values of the G factor and the penalties, we get B2
![]() (2.110)
(2.110)
The larger of the two values (B1, B2) is considered as the hazard potential index (B).
Quantification of A
The control measures in an industry play an important role in deciding the overall risk potential of the plant. These measures are directed toward reducing the damage potential of industrial units and decreasing the likelihood of disaster events. In the evaluation of A, credit values are given for emergency resource planning (cr1), disaster management plan (cr2), process control system (cr3), detection devices (cr4), emergency control measures (cr5), human error (cr6), equipment reliability (cr7), and damage control measures (cr8). Using these values, A is calculated using the expression,
 (2.111)
SWeHI is then calculated using Eqn (2.100). Apart from these indices, the Chemical Exposure Index, Fuzzy Logic–based Inherent Safety Index (FLISI), and Hazardous Waste Index are commonly used in the industry. Although a large number of hazard indices are available, no index method can incorporate all the safety parameters (Suardin et al., 2007). Depending on the plant, an engineer has to select the appropriate methodology. Barring the Mortality Index method, all the techniques are complex and cannot be easily integrated with preliminary process design (Heikkilä, 1999). For example, characterization of the toxicity index in the Mond FETI method requires a lot of experience. A majority of these methods require detailed process information, which is not available at the early design stage. For example, the identification of general process hazards involving enclosed process units in F&EI method. Methods like FLISI require sophisticated mathematical tools not easily available in the market. Hence, most of the companies are looking for simpler methods to measure ISD, which can be easily adaptable with computer optimization and simulation tools. If such a method is developed it can have a widespread use in industries.
Common misconceptions about ISD
Though the use of ISD is recommended, there are certain myths regarding ISD and its applications (Hendershot, 2010).
ISD will remove all hazards
ISD addresses safety issues and reduces the overall risk of the plant. However, it does not mean that the plant is hazard free. The ISD may correspond to reduction in a particular hazard, but it does not mean that all other hazards are mitigated. Also, ISD should be implemented with extreme care. The installed improvements should not introduce newer forms of hazards or increase other existing hazards.
Inherently safer technology is always the best way to manage a hazard
As mentioned in the earlier section, the introduction of safer strategies to reduce one hazard may initiate another hazard. In such circumstances, the implementation of ISD is not the best solution available. Additionally, in some cases a safer process is preferred over an inherently safer process owing to the societal benefits it engenders. For example, the use of nuclear energy to generate electricity is relatively cheaper than other sources of electricity generation. Also, the process emissions have limited impact on the environment. However, a nuclear power plant is not inherently safer and has the potential to cause a major disaster.
ISD can be applied only at the early stages of design
The use of ISD in the early stages of research and development guarantees maximum benefits. However, this does not imply that its application at later stages is unrewarding. For example, following the Bhopal disaster, many companies have made a conscious effort to reduce the inventory of toxic and explosive chemicals, thereby reducing the hazards associated with it (Hendershot, 2010).
The role of plant operators in ISD is minimal
Plant personnel have first-hand knowledge of the plant. They have good insight into the mechanical aspects of the plant. They might not be able to suggest a safer chemistry for the process, but they can identify the operational challenges imposed by the improved process. For example, a startup procedure, which requires an operator to manually operate a set of valves in a correct sequence, is less safe than a procedure operated by an automatic set of valves. Another alternative could be reducing the number of existing valves by process technology change. In both cases, the number of human errors is drastically reduced (Hendershot, 2010). However, plant operations personnel are rarely involved in the initial stages of the design and construction of the plant, and so their input to any ISD considerations or analysis is at a minimum. Efforts should be made to address this barrier as much as possible.
2.5.4.6. Not giving enough importance to leading indicators
It is said, “prevention is better than cure.” So, we need to identify the signals before an incident occurs (Grabowski et al., 2007). Traditionally, the safety performance of many industries has been assessed by ‘after the loss’ measurements. Factors such as incident and injury rates, incidents, and dollar costs are used as parameters to analyze safety and prevent future incidents. Recently, safety and performance of plants have been measured using safety indicators.
Leading indicators are conditions, events, or measures preceding an adverse event, which have the potential to predict the arrival of this event. They are performance indicators or metrics, which have the capability of eliminating or minimizing risks by identifying and mitigating hazards. Generally, indicators measure the performance of six different functional areas (Øien et al., 2011).
1. Management, organization, and administration
2. Design of facility and processes
3. Training and qualification
4. Operation
5. Maintenance
6. Emergency preparedness planning
The indicators in a system and the onset of undesirable events are linked in a number of ways. Some indicators can be the harbinger of adverse incidents, while others can be a direct cause of them. In both cases, the links are easily perceivable and can be analyzed. The lack of efforts shown by industries in understanding process and chemicals hazards and the insufficiency in the consequence modeling tools have been responsible for making industries oblivious to the indicators. Many disasters could have been forestalled, if the leading indicators, missed signals, and dismissed alerts were properly managed. In the case of Buncefield, factors like vapor cloud formation due to liquid leak or the heat effects due to explosion were not investigated (Qi et al., 2012). Also, in recent years, terrorism has become an emerging threat to mankind. In the post-9/11 world, potential terrorist attacks on chemical plants have become a possibility to consider. While antiterrorism regulations have been promulgated by national governments, there is a great scope for research in this field.
2.5.4.7. Lack of communication
In the past 30 years, the industry has increased its focus on energy saving, product quality, profit margins, as well as safety (Knegtering and Pasman, 2009). Owing to this, process installations are being used to their full capacities. Apart from this, the ever-growing need of increasing the flexibility of operations has led to complicated systems. The complex nature of the control systems is difficult to decipher. The transfer of technology from the Western world to other countries has further added to the challenges faced by local employees. In addition to this, outsourcing has led to dispersal of the core business (Qi et al., 2012). Enormous efforts need to be taken to maintain the standard levels of safety at all locations. to solve these problems, it is important that a company gives adequate importance to communication.
Communication plays a pivotal role in human interaction. The organization as a whole should be committed and willing to tackle the problem. The whole system should be divided into smaller groups with group leaders. The groups should be made to interact with each other, thereby improving collaboration and communication. Frequent group briefings before and after operations will prevent miscommunication among the workers. According to government regulations, workers should be made aware of the hazards and risks associated with the processes in the industry. Apart from this, the experienced personnel must properly train and coach new workers. The process-specific experience and technical know-how should be shared with the new employees.
2.5.5. Conclusion
2.5.5.1. Process safety: a holistic approach
A safe situation is sustained due the coherence of many related aspects. These aspects need to be investigated as a whole; tackling single aspects separately may not be sufficient to guarantee safety. There are numerous occasions in a plant, when single problems go undetected. However, these problems are easily handled by the sophisticated process systems. But, if the management constantly neglects such problems, the problems can pile up leading to a big failure. Even if the problem is noticed, it might not be deemed as urgent or safety critical because a single problem does not lead to an undesirable event in today's industry. Process safety incidents occur due to a number of reasons. To avert an adverse event, the industry must have an open eye for all possible incident causes and good overall control. All the aspects affecting process safety must be controlled. to achieve these objectives, human beings need to be more prudent and perceptive. Also, as humans have limited far-sightedness, reliable metrics and comprehensive computer simulations are required to predict the future.
2.5.5.2. Need for further research
Preventing process disasters requires constant vigilance. When a plant is not exposed to a major mishap for a long time, people tend to get complacent. They stop appreciating the importance of safety systems and control measures. This is a major reason for a disaster.
The advancement of industry, science, and technology has given rise to new problems. New incident scenarios have been identified. These scenarios are directly related to the organizational framework and the safety culture. They are responsible for the major incidents, which affect the people and surroundings. The constant change in the industry demands a continuous change in the process control techniques. Most importantly, a reliable and adequate measurement system is required. Similarly, a suitable information technology tool is required to incorporate previous information from incidents into the current design and operation of the plant. Research and identification of new ISD techniques and the use of safer chemicals may be able to solve a majority of problems faced by the new millennium. Maintaining sustained process safety performance without compromising on plant production is a formidable mission. In addition to diligent and consistent enforcement of current regulations on safety, there is great scope for fundamental and applied research in safety.
..................Content has been hidden....................
You can't read the all page of ebook, please click here login for view all page.