
Throughout Part IV of this book, there have been several examples of configuration options that influence the behavior of MySQL. These options include the choice of character sets and collations, how to create index statistics, how the optimizer should work, and more. There are also other options that directly or indirectly influence the performance of your queries. This chapter will consider the most commonly used options not covered elsewhere as well as some general considerations when it comes to configuring MySQL.
The chapter starts out with some “best practices” around changing the configuration. Then the following sections are for InnoDB, query buffers, and internal temporary tables.
Best Practices
Be wary of best practices.
Use monitoring to verify the effect.
Change one option at a time.
Make relatively small incremental changes.
Less is often better.
Make sure you understand what the option does.
Consider the side effects.
It may sound contractionary that the first item of a best practices list is to be wary of best practices. What is meant is that when you see some advice, then you should not jump straight ahead and apply that.
No two systems are identical, so while an advice may in general be good, you still need to consider whether it also applies to your system. Another gotcha is to look at advice that applies to an older version of MySQL or to a time when 8 GiB of memory was a lot. If you Google some setting, it is possible that you can see recommendations that were written many years ago. Similarly, a recommendation that worked well for your system some time ago, may no longer work due to changes in the application workload. Finally, even if a recommendation will improve the performance for your system, there may be side effects such as the risk of loss of committed changes that are unacceptable for you.
The recommendation to be wary of best practices also applies to the suggestions in this book. Always consider how they apply to your system.

The performance tuning lifecycle
You start out defining what the issue is and then collect the baseline either through your monitoring system or by timing the query or similar. The baseline may also be a combination of observables. Then you can define the goal of the optimization. It is very important that you define what is good enough, or you will never be done. The next steps are to determine the cause and use that to find a solution. Finally, you implement the solution and verify the effect by comparing to the baseline. If the problem is not solved or you have identified multiple problems, you can start over.
Monitoring is very important in this process as it is used both to define the problem, to collect the baseline, and to verify the effect. If you skip these steps, you have little idea whether your solution worked and whether it affected other queries as well.
When you decide on a solution, make as small a change as possible. This applies both to the number of configuration options that you turn the knobs on and how far you turn the knobs. If you change more than one option at a time, you cannot measure the effect of each change. For example, two changes may cancel each other out, so you think the solution did not work when one of the changes really worked great and the other made the situation worse.
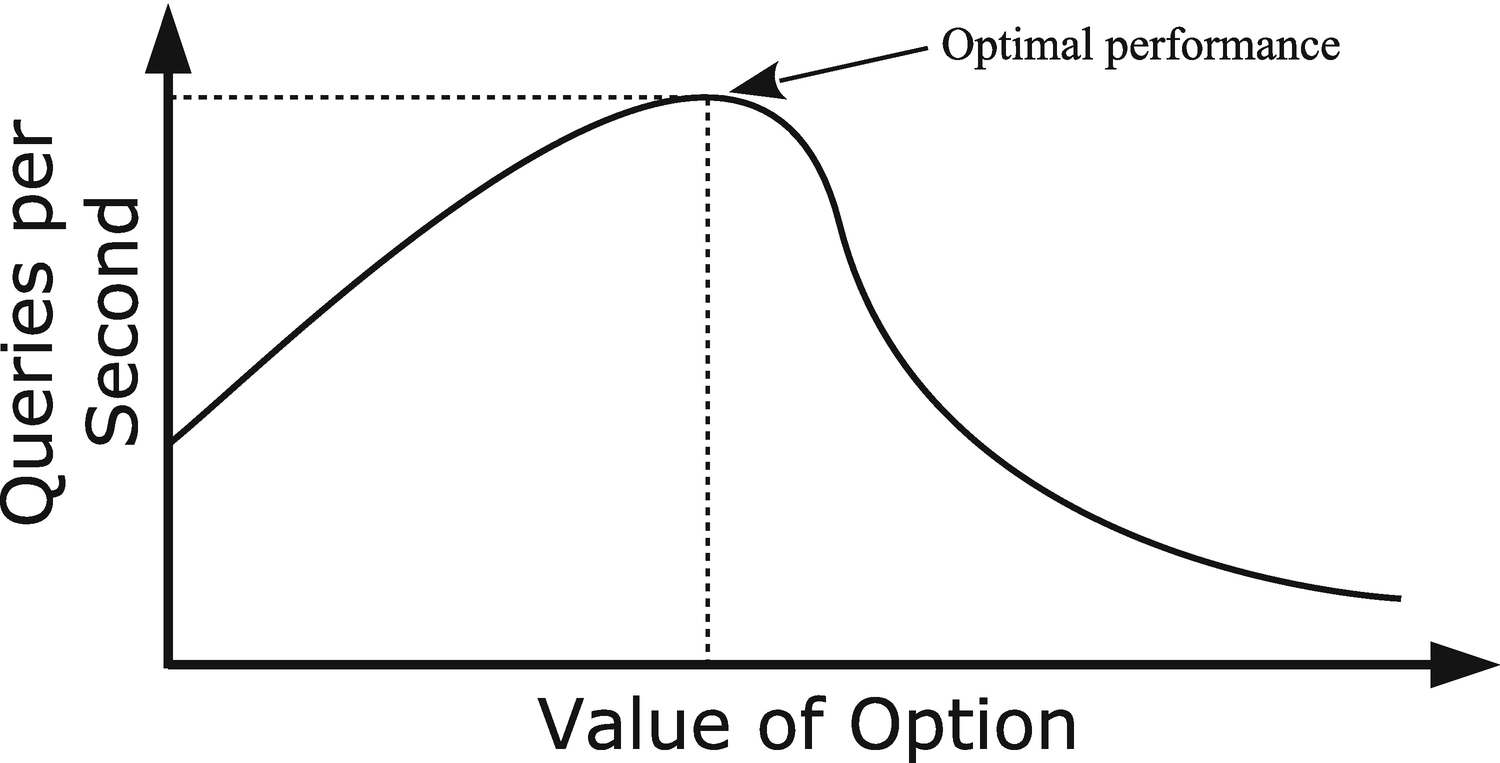
A typical relationship between the option value and performance
By making small incremental changes, you maximize the chance of finding this sweet spot.
This relates to the next point: small is often better. Just because you, for example, have enough memory to increase a per query or per join buffer does not mean it makes the queries faster to increase the buffer size. It of course depends on the option to what extent this principle applies. For the size of the InnoDB buffer pool, it is better to have a relatively large buffer as it helps reduce disk I/O and serve data from memory. A key thing to remember about the buffer pool is also that memory allocations only happen when MySQL starts and when you dynamically increase the size of the buffer pool. However, for buffers such as the join buffer that may be allocated several times for a single query, the sheer overhead of allocating the buffer can become a problem. This is discussed further in the section “Query Buffers.” In all cases, for options that relate to resources, you need to remember that the resources you allocate to one feature are not available for other features.
The concept of “less is often better” applies both to the optimal value of a configuration option and to the number of options that you tune. The more options you set in the configuration file, the more cluttered your configuration file becomes, and the harder it becomes to keep the overview of what has been changed and why. (It also helps to group the settings by feature, e.g., to have all InnoDB settings together.) If you are in the habit of including options set to their default values, it is still better to leave them out as including the options means that you will miss out of changes to the default values that are implemented as part of optimizing the default configuration to reflect changes to the MySQL internals or to changes in what is considered standard hardware.
In MySQL 5.6 and later, a significant effort has gone into improving the default values for the MySQL configuration options. The changes mainly occur between major versions based on testing by the development team and feedback from the MySQL Support team, customers, and community members.
The recommendation is to start out setting as few options as possible. You will most likely want to set the size of the InnoDB buffer pool, the redo log, and possibly the table caches. You may also want to set some paths and ports, and you may have requirements that some features such as global transaction identifiers (GTIDs) or Group Replication are enabled. Beyond that, only make changes based on observations.
Start out with a minimal configuration that just sets the size of the InnoDB buffer pool and redo logs, paths, and ports and enable required features. Otherwise, only make configuration changes based on observations.
The last two points in the list are related: make sure that you understand what the option does and consider the side effects. Understanding what the option does helps you identify whether the option is useful for your case and what other effects the option may have. As an example, consider the sync_binlog option. This tells how often updates to the binary log should be synced to disk. In MySQL 8, the default is to sync with every commit which for disks that have poor sync performance can significantly impact the query performance. It may thus be tempting to set sync_binlog to 0 which disables forced synchronizations; however, are the side effects acceptable? If you do not sync the changes, then they only live in memory until something else – such as the memory being required for other uses – forces the sync to happen. This means that if MySQL crashes, then the changes are lost, and if you have a replica, you will have to rebuild it. Is that acceptable?
Even if you can accept potentially losing binary log events, there is a more subtle side effect of using sync_binlog = 0. Just because the sync does not happen at transaction commit does not mean it never happens. The maximum size of a binary log is 1 GiB (the max_binlog_size option) plus the size of the last transaction, and rotating the binary log means the old binary log is flushed to disk. Nowadays that usually means that MySQL will end up writing 1 GiB and then flush it all at once. Even on fast disks, it does take a measurable amount of time to write out a gigabyte of data. In the meantime, MySQL cannot perform any commits, so any connection issuing a commit (whether implicit or explicit) will stall until the sync has completed. This can come as a surprise, and the stall may end up being long enough to upset the end user – who may be a customer. The author of this book has seen commit stalls arising from binary log rotations in the range of a couple of seconds up to half a minute. In short, sync_binlog = 0 gives the overall highest throughput and average commit latency, but sync_binlog = 1 provides the best data safety and the most predictable commit latency.
The rest of this chapter provides some recommendations for the options related to query tuning that most often need to be changed.
InnoDB Overview
Given that all queries involving tables interact with the InnoDB storage engine, it is important to take some time to look at the configuration of the InnoDB parameters. These include the size of the InnoDB buffer pool and the redo log size – two configurations that need to be adjusted for most production systems.
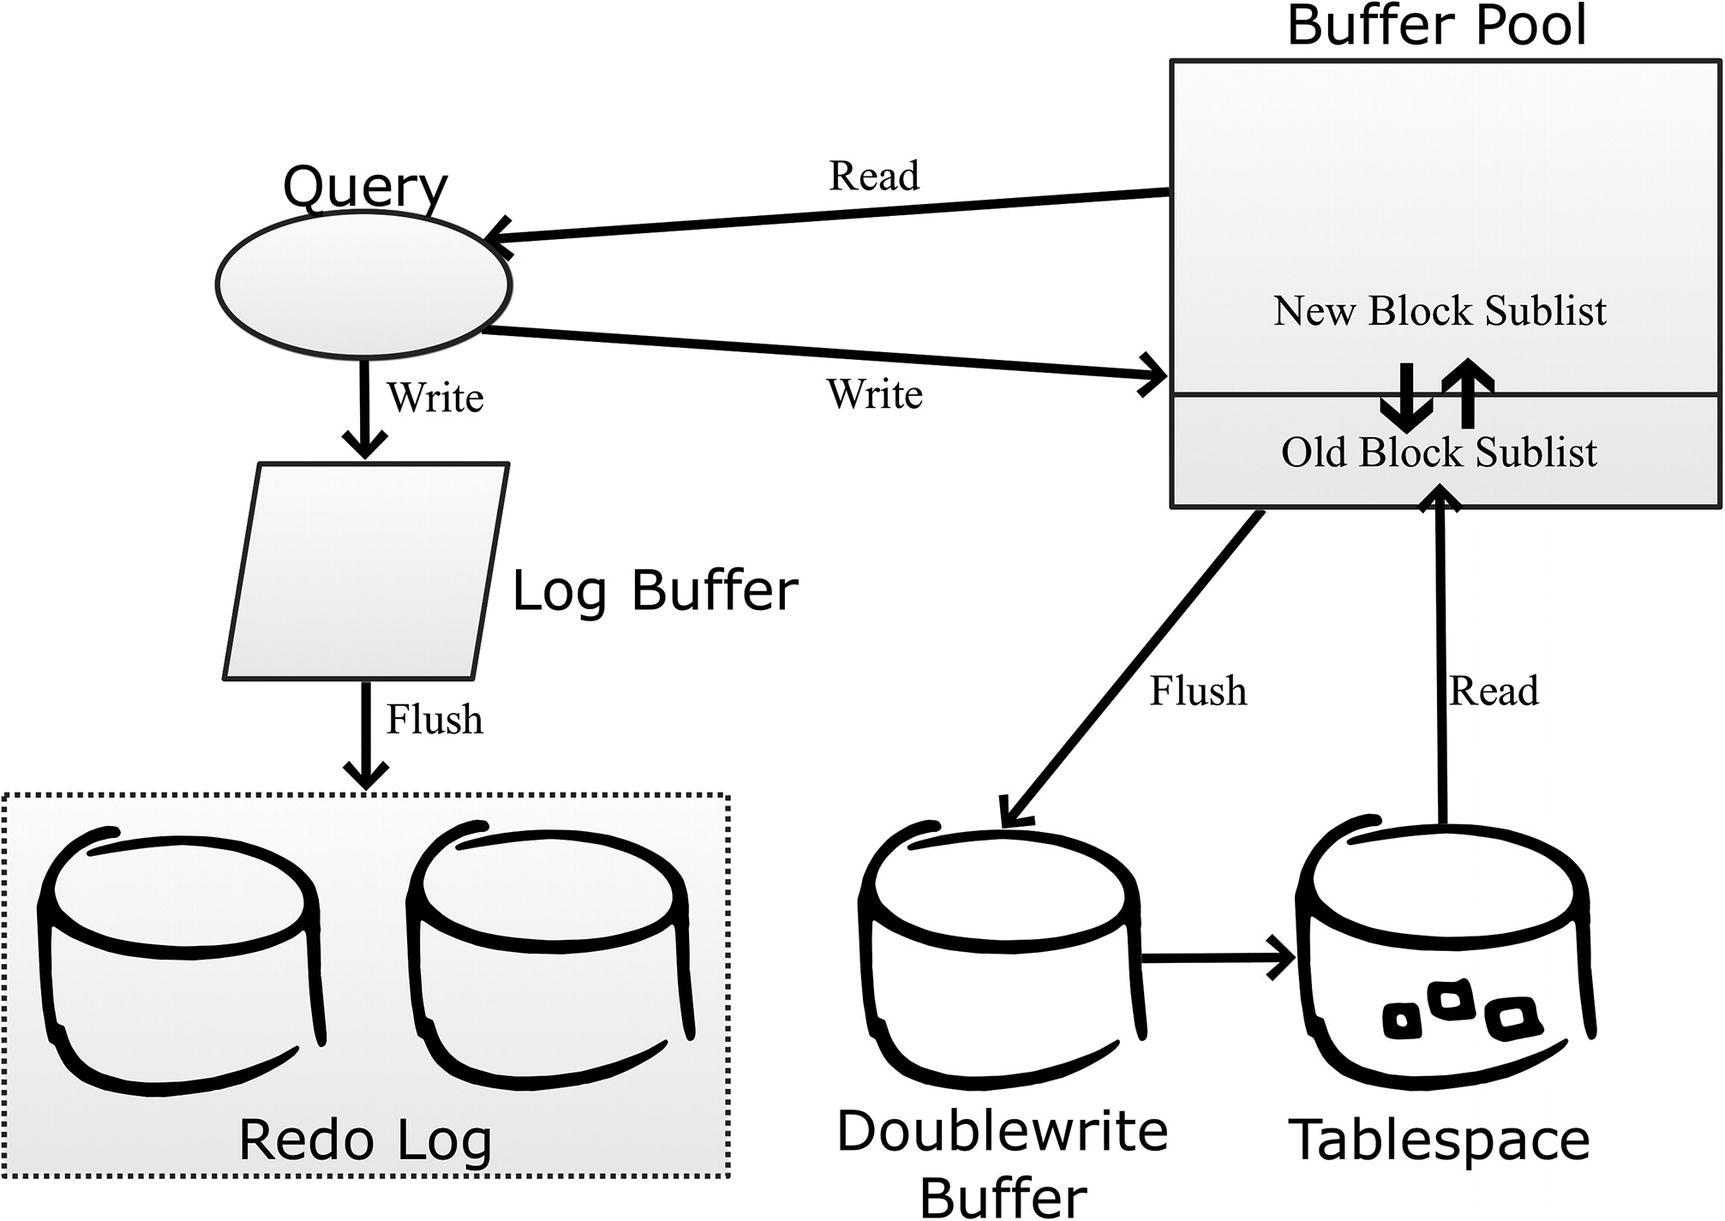
The InnoDB data flow
When a query requests data, it is always read from the buffer pool. If the data is not already in the buffer pool, it is fetched from the tablespace. InnoDB divides the buffer pool into two parts: the old blocks sublist and the new blocks sublist. Data is always read into the head (top) of the old blocks sublist in whole pages. If data from the same page is required again, the data is moved to the new blocks sublist. Both sublists use the least recently used (LRU) principle to determine which pages to expel when it is necessary to create room for a new page. Pages are evicted from the buffer pool from the old blocks sublist. Since new pages spend time in the old blocks sublist before being promoted to the new blocks sublist, it means that if a page is used once, but then left unused, then it will quickly be expelled from the buffer pool again. This prevents large rare scans such as backups from polluting the buffer pool.
When a query updates changes, the changes are written to the in-memory log buffer and from there written and later flushed to the redo log which consists of at least two files. The redo log files are used in a circular fashion, so writes start at the beginning of one file and then fill up the file, and when it is full, InnoDB continues with the next file. The files are fixed in size and with a fixed number of files. When the log reaches the end of the last file, InnoDB moves back to the beginning of the first file.
The changes are also written back to the buffer pool and marked as dirty until they can be flushed to the tablespace files. InnoDB uses the doublewrite buffer to ensure it is possible to detect whether a write was successful or not in case of a crash. The doublewrite buffer is necessary, because most file systems do not guarantee atomic writes as an InnoDB page is larger than the file system block size. At the time of writing, the only file system where it is safe to disable the doublewrite buffer is ZFS.
Even if the file system is supposed to handle atomic writes of InnoDB pages, it may not work in practice. An example of this is the EXT4 file system with journaling enabled which in theory should be safe without the doublewrite buffer but in practice can cause corrupted data.
The configuration options that will be discussed in the next sections revolve around this lifecycle of the data.
The InnoDB Buffer Pool
The InnoDB buffer pool is where InnoDB caches data and indexes. Since all requests for data go through the buffer pool, it naturally becomes a very important part of MySQL from a performance perspective. There are a few important parameters for the buffer pool that will be discussed here.
Important configuration options for the buffer pool
Option Name | Default Value | Comments |
|---|---|---|
innodb_buffer_pool_size | 128 MiB | The total size of the InnoDB buffer pool. |
innodb_buffer_pool_instances | Auto-sized | How many parts the buffer pool is split into. The default is 1 if the total size is less than 1 GiB and otherwise 8. For 32-bit Windows, the default is 1 below 1.3 GiB; otherwise, each instance is made to be 128 MiB. The maximum number of instances is 64. |
innodb_buffer_pool_dump_pct | 25 | The percentage of the most recently used pages in the buffer pool that are included when dumping the pool content (backing it up). |
innodb_old_blocks_time | 1000 | How long in milliseconds a page must have resided in the old blocks sublist before a new read of the page promotes it to the new blocks sublist. |
innodb_old_blocks_pct | 37 | How large the old blocks sublist should be in percentage of the whole buffer pool. |
innodb_io_capacity | 200 | How many I/O operations per second InnoDB is allowed to use during nonurgent conditions. |
innodb_io_capacity_max | 2000 | How many I/O operations per second InnoDB is allowed to use during urgent conditions. |
innodb_flush_method | unbuffered or fsync | The method InnoDB uses to write the changes to disk. The default is unbuffered on Microsoft Windows and fsync on Linux/Unix. |
These options will be discussed in more detail in the remainder of this section starting with options related to the size of the buffer pool.
The option key_buffer_size has nothing to do with caching InnoDB indexes. The option got its name in the early days of MySQL when the MyISAM storage engine was the main storage engine, so it was not needed to prefix the option with mysiam. Unless you use MyISAM tables, there is no reason to configure key_buffer_size.
The Buffer Pool Size
The most important of these options is the size of the buffer pool. The default size of 128 MiB is nice for setting up a test instance on your laptop without draining it of memory (and why the default value is so small), but for a production system, you most likely want to allocate more memory. You can benefit from increasing the size until your working data set fits into the buffer pool. The working data set is the data that is needed by the queries executing. Typically, this is a subset of the total data set as some data is inactive, for example, because it concerns events in the past.
If you have a large buffer pool and have core dumps enabled, then disable the innodb_buffer_pool_in_core_file option to avoid dumping the entire buffer pool if a core dump occurs. The option is available in MySQL 8.0.14 and later.
 . The two variables Innodb_pages_read and Innodb_buffer_pool_read_requests are status variables. Listing 23-1 shows an example of how to calculate the buffer pool hit rate.
Calculating the buffer pool hit rate
Getting the buffer pool hit rate directly from InnoDB
What is important to realize is that the hit rates returned directly by InnoDB are for the period since the buffer pool statistics were last retrieved, and they are per buffer pool instance. If you want full control of what period a hit rate is for, you need to calculate it yourself either by using the status variables or the NUMBER_PAGES_READ and NUMBER_PAGES_GET from the INNODB_BUFFER_POOL_STATS view.
You should aim at having the buffer pool hit rate as close to 100% or 1000/1000 as possible. That said, in some cases it is simply not possible as the amount of data cannot possibly fit into memory. In that case, the buffer pool hit rate is still useful as it allows you to monitor the effectiveness of the buffer pool over time and compare to the general query statistics. If the buffer pool hit rate starts to drop with a degradation in query performance, you should look at making provisions so the buffer pool can be increased in size.
Buffer Pool Instances
MySQL has supported multiple buffer pool instances since version 5.5. The reason for introducing it was that typical database workloads had more and more queries running in parallel with the prevalence of more and more CPUs per host. This led to mutex contention when accessing data in the buffer pool.
One of the solutions to reduce the contention is to allow the buffer pool to be split into multiple instances with different mutexes for each instance. The number of instances is controlled with the innodb_buffer_pool_instances option. The total amount of buffer pool specified with innodb_buffer_pool_size is divided evenly among the instances. Except on 32-bit Windows, the default is to have one instance for a buffer pool size of less than 1 gigabyte. For larger buffer pools, the default is eight instances. The maximum number of instances is 64.
For a single-threaded workload, the optimal is to have all of the memory in a single buffer pool. The more parallel your workload is, the more additional instances help reduce contention. The exact effect of increasing the number of buffer pools depends on the extent the parallel queries request data stored in different pages. If all requests are for different pages, you can benefit from increasing the number of instances toward the number of concurrent queries. If all queries request data in the same page, there is no benefit of more instances. In general, be careful not to make each buffer pool instance too small. If you do not have monitoring data proving otherwise, allow each instance to be 1 gigabyte or larger for buffer pools that are at least 8 gigabytes large.
Dumping the Buffer Pool
One of the common problems with restarts of a database is that the caching does not work well for a while until the cache has been warmed up. This can lead to very poor query performance and poor end user satisfaction. The solution to this is to store a list of the most frequently used pages in the buffer pool at shutdown and read these pages into the buffer pool immediately after a restart even if no queries have requested them yet.
This feature is enabled by default, and the main thing to consider is how much of the buffer pool you want to include in the dump. This is controlled with the innodb_buffer_pool_dump_pct option which takes the percentage of pages to include. The default is 25%. The pages are read from the head of the new blocks sublist, so it is the most recently used pages that are included.
The dump just includes a reference to the page that should be read, so the size of the dump is roughly 8 bytes per page. If you have a 128 GiB buffer pool, and you are using 16 KiB pages, there are 8,388,608 pages in the buffer pool. If you use the default of 25% for the buffer pool dump, that gives a dump that is around 16 MiB. The dump is stored in the file ib_buffer_pool in the data directory.
When you create backups by copying the tablespace files (a physical or raw backup), back up the ib_buffer_pool file as well. You can use the innodb_buffer_pool_dump_now option to create a new copy of the most recently used pages. This is, for example, done automatically by MySQL Enterprise Backup. However, for logical backups (where the data is exported as an SQL or CSV file), the ib_buffer_pool file is not useful.
If you encounter problems with slow queries after restarting, consider increasing innodb_buffer_pool_dump_pct to include a larger part of the buffer pool in the dump. The main drawbacks of increasing the option are that the shutdown takes longer as more page references are exported, the ib_buffer_pool file becomes larger, and it takes longer to load the pages after the restart. Loading the pages back into the buffer pool happens in the background, but by including more pages it may take longer before all of the most important pages are restored in the buffer pool.
The Old Blocks Sublist
If you have a data set that is larger than the buffer pool, a potential problem is that a large scan can pull in data that is just used for that scan and then not used again for a long time. When that happens, you risk that more frequently used data is expelled from the buffer pool and the queries needing that data will suffer until the scan has completed and the balance has been restored. Logical backups such as those made by mysqlpump and mysqldump are good examples of jobs that can trigger the issue. The backup process needs to scan all data, but the data is not needed again until the time of the next backup.
To avoid this issue, the buffer pool is split into two sublists: the new and old blocks sublists. When pages are read from the tablespaces, they are first “quarantined” in the old blocks sublist, and only if the page has been in the buffer pool for more than innodb_old_blocks_time milliseconds and is used again will it be moved to the new blocks sublist. This helps make the buffer pool scan resistant as a single table scan will only read rows from a page in rapid succession and then not use the page again. This leaves InnoDB free to expel the page once the scan has completed.
The default value for innodb_old_blocks_time is 1000 milliseconds which for most workloads is enough to avoid scans polluting the buffer pool. If you have jobs doing scans where the job returns to the same rows again after a short while (but longer than one second), then you can consider increasing innodb_old_blocks_time, if you do not want the subsequent accesses to promote the page to the new blocks sublist.
The size of the old blocks sublist is set by the innodb_old_blocks_pct option which specifies the percentage of the buffer pool that should be used for the old blocks sublist. The default is to use 37%. If you have a large buffer pool, you may want to reduce innodb_old_blocks_pct to avoid newly loaded pages taking up too much of the buffer pool. The optimal size of the old blocks sublist also depends on the rate you load transient pages into the buffer pool.
Obtaining information about the new and old blocks sublists
Pages made young means that a page located in the old blocks sublist is moved to the new blocks sublist. That a page is not made young means it stays in the old blocks sublist. The two rate columns are per second since the last time the data was fetched. The pages per thousand gets are the number of pages made young or kept in the old blocks sublist per thousand pages requested; this is also since the last report.
One possible sign that you may need to configure the old blocks sublist is a decrease in buffer pool hit rate while scans are ongoing. If the rate of making pages young is high and you have large scans at the same time, you should consider increasing innodb_old_blocks_time to prevent subsequent reads to make the page young. Alternatively, consider decreasing innodb_old_blocks_pct to evict the pages from the scan after a shorter time in the old blocks sublist.
Vice versa, if you have few scans and the pages stay in the old blocks sublist (the non-young making stats are high), then you should consider decreasing innodb_old_blocks_time to promote the pages faster or increase innodb_old_blocks_pct to allow the pages to remain in the old blocks sublist for longer before they are evicted.
Flushing Pages
InnoDB needs to balance how hard it works at merging changes into the tablespace files. If it is too lazy, the redo log ends up being full and a forced flush is required, but if it works too hard it can impact the performance of other parts of the system. Needless to say, it is complex to get the equation right. Except during a crash recovery or after restoring a physical backup such as the ones created with MySQL Enterprise Backup, the merging is done by flushing dirty pages from the buffer pool to the tablespace files.
In recent MySQL versions, you do not in general need to do much as the adaptive flush algorithm that InnoDB uses is good at striking a good balance as long as there is enough redo log to work with. There are primarily three options to consider: two for setting the I/O capacity of the system and one for setting the flush method.
The two options for the I/O capacity are innodb_io_capacity and innodb_io_capacity_max. The innodb_io_capacity option is used during normal flushing of changes and should be set to the number of I/O operations InnoDB is allowed to use per second. In practice, it is not very easy to know what value to use. The default is 200 which roughly corresponds to a low-end SSD. Usually high-end storage can benefit from setting the capacity to a few thousand. It is better to start out with a relatively low value and increase it if your monitoring shows that flushing is falling behind and there is spare I/O capacity.
The innodb_io_capacity and innodb_io_capacity_max options are not only used to determine how quickly InnoDB flushes dirty pages to the tablespace files. Other I/O activities such as merging data from the change buffer are also included.
The innodb_io_capacity_max option tells how hard InnoDB is allowed to push if the flushing is falling behind. The default is the minimum of 2000 and twice the value of innodb_io_capacity. In most cases the default value works well though if you have a low-end disk, you should consider reducing the setting to below 1000. If you experience an asynchronous flush (this will be discussed with the redo logs) and your monitoring shows that InnoDB does not use enough I/O capacity, increase the value of innodb_io_capacity_max.
Setting the I/O capacity too high can severely impact the performance of the system.
fsync: This is the default value. InnoDB uses the fsync() system call. The data will also be cached in the operating system I/O cache.
O_DSYNC: InnoDB uses the O_SYNC option when opening the redo log files (synchronous writing) and uses fsync for the data files. The reason O_SYNC is used instead of O_DSYNC is that O_DSYNC has been proven to be too unsafe, so O_SYNC is used instead.
O_DIRECT: This is similar to fsync, but the operating system I/O cache is bypassed. It only applies to the tablespace files.
O_DIRECT_NO_FSYNC: This is the same as O_DIRECT except that the fsync() system call is skipped. Due to bugs in the EXT4 and XFS file systems, this is not safe to use until MySQL 8.0.14 where a workaround for those bugs was implemented. If the redo log files are located on a different file system than the tablespace files, you should use O_DIRECT instead of O_DIRECT_NO_FSYNC. On most production systems, this is the best option.
Additionally, there are a couple of experimental flush methods that should only be used for performance testing.1 These experimental methods are not covered here.
It is very complex which flush method will give the best performance. Since InnoDB caches its data itself and does so better than the operating system possibly can (as InnoDB knows how the data is used), it is natural to believe one of the O_DIRECT options will work the best. This is also usually the case; however, life is more complicated and, in some cases, fsync is faster. So you will need to test on your system to know for sure which flush method works the best. Another thing is that when restarting MySQL without restarting the operating system, if you use the fsync flush method, then InnoDB can benefit from the I/O cache when reading the data for the first time.
At the other end of the data flow there are the redo logs.
The Redo Log
The redo log is used to persist committed changes while providing sequential I/O to make the performance as good as possible. To improve the performance, changes are first written to the in-memory log buffer before they are written to the log files.
A background process then merges the changes from the buffer pool through the doublewrite buffer into the tablespaces. The pages that have not yet been merged to the tablespace file cannot be evicted from the buffer pool as they are considered dirty. That a page is dirty means that it has a different content than the same page from the tablespace, so InnoDB is not allowed to read the page from the tablespace until the changes have been merged.
Important configuration options for the redo log
Option Name | Default Value | Comments |
|---|---|---|
innodb_log_buffer_size | 16 MiB | The size of the log buffer where redo log events are stored in memory before being written to the on-disk redo log files. |
innodb_log_file_size | 48 MiB | The size of each file in the redo log. |
innodb_log_files_in_group | 2 | The number of files in the redo log. There must be at least two files. |
The remainder of this section covers these options.
Log Buffer
The log buffer is an in-memory buffer that InnoDB uses to buffer the redo log events before writing them to disk. This allows the transactions to keep the changes in memory until the buffer is full or the changes are committed. The default size of the log buffer is 16 MiB.
If you have large transactions or a high number of smaller concurrent transactions, it is recommended to increase the size of the log buffer. You set the size of the log buffer using the innodb_log_buffer_size option. In MySQL 8 (unlike older versions), you can change the size dynamically. Optimally, the buffer should be large enough that InnoDB only has to write out the changes when they are committed; however, this should of course be weighed against what the memory can otherwise be used for. If a single transaction has a large amount of changes in the buffer, it can also slow down the commit as all the data must be written to the redo log at that time, so that is another thing to consider for very large log buffer sizes.
Once the log buffer is full or the transaction is committed, the redo log events are written to the redo log files.
Log Files
The redo log is fixed in size and consists of a number of files – at least two – each of the same size. The main consideration when configuring the redo logs is to ensure that they are large enough to not become “full.” In practice, full means 75% of the capacity as at that time an asynchronous flush is triggered. The asynchronous flush blocks the thread that triggered the flush while in principle the other threads can continue doing their work. In practice, the asynchronous flush is so ferocious that it usually causes the system to come to a grinding halt. There is also a synchronous flush, which triggers at 90% capacity and blocks all threads.
You control the size with the two options innodb_log_file_size and innodb_log_files_in_group. The total redo log size is the product of the two values. The recommendation is to set the file size up to 1–2 GiB and adjust the number of files to get the desired total size with a minimum of two files. The reason not to let each redo log file become very large is that they are buffered in the operating system I/O cache (even with innodb_flush_method = O_DIRECT), and the larger the files, the more potential for the redo log to use a large amount of memory in the I/O cache. The total size of the redo log is not allowed to exceed 512 GiB, and there can be at most 100 files.
The larger the redo log, the more changes can be stored that are not yet flushed from the buffer pool to the tablespaces. This can increase the recovery time in case of a crash and the time it takes to perform a normal shutdown.
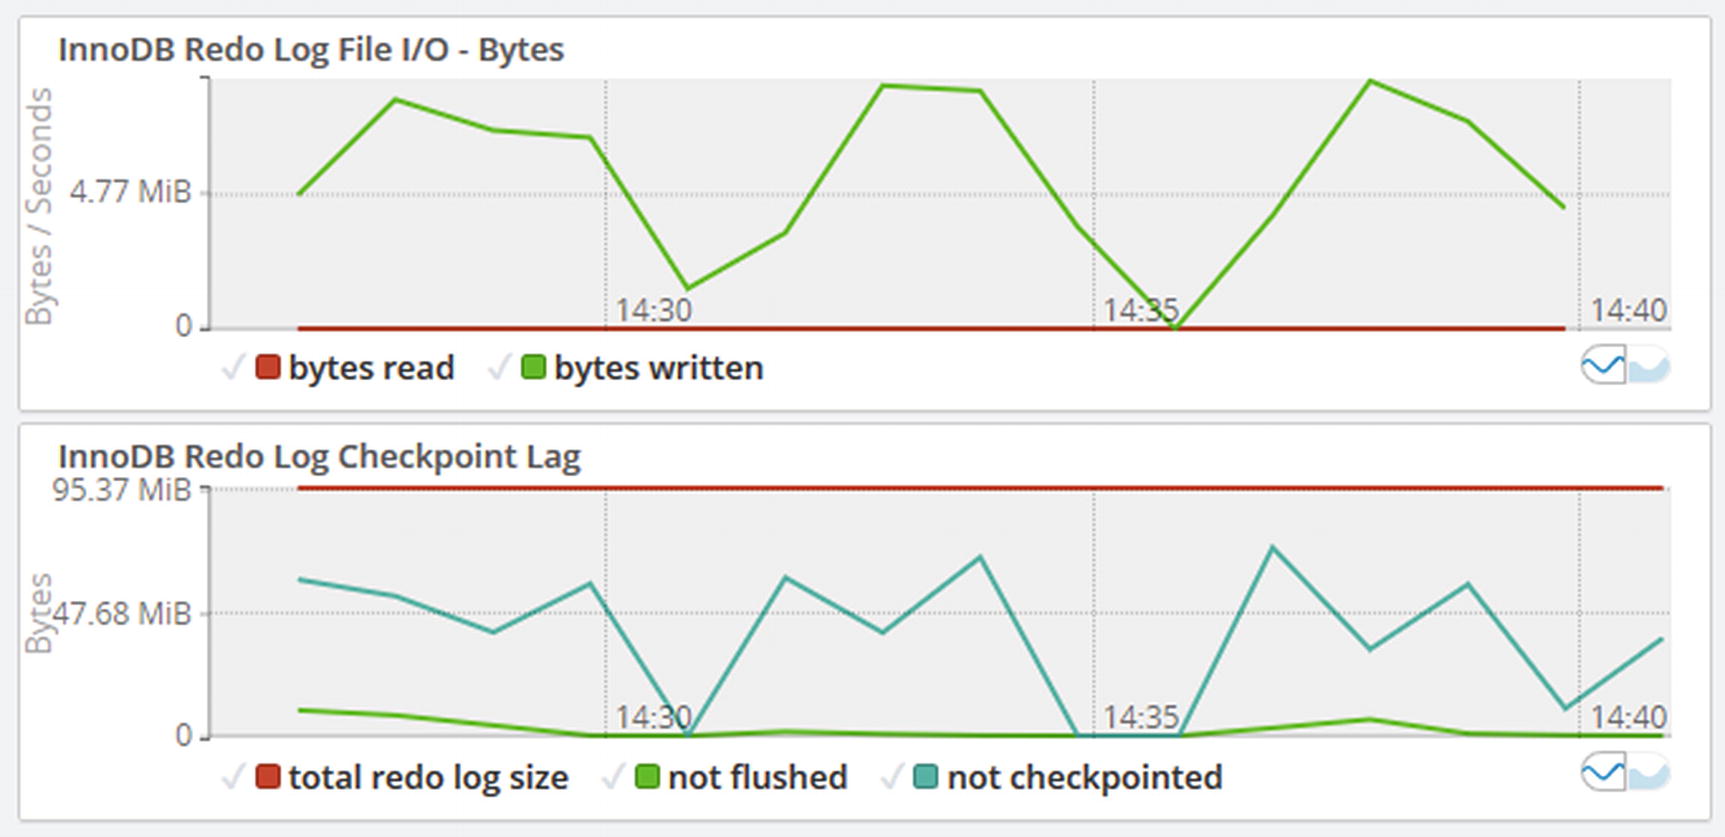
Timeseries graphs for the redo log
Make sure the part of the redo log that is not checkpointed stays clear of the 75% mark. In this example, the highest peak is at around 73 MiB out of 96 MiB (at 14:37) of redo log which means that almost 76% of the redo log was used for dirty pages. That means there was an asynchronous flush around that time which would have impacted the queries running at the time. You can use the I/O rate for the redo log file to get an idea of how stressed the file system is doing I/O for the redo log.
The best way to inspect the current redo log usage manually is to enable the log_lsn_current and log_lsn_last_checkpoint InnoDB metrics which allow you to query the current log sequence number and the log sequence number when the last checkpoint was made. The checkpoint lag in percentage of the total redo log is then calculated as  .
.
Querying the redo log usage
The required InnoDB metrics are first enabled. The overhead of having these enabled is very small, so it is fine to leave them enabled. The values of the metrics are then queried from the sys.metrics view followed by using the INNODB_METRICS table to calculate the lag directly. Finally, the log sequence numbers are also found in the InnoDB monitor output. The log sequence numbers change very rapidly, so even if you query them in rapid succession, they will have changed if there is any work going on. The values reflect the amount of work in bytes that has been done in InnoDB, so they will be different on any two systems.
Parallel Query Execution
Since MySQL 8.0.14, InnoDB has limited support for executing a query in parallel. This happens by performing a scan of the clustered index or partitions using multiple read threads. The implementation was greatly improved in 8.0.17 which is what is considered here.
The parallel scans happen automatically based on the number of index subtrees that will be scanned. You can configure the maximum number of threads that InnoDB can create for parallel execution across all connections by setting the innodb_parallel_read_threads option. These threads are created as background threads and are only present when needed. If all parallel threads are in use, InnoDB will revert to single-threaded execution for any additional queries until threads are available again.
As of MySQL 8.0.18, the parallel scans are used for SELECT COUNT(*) (multiple tables are allowed) without any filter conditions and for the second of the two scans performed by CHECK TABLE.
You can try with smaller tables such as the ones in the world database and see the difference in number of background threads.
If you see that all of the configured read threads are in use most of the time, and you have spare CPUs, you can consider increasing the value of innodb_parallel_read_threads. The maximum supported value is 256. Remember to leave enough CPU resources for the single-threaded queries.
If you see semaphore waits and monitoring of the CPUs suggests there is contention for the CPU resources while there are many parallel read threads present, you can consider decreasing innodb_parallel_read_threads to reduce the parallelism of the queries.
Query Buffers
MySQL uses several buffers during query execution. These include storing column values used in joins, a buffer for sorting, and more. It is tempting to think that more is better for these buffers, but it is not in general the case. On the contrary, often less is better. This section discusses why this is so.
Is the buffer large enough for the job required?
Is there enough memory?
How much does it cost to allocate the buffer?
If the buffer is not large enough, the algorithm cannot perform at its most optimal as more iterations are needed, or it is necessary to overflow to disk. However, in some cases the configured value of a buffer serves as a minimum size rather than the maximum size. This is, for example, the case with the join buffer with the size set by join_buffer_size. The minimum size is always allocated, and if it is not large enough to hold the columns needed from a single row when using it for a join, then it will be expanded as required.
The question about memory is also very relevant. Probably the most common reason that MySQL crashes is that the operating system is out of memory and the operating system kills MySQL. The amount of memory required for the various buffers may not seem to add up to much for a single query, but if you then multiply all of the concurrently executing queries and add the memory required for the idle connections and the global allocations, you may suddenly be closer to being out of memory than you like. This may also lead to swapping which is a major performance killer.
The last point is more surprising to most. Allocating memory has a cost, and often the more memory you need, the more expensive it is per byte. For example, on Linux there are various thresholds where the allocation method changes. These thresholds depend on the Linux distribution, but may, for example, be at 256 KiB and 2 MiB. If you cross one of the thresholds, the allocation method becomes more expensive. This is part of the reason the default value for the options join_buffer_size, sort_buffer_size, and read_rnd_buffer_size is 256 KiB. This means that sometimes it is better to have a buffer that is a little too small, because the benefit of an optimally sized buffer does not improve performance enough to compensate for the overhead of allocating more memory.
Allocation of buffers is one of the areas where improvements are made, so upgrading can in some cases allow you to use larger buffers without the traditional drawbacks. For example, in MySQL 8.0.12 and later, a new algorithm for the sort buffer is used. This means that on Linux/Unix and for nonconcurrent sorts on Windows, memory is allocated incrementally which makes it safer performance wise to have a large value for sort_buffer_size. You still need to consider how much memory a single query is allowed to use though.
The conclusion is that it is better to be conservative with the buffers that are allocated for the duration of a query. Keep the global settings small – the default values are a good starting point – and increase only for the queries where you can demonstrate that there is a significant improvement when increasing the setting.
Internal Temporary Tables
When a query needs to store the result of a subquery, combine the results of UNION statements, and similar, it uses an internal temporary table. MySQL 8 features the new TempTable storage engine which is vastly superior to the MEMORY engine used in previous versions when keeping the table in memory as it supports variable width columns (blob and text columns are supported from version 8.0.13). Additionally, the TempTable engine supports spilling over to disk using mmap, so storage engine conversion can be avoided if the table does not fit in memory.
There are primarily two settings to consider for internal temporary tables in MySQL 8: how much memory is the TempTable engine allowed to use and what should happen if it is necessary to overflow to disk.
You configure the maximum amount of memory used by internal temporary tables using the temptable_max_ram option. This is a global setting which defaults to 1 GiB. This memory is shared among all queries needing internal temporary tables, so it is easy to cap the total memory usage. The temptable_max_ram option can be set dynamically.
If you run out of memory, it is necessary to start storing the temporary tables on disk. How that is done is controlled by the temptable_use_mmap option which was introduced in version 8.0.16. The default value is ON which means that the TempTable engine allocates space for the on-disk data as memory-mapped temporary files. This is also the method used prior to 8.0.16. If the value is set to OFF, InnoDB on-disk internal temporary tables are used instead. Unless you experience problems with the memory-mapped files, it is recommended to use the default setting.
Querying the TempTable memory usage
The two first queries request the global usage, whereas the third query asks for per thread usage. The first query uses the sys.memory_global_by_current_bytes view which returns the events that at the time have a current_alloc greater than 0. This shows that the TempTable engine is in use and a part of the data has spilled over to disk using the memory-mapped files. The second query uses the Performance Schema and will always return data for both events even if there currently is no memory allocated to it. The third query shows which threads have allocated TempTable memory. Due to the way the TempTable overflow is implemented, it is not possible to see which threads have files on disk using the Performance Schema.
Summary
This chapter went through the general considerations of configuring a MySQL instance and the options that most commonly need adjustments. When you consider making changes to the configuration, the most important thing is that you think about why you want to make the change, what it should solve, and why it will solve it and that you confirm whether it did work. You can best confirm this by making small incremental changes to a single option at a time.
The three options that are the most likely to benefit from non-default values are the innodb_buffer_pool_size for setting the size of the InnoDB buffer pool and innodb_log_file_size and innodb_log_files_in_group options for setting the size of the redo log. Other InnoDB options that were discussed control the number of buffer pool instances, how much of the buffer pool is included when dumping it, the old blocks sublist, how to flush pages, and the size of the redo log buffer.
In MySQL8.0.14 and later, there is support for executing some queries in parallel. You can limit the parallelism using the innodb_parallel_read_threads option which starting from 8.0.17 specifies the total maximum of parallel threads InnoDB will create across all connections. The parallel execution threads are considered background threads and only exist while queries are being executed in parallel.
Your queries may also benefit from larger per query buffers, but you must be careful as larger values do not necessarily work better than smaller values. The recommendation is to use the default value for these buffers and only increase them for queries where testing proves there is a significant benefit.
Finally, the internal temporary tables were discussed. In MySQL 8 these use the TempTable engine which supports spilling over to disk when the global maximum memory usage is reached. It is also possible to convert the internal temporary table to InnoDB when storing it on-disk.
The next chapter will look into how you can change queries to perform better.