
In the days before it was possible to get query statistics from the Performance Schema, the slow query log was the main source of information to find queries that are candidates for optimization. Even today, the slow query log should not be completely dismissed.
The slow query log has three main advantages over the statement digest information in the Performance Schema. The logged queries are persisted, so you can review the information after MySQL has been restarted, the queries are logged with timestamps, and the actual queries are logged. For these reasons, the slow query log is often used together with the Performance Schema.
A monitoring solution like MySQL Enterprise Monitor (https://dev.mysql.com/doc/mysql-monitor/en/mem-qanal-using.html) can overcome these limitations of the Performance Schema, so if you have a monitoring solution that includes detailed query information, you are less likely to need the slow query log.
There are also disadvantages of the slow query log. The overhead is higher than for the Performance Schema as the queries are written to a plain text file and there is no concurrency support when writing the events. There is also only limited support for querying the log (you can store the slow query log in a table, but that has its own disadvantages) which makes it less practical to use it during an investigation.
This chapter will look at how you can configure the slow query log, how the raw log events look, and how you can use the mysqldumpslow (mysqldumpslow.pl on Microsoft Windows) script to aggregate the log.
Configuration
There are several options that you can use to configure the slow query log and which queries are logged. As the overhead of having the log enabled goes up with the number of queries you log, a well-configured slow query log is important. Logging “just the right amount” of queries also makes it easier to identify queries of interest.
Configuration options for the slow query log
Option/Default Value/Scope | Description |
|---|---|
min_examined_row_limit Default: 0 Scope: Global, Session | Only queries examining more rows than this value will be logged. This can particularly be useful when enabling logging of all queries doing full scans. |
log_output Default: FILE Scope: Global | Controls whether the slow query log and general query log are logged to a file, a table, or both or not at all. |
log_queries_not_using_indexes Default: OFF Scope: Global | When enabled, all queries that perform a full table or index scan are logged irrespective of how long they take. |
log_short_format Default: OFF Scope: Global | When enabled, less information is logged. This option can only be set in the configuration file. |
log_slow_admin_statements Default: OFF Scope: Global | When enabled, administrative statements like ALTER TABLE and OPTIMIZE TABLE are eligible for logging. |
log_slow_extra Default: OFF Scope: Global | When enabled, there is extra information such as the value of the Handler_% status variables for the query. It is only supported when logging to a file and in MySQL 8.0.14 and later. The main reason to not enable log_slow_extra is if you have scripts that require the old format. |
log_slow_slave_statements Default: OFF Scope: Global | When enabled, replicated statements are also eligible for logging. This only applies for binary log events in statement format. |
log_throttle_queries_not_using_indexes Default: 0 Scope: Global | When you have enabled logging of all queries doing a full scan, this option can throttle the maximum number of times the query can be logged per minute. |
log_timestamps Default: UTC Scope: Global | Whether to use UTC or the system time zone for the timestamps. This option also applies to the error log and general query log. It only applies when logging to a file. |
long_query_time Default: 10 Scope: Global, Session | The minimum query latency in seconds before a query is logged (unless it is doing full scans and you have enabled logging those queries). Fractional seconds are supported. Set to 0 to log all queries. Warning: Logging all queries has a significant overhead and is best done on test systems or for short periods of time. |
slow_query_log Default: OFF Scope: Global | Whether to enable the slow query log. |
slow_query_log_file Default: <hostname>-slow.log Scope: Global | The path and filename of the slow query log file. The default location is in the data directory and is named from the hostname of the system. |
It is recommended to leave log_output at the default and log the events to the file set by slow_query_log_file. It may seem attractive to get the slow query log as a table; however, the data is in that case saved as comma-separated values (CSV), and queries against the table cannot use indexes. There are also some features such as log_slow_extra that are not supported with log_output = TABLE.
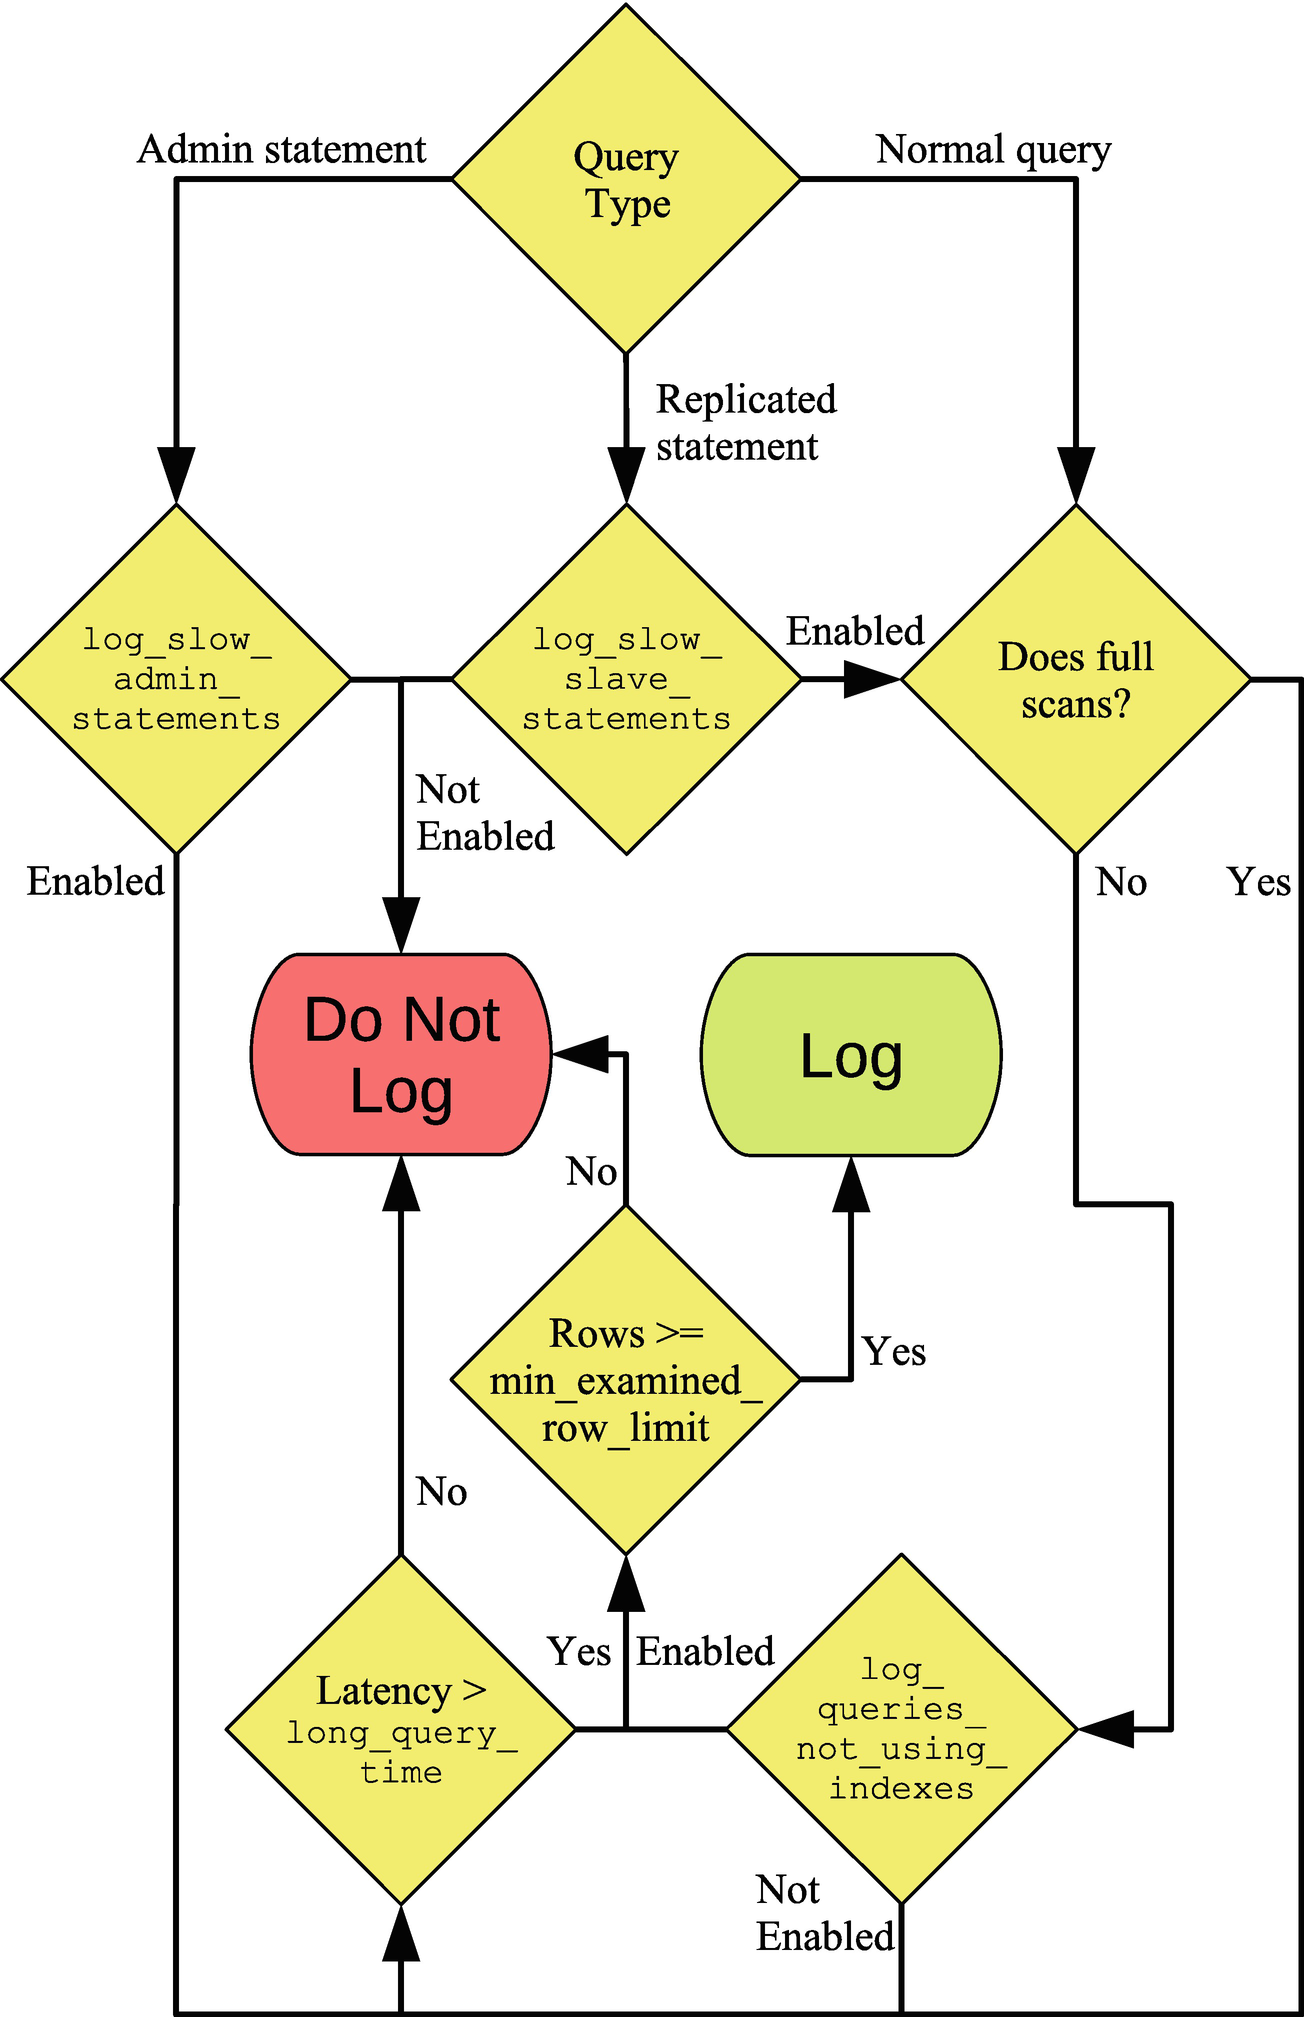
Flowchart to determine whether a query is logged to the slow log
The flow starts with the query type. For administrative and replicated statements, they only proceed if the respective option is enabled. Regular queries first check whether they qualify as not using indexes and then fall back on checking the query execution time (latency). If either condition is fulfilled, it is checked whether enough rows were examined. Some finer details such as throttling of statements not using indexes are left out of the figure.
Once you have the query settings that you want, you need to look at the events in the log to determine whether any queries need attention.
Log Events
The slow query log is built up of events in plain text. This means that you can use any text viewer that you like to inspect the file. On Linux and Unix, the less command is a good option as it has good support for handling large files. On Microsoft Windows, Notepad++ is a common choice, but there is not the same good support for large files. Another option on Windows is to install Windows Subsystem for Linux (WSL) which allows you to install a Linux distribution and, in that way, get access to commands like less.
A slow query log event in the default format
The first line shows when the query was executed. This is the timestamp where you can control whether UTC or the system time is used with the log_timestamp option . The second line shows which account executed the query and the connection id. The third line includes some basic statistics for the query: the query execution time, the time spent waiting for a lock, the number of rows returned to the client, and the number of rows examined.
The SET timestamp query sets the timestamp of the query measured in the number of seconds since epoch (January 1, 1970 00:00:00 UTC), and finally the slow query is in the last line.
In the statistics, the query time and the ratio between the number of examined rows and sent rows are of particular interest. The more rows that are examined compared to the number of returned rows, the less effective indexes are in general. However, you should always look at the information in context of the query. In this case, the query finds the ten country codes with the most cities. There is no way that can be found without performing a full table or index scan, so in this case there is a good reason for the poor ratio of examined rows to the number of sent rows.
Using log_slow_extra with the slow query log
The statistics of main interest from a performance perspective are the ones starting with Bytes_received and finishing with Created_tmp_tables. Several of these statistics are the equivalent of the Handler_% status variables for the query. In this case, you can see that it is the Read_next counter that is the main contributor to the large number of examined rows. Read_next is used when scanning an index to find rows, so it can be concluded that the query performs an index scan.
Viewing the raw events can be very useful if you need to know what was executed at a given time. If you are more interested in knowing which queries are in general contributing the most to the load on the system, you need to aggregate the data.
Aggregation
It is possible to aggregate the data in the slow query log using the mysqldumpslow (mysqldumpslow.pl on Microsoft Windows) script that is included in the MySQL installation. mysqldumpslow is a Perl script that by default normalizes the queries in the log by replacing numeric values with N and string values with 'S'. This allows the script to aggregate the queries in a similar way to what is done in the events_statements_summary_by_digest table in the Performance Schema.
The script requires Perl to be installed on your system. This is not a problem on Linux and Unix where Perl is always present, but on Microsoft Windows, you will need to install Perl yourself. One option is to install Strawberry Perl from http://strawberryperl.com/.
Command-line arguments for mysqldumpslow
Option | Default Value | Description |
|---|---|---|
-a | Do not replace number and string values with N and 'S'. | |
--debug | Execute in debug mode. | |
-g | Perform pattern matching (using the same syntax as for grep) on the queries and only include matching queries. | |
-h | * | By default, mysqldumpslow searches for files in the datadir set in the MySQL configuration file. This option specifies the hostnames that the files should match assuming the default slow query log filename is used. Wildcards can be used. |
--help | Display a help text. | |
-i | The instance name in the mysql.server startup script to use in the automatic algorithm to look for slow query log files. | |
-l | Do not extract the lock time for the queries. | |
-n | 0 | The minimum number of digits that must be in numbers before they are abstracted to N. |
-r | Reverse the order the queries are returned. | |
-s | at | How to sort the queries. The default is to sort according to the average query time. The full list of sort options will be covered separately. |
-t | (All) | The maximum number of queries to return in the result. |
--verbose | Print additional information during the execution of the script. |
The -s, -t, and -r options are the most commonly used. While mysqldumpslow can search for the slow query log using the MySQL configuration file in the default paths and hostname, it is more common to specify the path to the slow query log file as an argument on the command line.
The sorting options for mysqldumpslow
Total | Average | Description |
|---|---|---|
c | Sort by the number of times (count) the query has been executed. | |
l | al | Sort by the lock time. |
r | ar | Sort by the number of rows sent. |
t | at | Sort by the query time. |
It can sometimes be useful to generate several reports using different sorting options to get a better picture of the queries being executed on the instance.
The queries used to create slow query log events for a case study
There are three basic queries with different values for the WHERE clause or LIMIT clause. First, the city is found by the primary key which will search one row in order to return one row. Second, cities are found by the CountryCode which is a secondary index, so several rows are found but still the same number of rows are examined as returned. Third, all cities are examined to return the most populous cities.
Using mysqldumpslow to sort the queries by count
Notice how the WHERE and LIMIT clauses have been modified to use N and 'S'. The query time is listed as Time=0.00s (0s) which has the average query time first (0.00s) and the total time in parenthesis. Similar for the lock and row statistics.
The change is in the Time=%.6fs part of the first line. That will print the average execution time with microseconds.
Summary
This chapter has shown how the slow query log can be used to collect information about the queries executed on the MySQL instance. The slow query log is focused on capturing queries based on the execution time and whether they use indexes (in practice whether they perform full table or index scans). The main advantages of the slow query log over the Performance Schema are that the log includes the exact statements executed and that it is persisted. The disadvantages are the overhead and that it is harder to get a report returning the queries you are interested in.
First, the configuration options used to configure the slow query log were discussed. There are options to control the minimum execution time, whether queries not using indexes should be logged irrespective of the execution time, the types of queries to log, and more. In MySQL 8.0.14 and later, you can use the log_slow_extra to include more detailed information about the slow queries.
Second, two examples of the slow query log events were discussed. There was an example with the default information and one with log_slow_extra enabled. The raw events can be useful if you are looking for information of the queries executing at a given point in time. For more general queries, aggregating the data with the mysqldumpslow script is more useful. The use of mysqldumpslow was discussed in the last section.
The next part covers some tools that are useful in performance tuning starting with a discussion of monitoring using MySQL Enterprise Monitor as an example.