
Monitoring is one of the keystones of performance tuning whether you are looking at improving the performance at the system or query level. This chapter will look at one of the monitoring solutions available for MySQL, MySQL Enterprise Monitor, also known as MEM.
This chapter will start out with an overview of the architecture and principles of MySQL Enterprise Monitor. Then there is a section with installation instructions if you want to try MySQL Enterprise Monitor followed by a discussion of starting and stopping the Service Manager and how to add MySQL instances to the list of monitored instances. Finally, there is a tour of the user interface.
The rest of the book uses graphs and reports from MySQL Enterprise Monitor to illustrate the use of a monitoring tool, but you can also use other monitoring solutions. If you have no interest in MySQL Enterprise Monitor, you can skip this chapter.
Overview
MySQL Enterprise Monitor is Oracle’s monitoring solution that is dedicated to MySQL. It is available for customers as a companion to MySQL Server and is developed by the MySQL development team.
MySQL Enterprise Monitor requires a MySQL Enterprise Edition or MySQL Cluster CGE (Carrier Grade Edition) subscription to be used beyond the 30-day trial version (see also the download instructions in the next section). You can review the MySQL commercial features at www.mysql.com/products/enterprise/.
Service Manager: This component stores the collected metrics and provides the front-end interface to view the data and manage the configuration. The Service Manager consists of two parts which are a Tomcat server that is the application side of the Service Manager and the repository which is a MySQL database storing the data.
Agent: MySQL Enterprise Monitor uses Agents to connect to the MySQL instances that are monitored. The Service Manager includes a built-in Agent that by default monitors the repository. An Agent can monitor the local operating system as well as both local and remote MySQL instances.
This book follows the convention from the MySQL Enterprise Monitor manual (https://dev.mysql.com/doc/mysql-monitor/en/) to write Service Manager and Agent in title case.
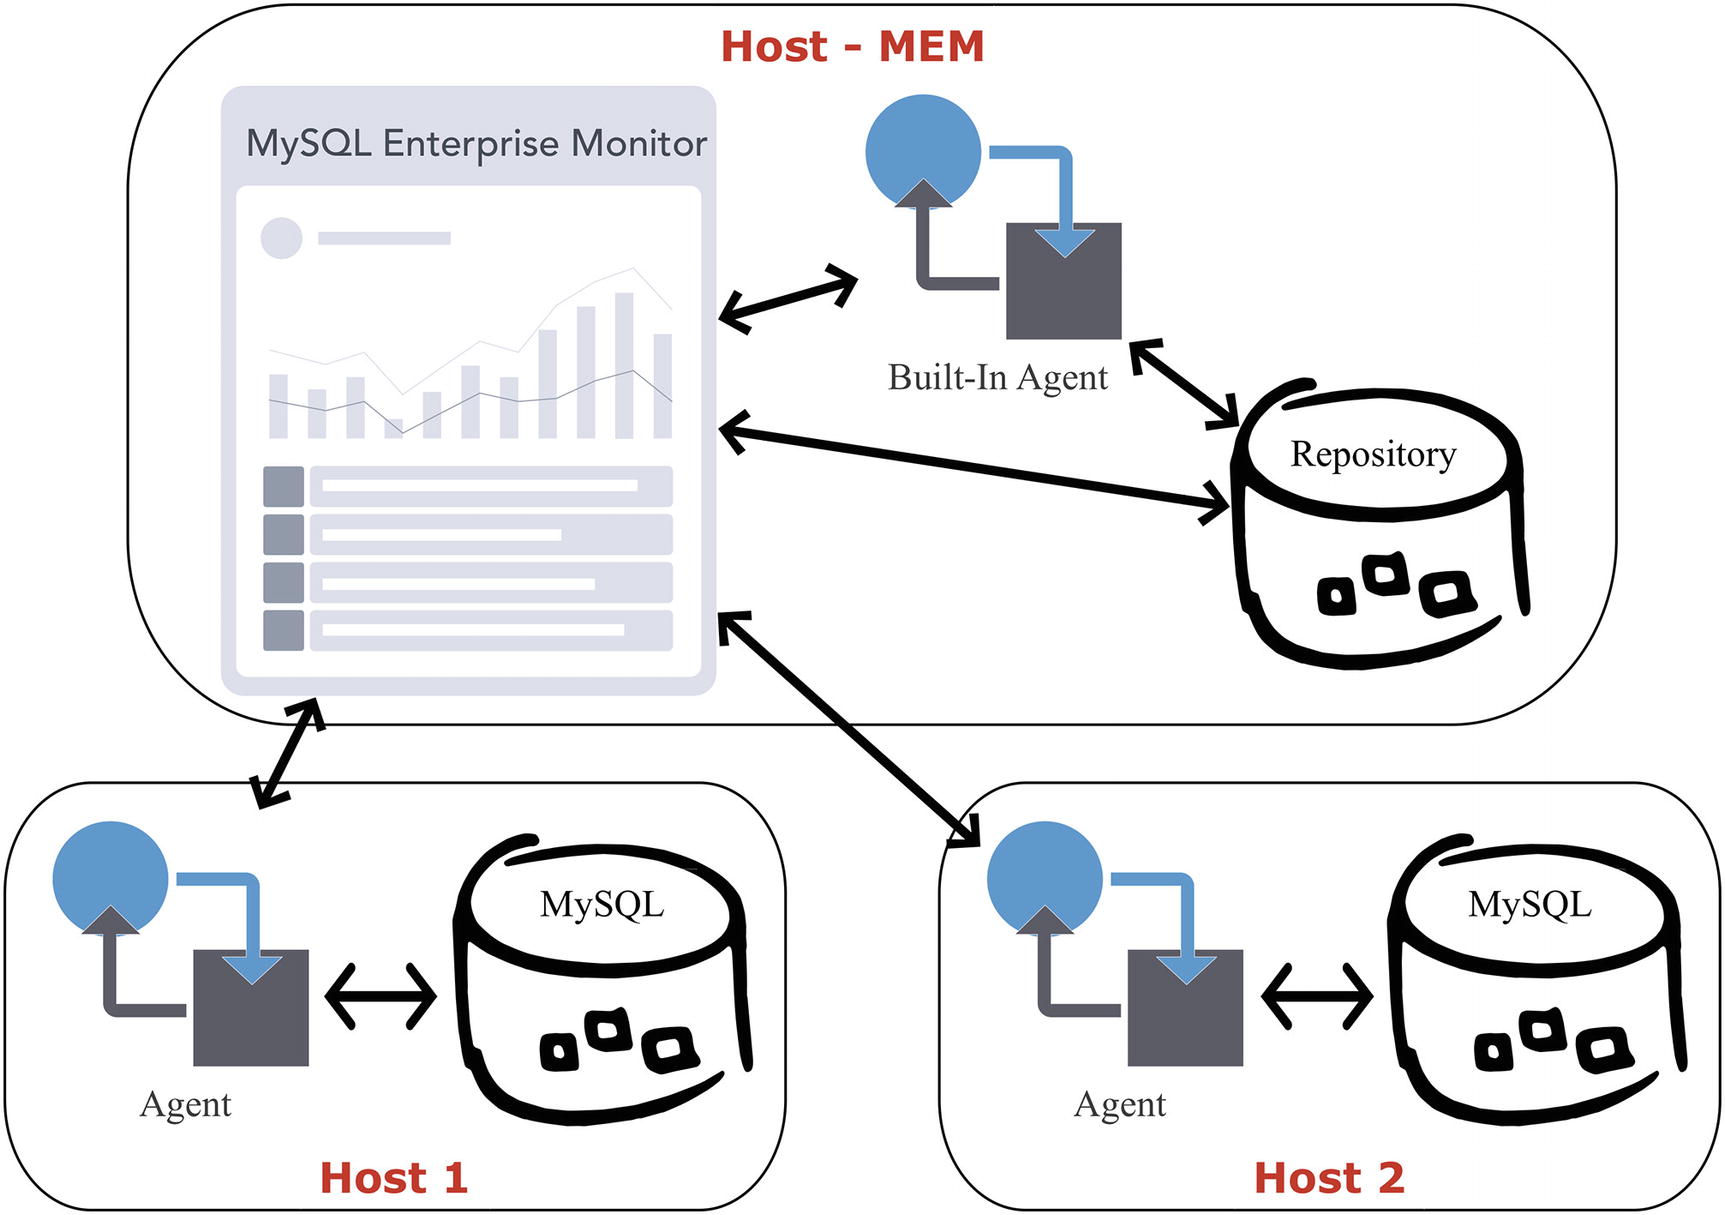
Overview of the MySQL Enterprise Monitor components
The host at the top is the one with the MySQL Enterprise Monitor Service Manager installed. It consists of the front end – here depicted with a web page with a graph – and the built-in Agent and the repository. The built-in Agent monitors the repository and can optionally be used to monitor other MySQL instances as well (not shown in the figure) which can be useful if you do not have access to the host, as is the case for some cloud products, or if you are testing and want to monitor a second MySQL instance on the same host as where the Service Manager is installed.
Host 1 and Host 2 are two hosts with MySQL Server installed. There is a MySQL Enterprise Monitor Agent installed on each host. The Agents query the MySQL instance for metrics and send the metrics to the Service Manager which stores them in the repository. The Service Manager can also send requests to the Agents, for example, to run an ad hoc report or to change the frequency the Agent collects metrics.
The installation process is similar for the Service Manager and the Agent and uses a customer installation program. The next section covers how to install the Service Manager. It is left as an exercise for the reader to install the Agent, if you want to try that.
Installation
The installation of MySQL Enterprise Monitor is quite straightforward though different from other MySQL products. Downloading the software is different from what you may be used to if you use the community editions of MySQL, and the installation is always done through a dedicated installer. This section will guide you through the download, installation process, and setup of MySQL Enterprise Monitor.
Download
The first step of the installation is to download MySQL Enterprise Monitor. There are two places you can download MySQL Enterprise Monitor. Existing MySQL customers can download it from the Patches & Updates tab in My Oracle Support (MOS) . This is the recommended location for customers as Patches & Updates gets updated more frequently and includes all versions since 2011. The alternative location is the Oracle Software Delivery Cloud at https://edelivery.oracle.com/ which also allows registered users to download a 30-day trial version. These instructions cover the Oracle Software Delivery Cloud.
New accounts and accounts that have not been used for a while may need to undergo export validation which can take a few days.
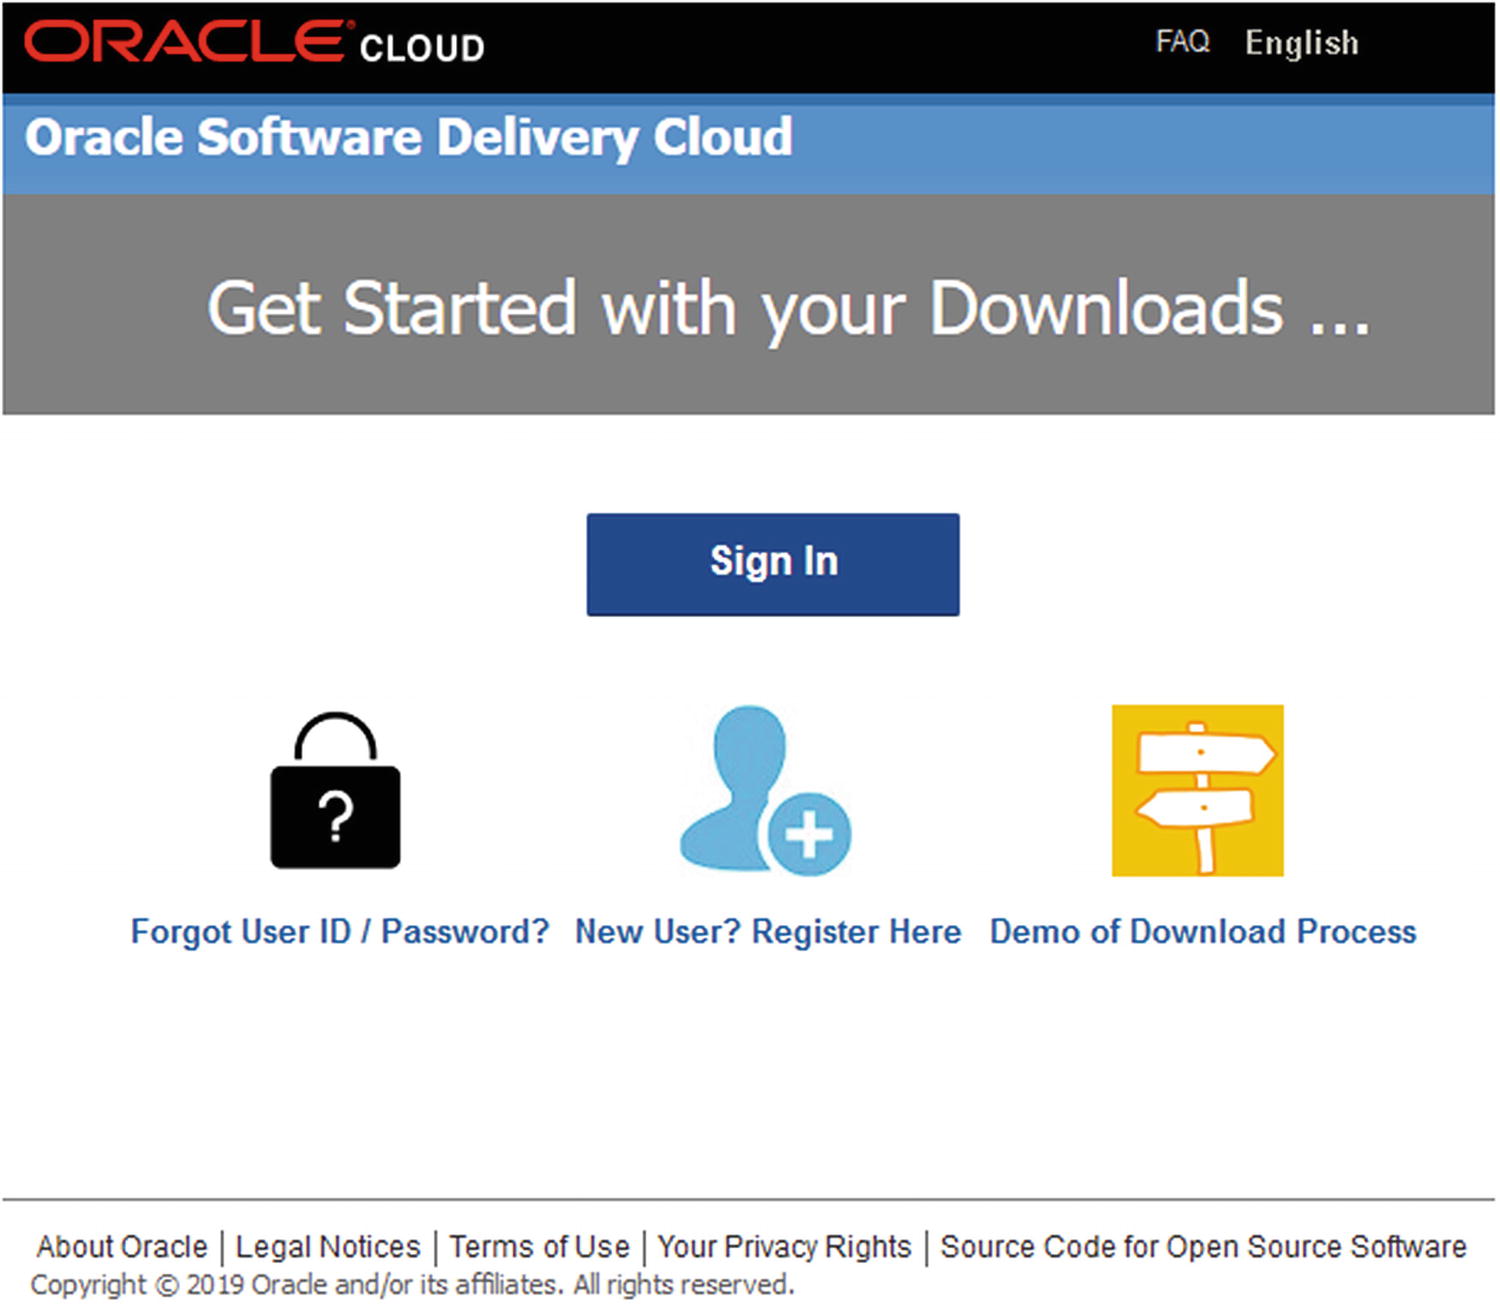
The Oracle Software Delivery Cloud homepage
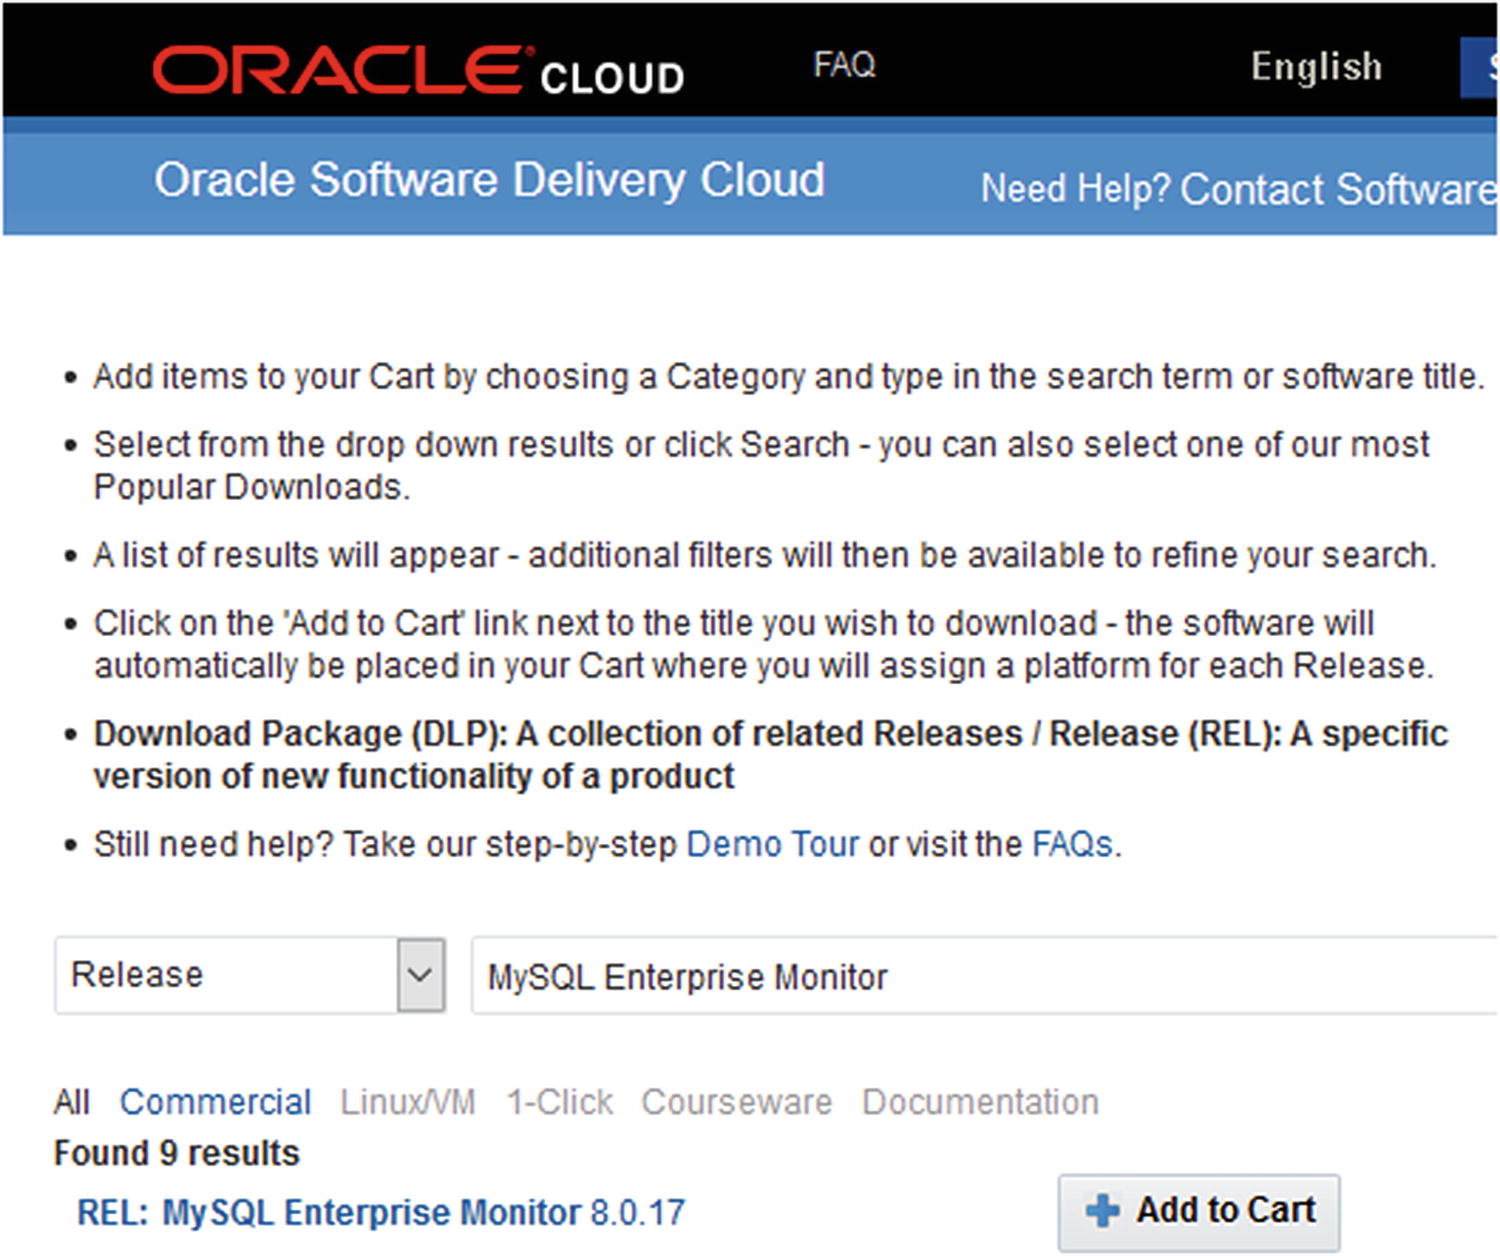
The Oracle Software Delivery Cloud search form
Choose Release in the drop box to the left of the text field. If you are interested in other products as well, you leave it on the default value which is All Categories which includes software packages. In the text field, enter MySQL Enterprise Monitor and click MySQL Enterprise Monitor in the search list that shows up or click the Search button to the right of the text field (neither the list nor button is shown in the figure). Then click Add to Cart next to the result for MySQL Enterprise Monitor.
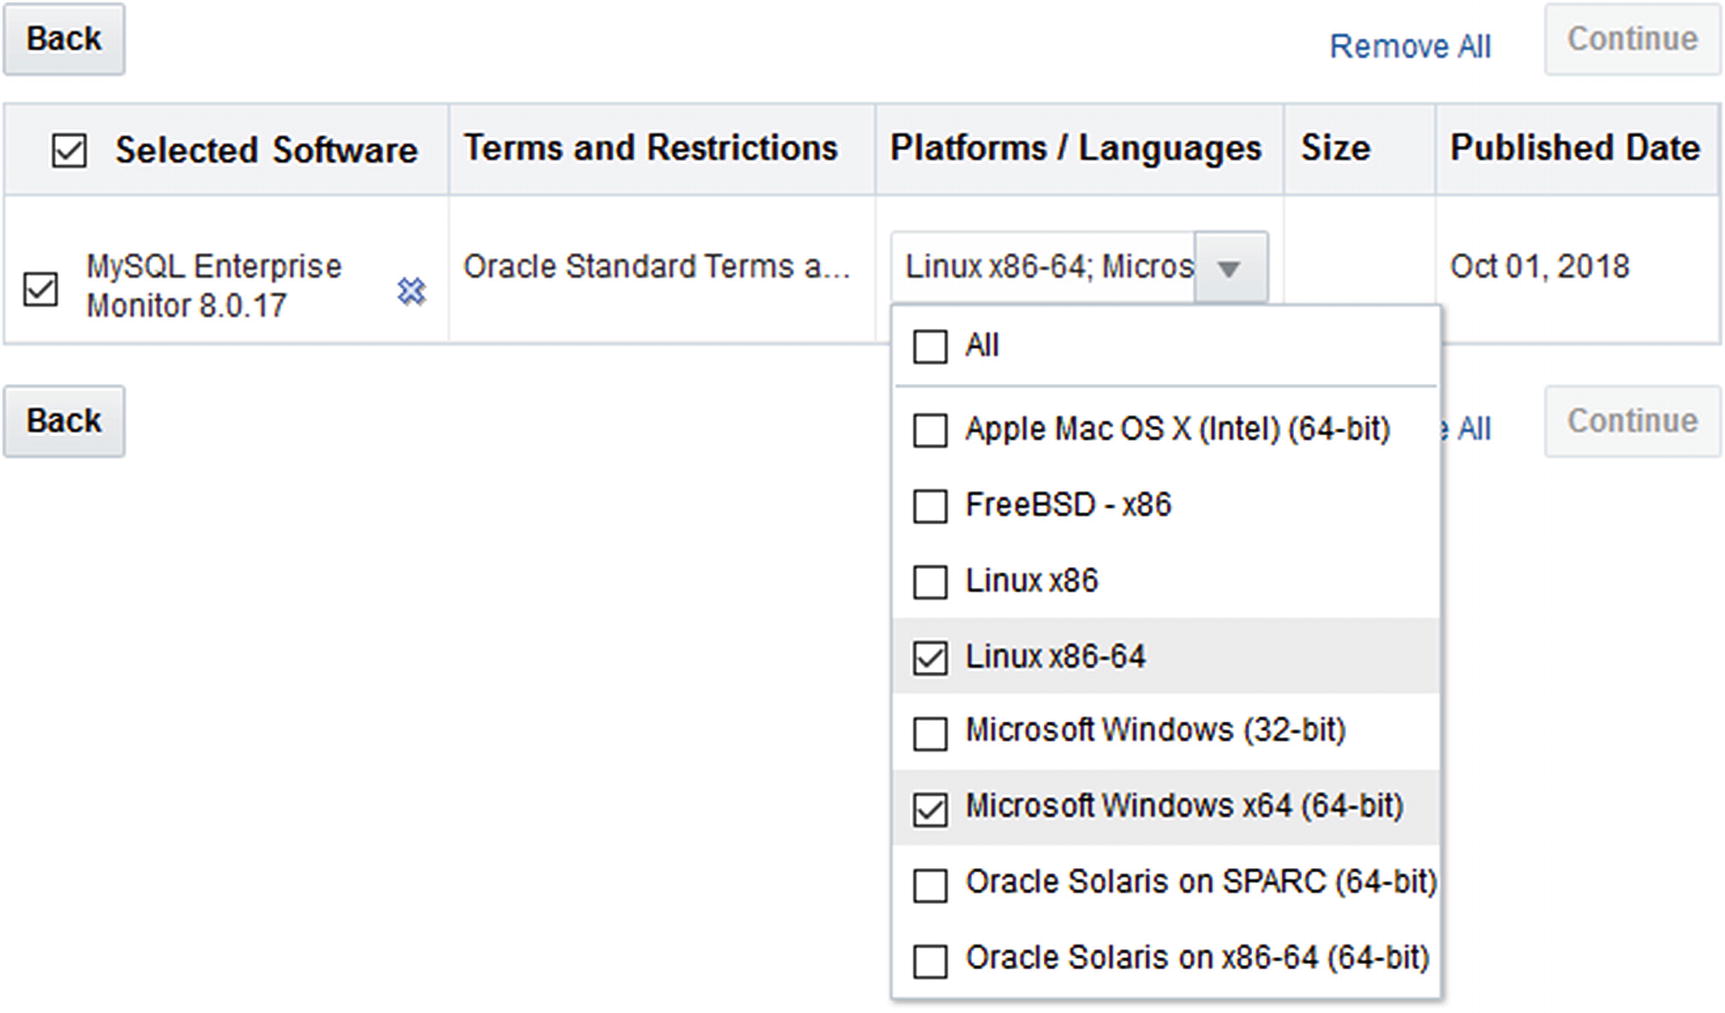
Choose the platforms to download for
Choose the platforms you are interested in. If you plan on having the Service Manager on one platform while monitoring instances with an Agent installed on another platform, you need to choose both platforms. When you have decided which platforms you want to download for, click Continue.
The next step is to accept the license agreement. Please read carefully before accepting it. The Oracle Trial License Agreement is at the end of the document. Once you have accepted the terms and conditions, click Continue.
You may be asked to complete a survey about the usability of Oracle Software Delivery Cloud as one of the steps.
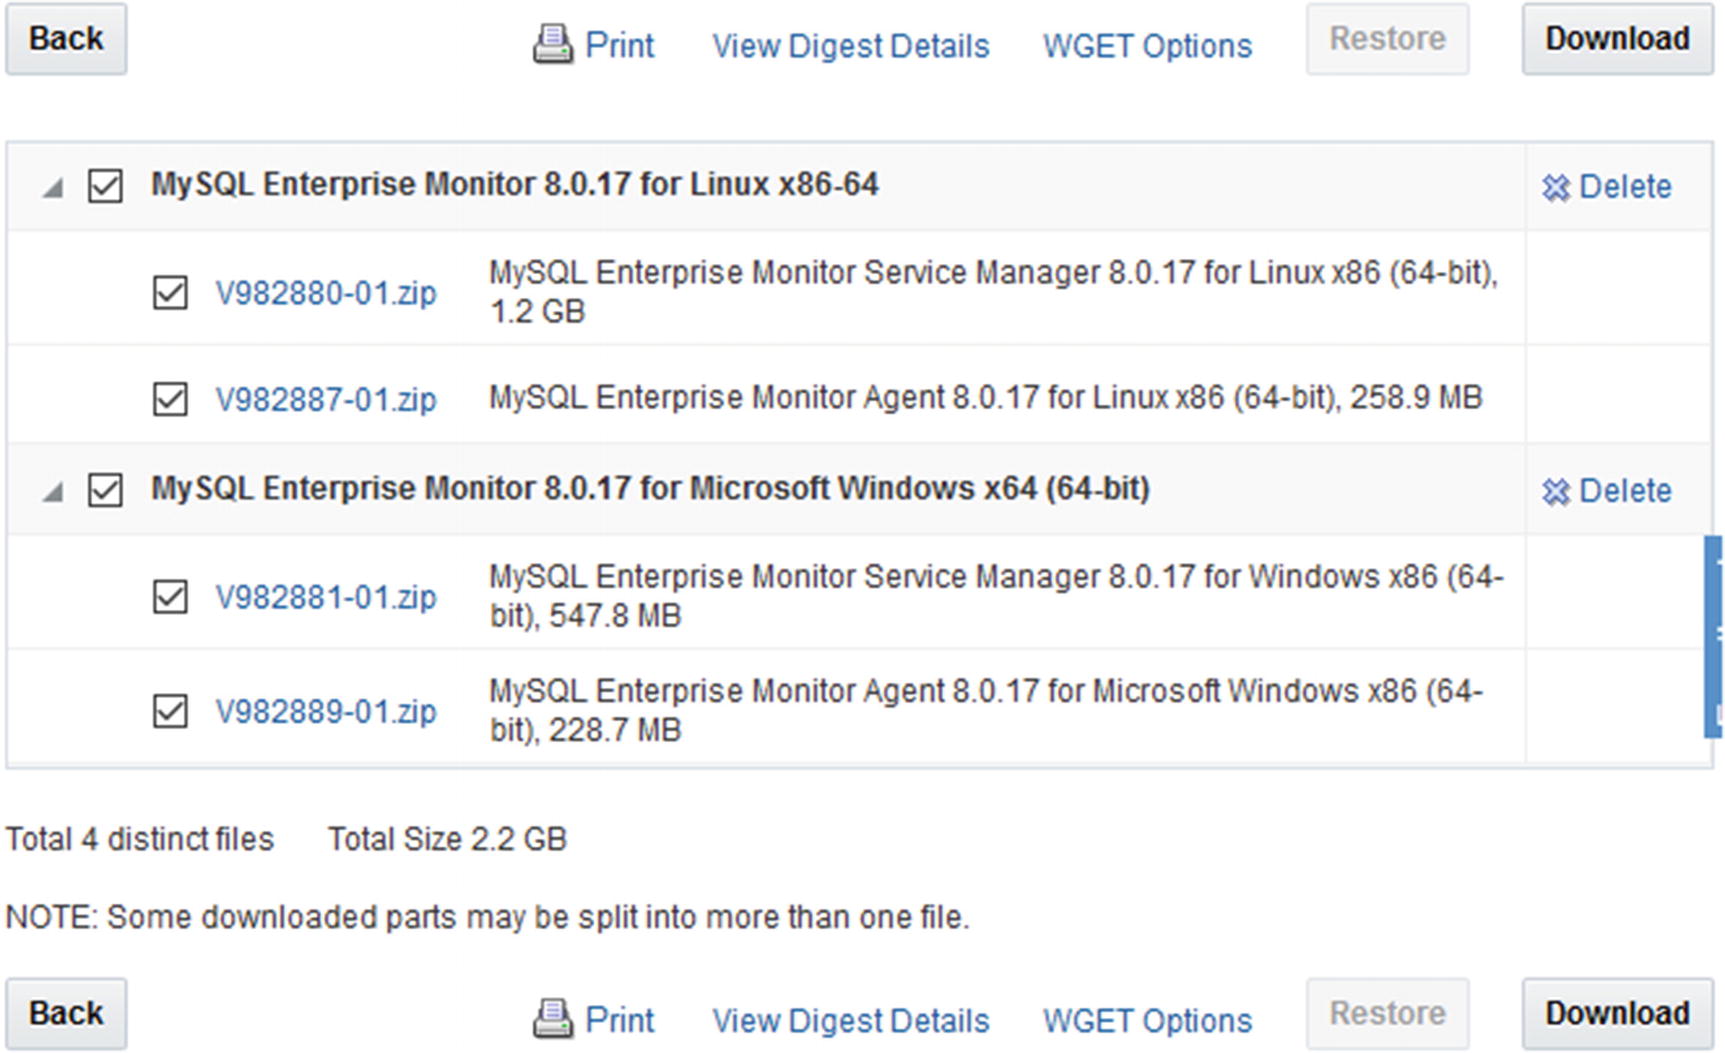
Choose which parts of MySQL Enterprise Monitor to download
There are two packages for each platform with one package for the Service Manager and one for the Agent. Optionally (recommended), you can click the View Digest Details link at the center bottom of the screenshot to show the SHA-1 and SHA-256 checksums for each file. You can use these to validate the download completed successfully.
You can download the files in two ways. If you click the filename, you download the files one by one. Alternatively, check the files you want and click the Download button to start the download using a download manager. If you do not have the download manager installed, you will be guided through installing it before the download commences.
Oracle Software Delivery Cloud uses generic filenames such as V982880-01.zip. It is useful to rename the file to a name that includes information about the product, platform, and version you have downloaded.
Once the download has completed, you can start the installation process.
Installation Process
MySQL Enterprise Monitor uses its own installer which works the same on all platforms. There is support for performing the installation using a wizard mode either through a graphical user interface or in text mode, or you can provide all the arguments on the command line and use the unattended mode.
The exact filenames and sizes depend on the platform and MySQL Enterprise Monitor version. Notice that there are two executables, in this case mysqlmonitor-8.0.17.1195-windows64-installer.exe and mysqlmonitor-8.0.17.1195-windows64-update-installer.exe. The former is for installing MySQL Enterprise Monitor from scratch, while the other (also sometimes called the update installer) is for performing an upgrade of an existing installation. The PDF and HTML files are the manual, but you are usually better off using the online manual at https://dev.mysql.com/doc/mysql-monitor/en/ as that is updated regularly.
If you want to use the text-based wizard or the unattended mode, invoke the installer with the --help argument to get a list of supported arguments.
This discussion will continue using the graphical user interface for the installation. You start the installation by executing the installer without any arguments. The first step is to choose the language (English, Japanese, and Simplified Chinese are available). Then you are told that you need to make sure you keep the usernames and passwords you enter during the installation in a secure location.
After passing the welcome screen, the configuration starts in proper by specifying the installation location. On Microsoft Windows, the default location is C:Program FilesMySQLEnterpriseMonitor, and on Linux it is /opt/mysql/enterprise/monitor when installing as the root user or mysql/enterprise/monitor relative to the home directory when installing as a non-privileged user.
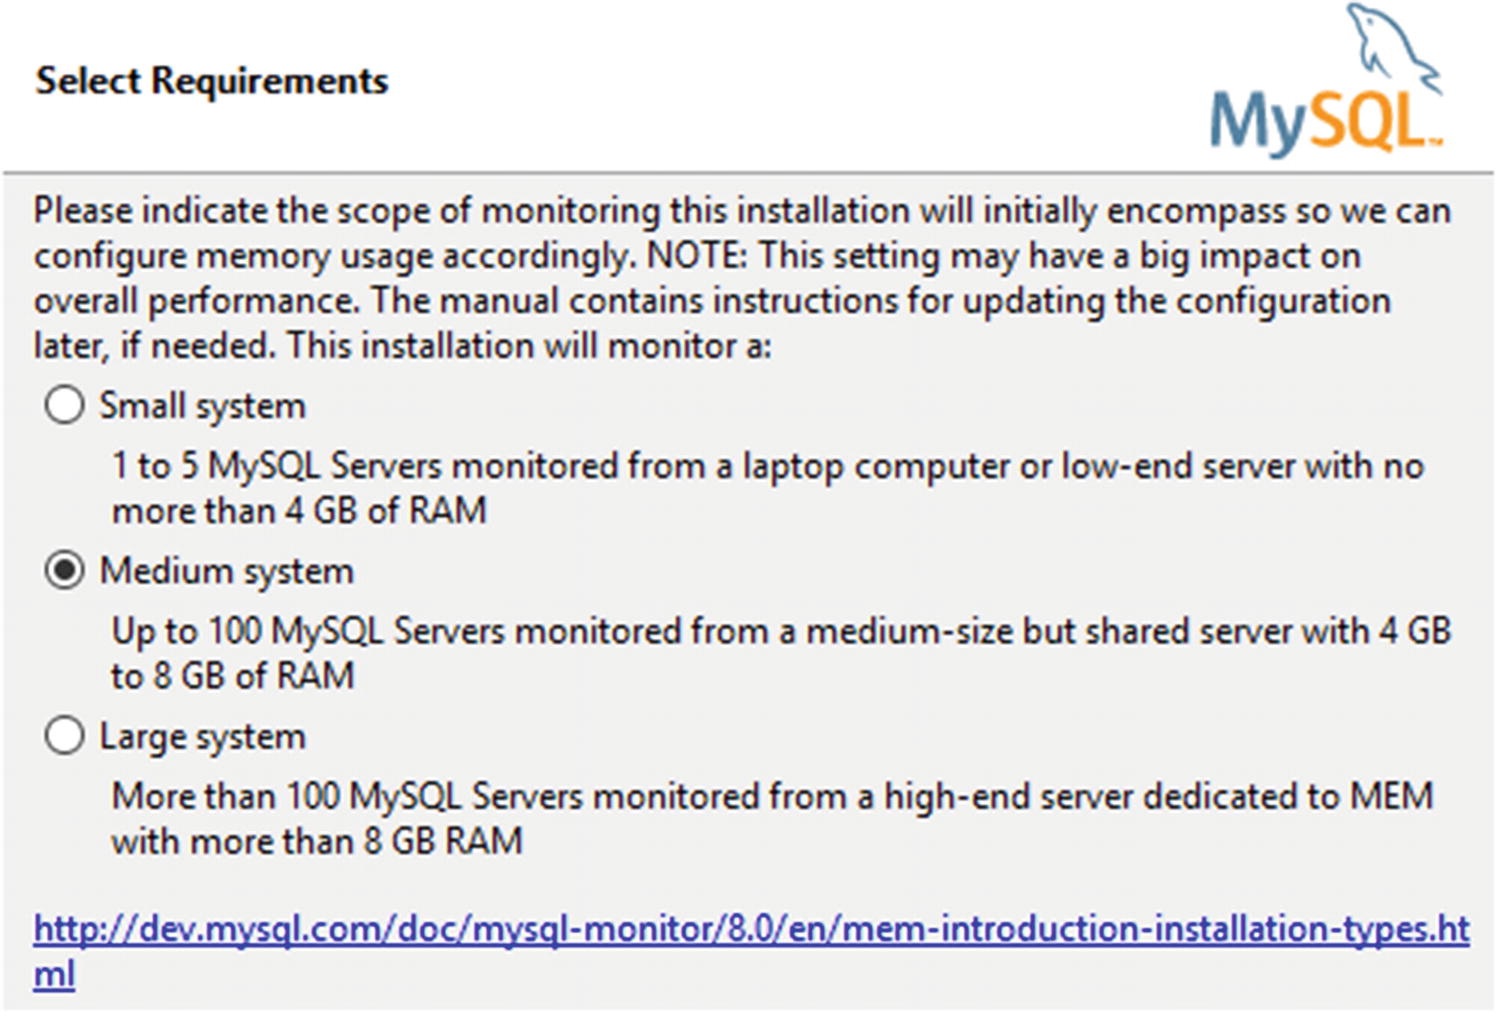
Choosing the size of the system
The system size determines the default settings for things like the memory configuration of the Service Manager. You can tune the memory settings manually after the installation has completed, but choosing the correct system size means you do not have to worry about these settings initially. Unless you just want to try MySQL Enterprise Monitor with a few instances, choose the medium or large system.
Next, you need to specify the port numbers to use. MySQL Enterprise Monitor uses Tomcat server for the front end with port 18080 as the default unencrypted port and 18443 as the default SSL port. You will always be using the SSL port. (The non-SSL port is there for legacy reasons but cannot be used for the front end.)
At this point, if you are installing on Linux using the root account, you will be asked which user account you want to run the Tomcat processes under (the MySQL Server repository process will use the mysql user). The default is mysqlmem . If you are installing on Linux with a non-root account, you will be notified that it is not possible for the installer to set up auto-start.
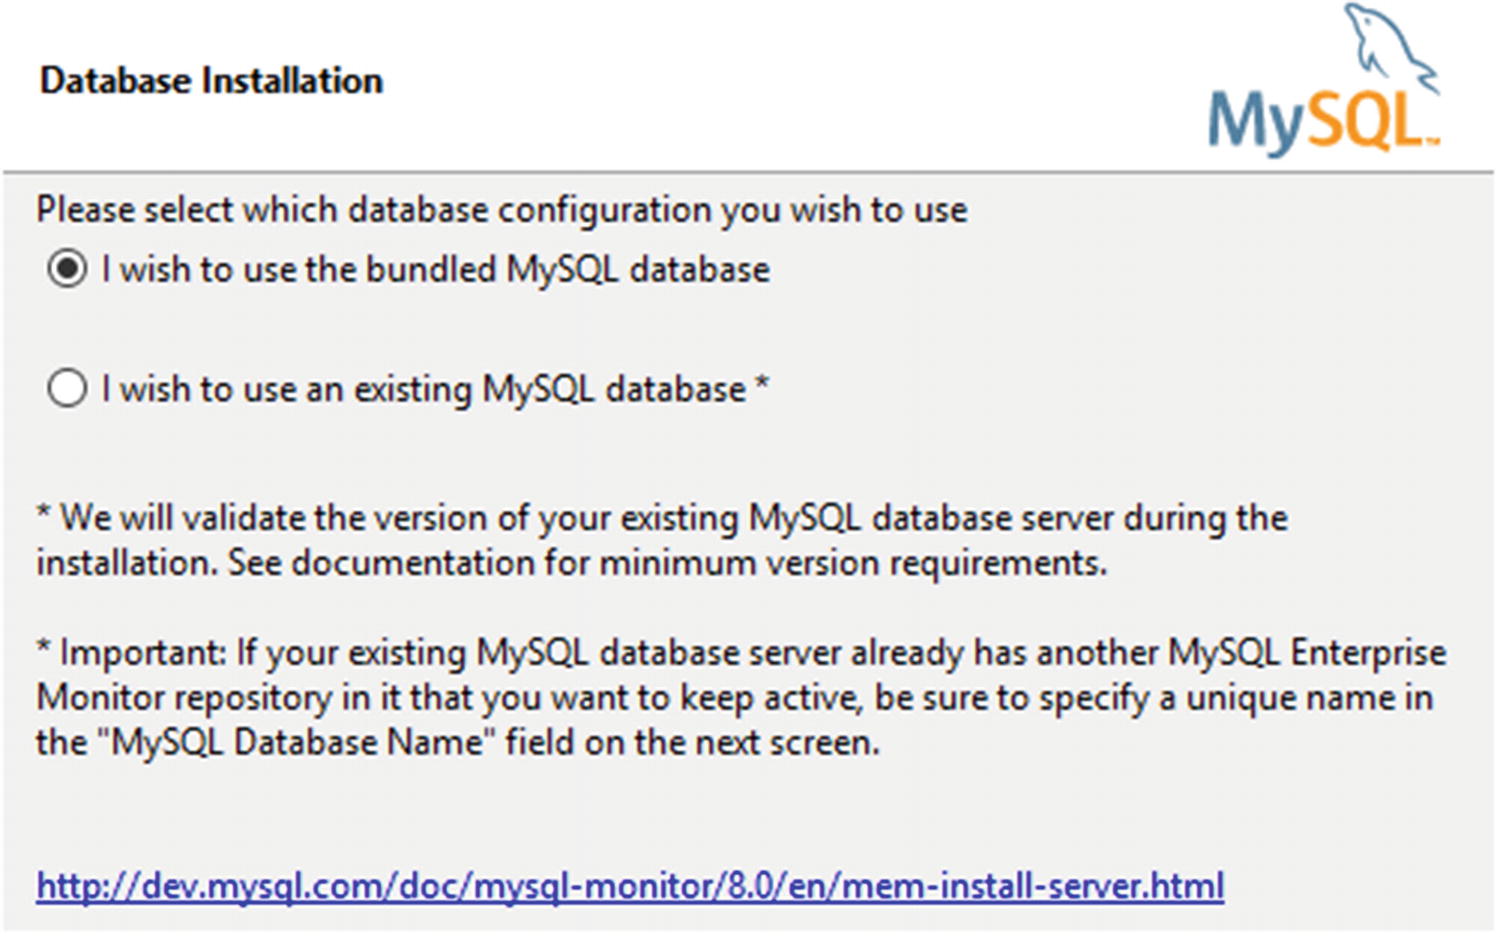
Choose which MySQL instance to use
Unless you have very good reasons to choose otherwise, it is recommended to use the bundled MySQL database. This not only allows the installer to use a base configuration that is known to work well with the Service Manager, it also simplifies upgrades.
Do not be tempted to use the MySQL instance you want to monitor as the repository for the Service Manager. MySQL Enterprise Monitor does cause a significant amount of database activity, and if you use your production database, your monitoring will stop working if the database it is supposed to monitor shuts down.
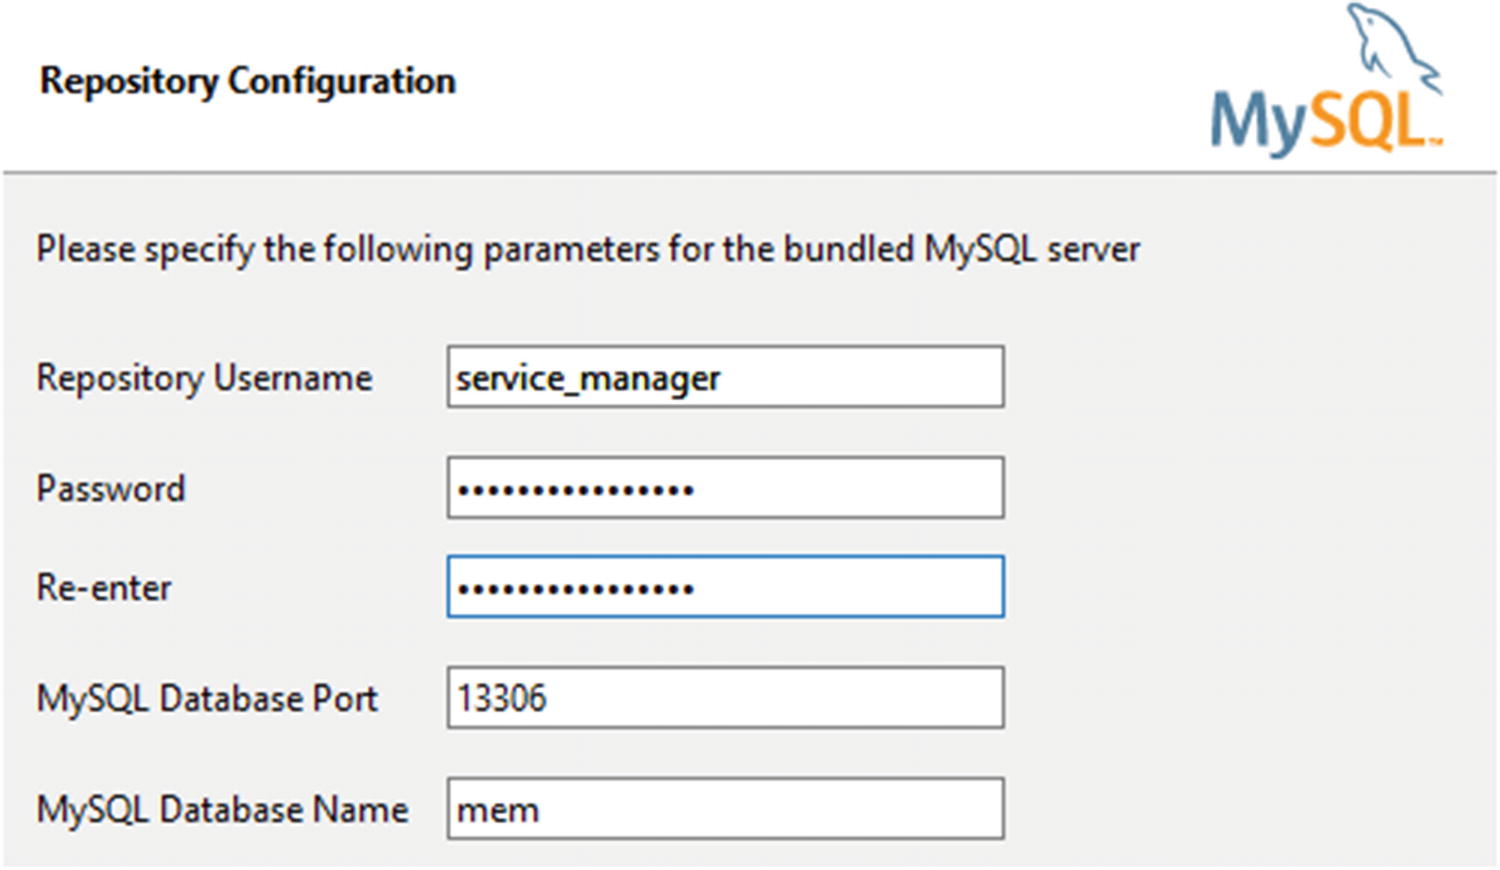
Choosing the settings for the bundled MySQL Server
Do not take the choice of password lightly. The monitoring will include many details about your system including the hostnames and queries. This means it is important to choose a strong password.
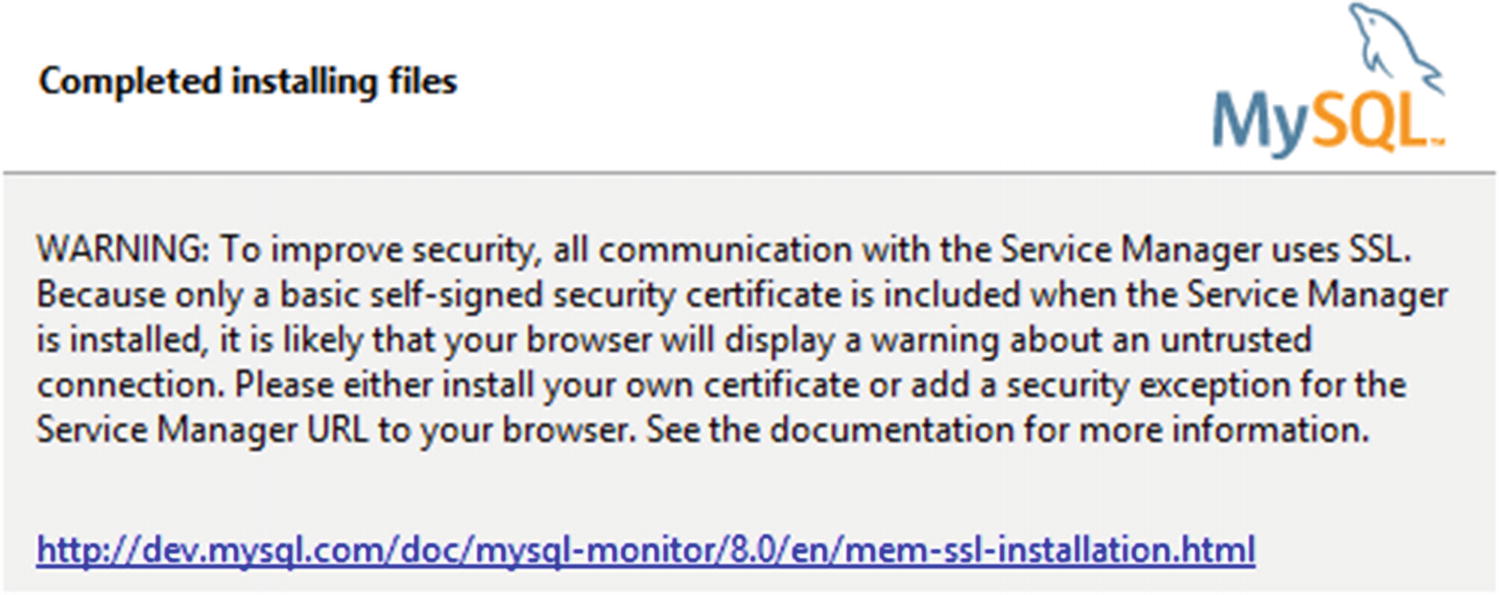
Warning about the self-signed certificates used by default
The installer creates a self-signed certificate for the SSL connections. This will encrypt the communication just fine, but it does not allow for validating that you are connected to the correct server. You can choose to purchase a certificate signed by a trusted provider and make MySQL Enterprise Monitor use that. If you continue to use the default self-signed certificate (which is assumed here), the browser will complain the first time you connect to the Service Manager that you cannot trust the connection (this is harmless in this case).
That completes the installation. The final screen shows a confirmation that you have completed the wizard, and you can choose to open the readme file and launch the browser. The installer has started the Service Manager in the background, so you do not need to do anything else than open the URL to the Service Manager in the browser. If your browser is on the same host as where you installed the Service Manager and you chose the default SSL port (18443), the URL is https://localhost:18443/.
It can take a little while for Tomcat to be ready to respond to the connections which can make the first connection attempt take a while to complete.
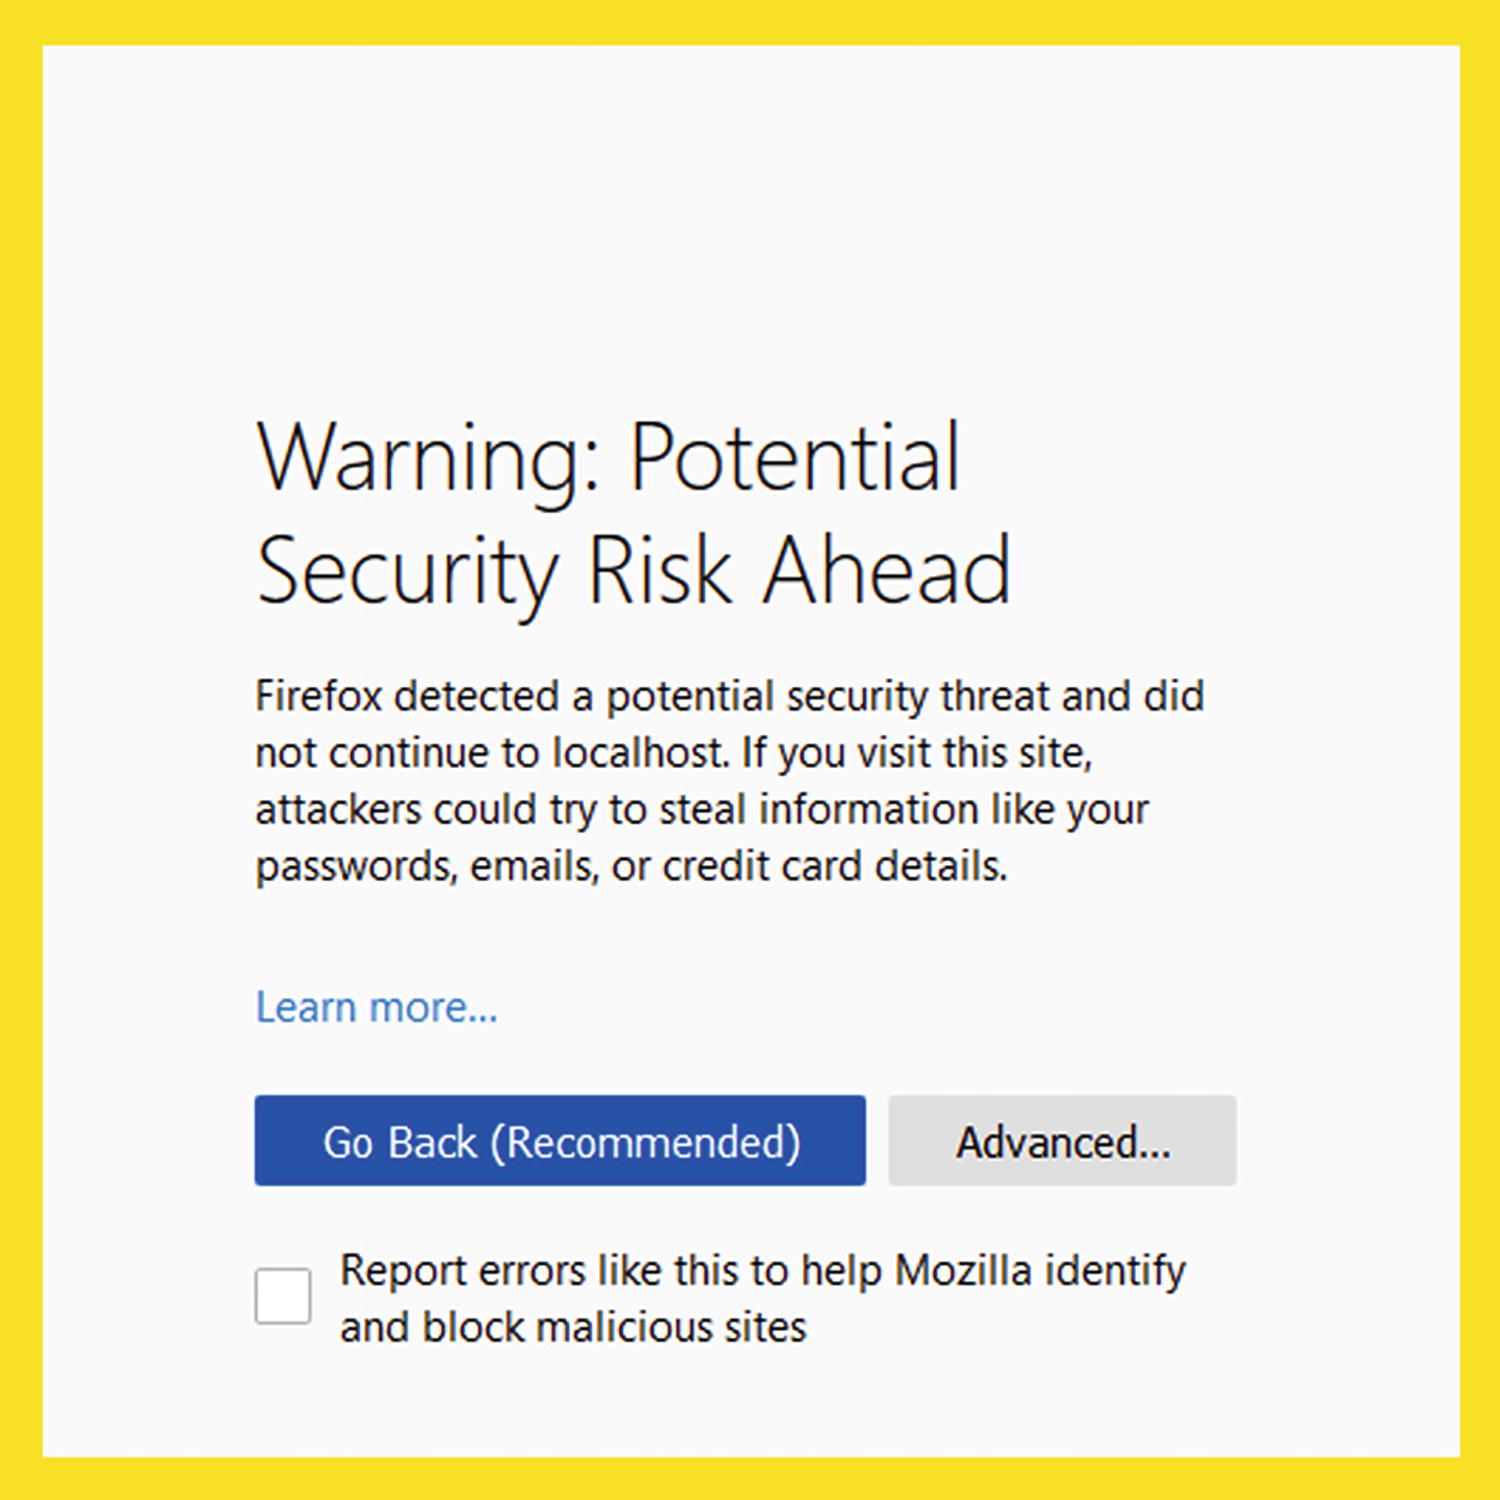
The warning by Firefox that the site cannot be verified
You will need to accept this risk. How to do this depends on your browser and version. In the case of Firefox 68, you go to the Advanced option and choose Accept the Risk and Continue.
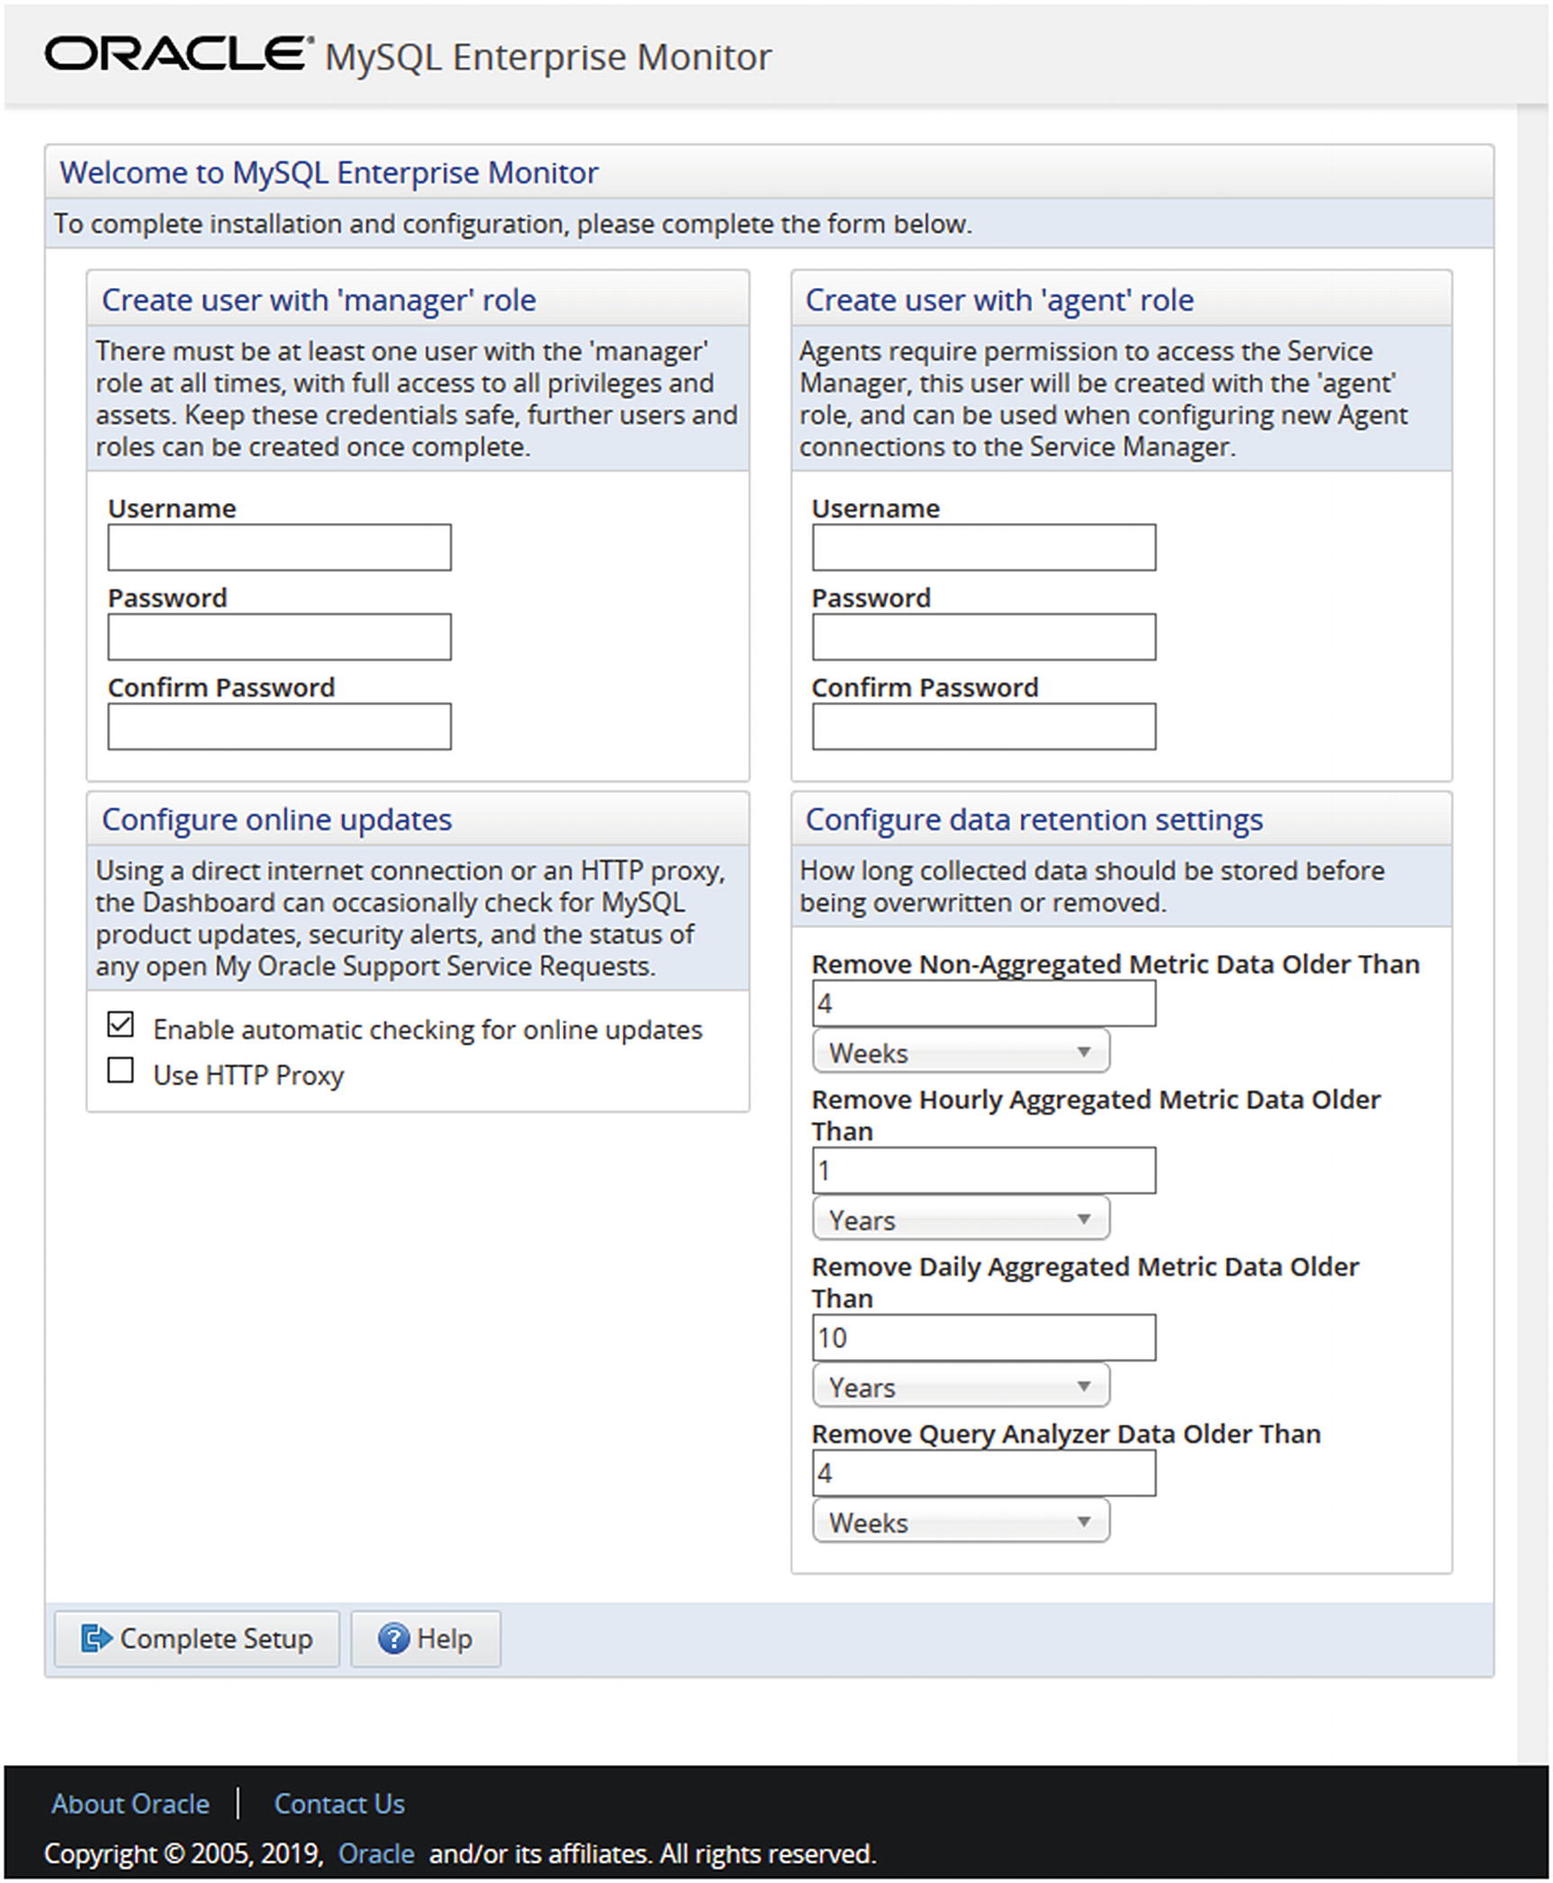
The Service Manager configuration screen
The top part requires you to configure two users. The user with the manager role is the administration user that you use to log in to the Service Manager through the browser (you can later create more users with less privileges if required). The user with the Agent role is the user that you use if you install Agents to monitor MySQL instances on other hosts. Make sure you choose strong passwords for both users.
The lower left allows you to configure whether MySQL Enterprise Monitor should check for upgrades automatically and, if so, whether proxy settings are required. To the lower right, you can configure how long data should be kept. The longer you keep data, the further you can go back in time to investigate issues, and the more details you keep. The cost is that the size of the database increases.
Once you have completed the setup, you will be taken to a What’s New page, and you can set the time zone and locale you want to use for the newly created administration user.
If you want to uninstall the Service Manager again, then you can do so using the uninstaller program. On Microsoft Windows, you do this through the Programs application in the Control Panel. On other platforms, use the uninstall command in the topmost installation directory.
Since it is likely you will need to start and stop the Service Manager during you testing, the next section will show how to do that.
Starting and Stopping the Service Manager
The Service Manager is designed to be started and stopped as a service. On Microsoft Windows and when you install the Service Manager using the root account on Linux, the installer will always install the services for you. If you install it as a non-root user on Linux, you can execute the service script manually to start and stop the Service Manager.
If you manually start the processes, start the MySQL repository service first and then Tomcat. When stopping it, it is the other way around, first stop Tomcat and then the MySQL repository service.
Microsoft Windows
On Microsoft Windows, the installer always requires the administrator privilege to run, which means it can also install the Service Manager processes as services. By default, the services are set to automatically start and stop when you boot and shut down the computer.
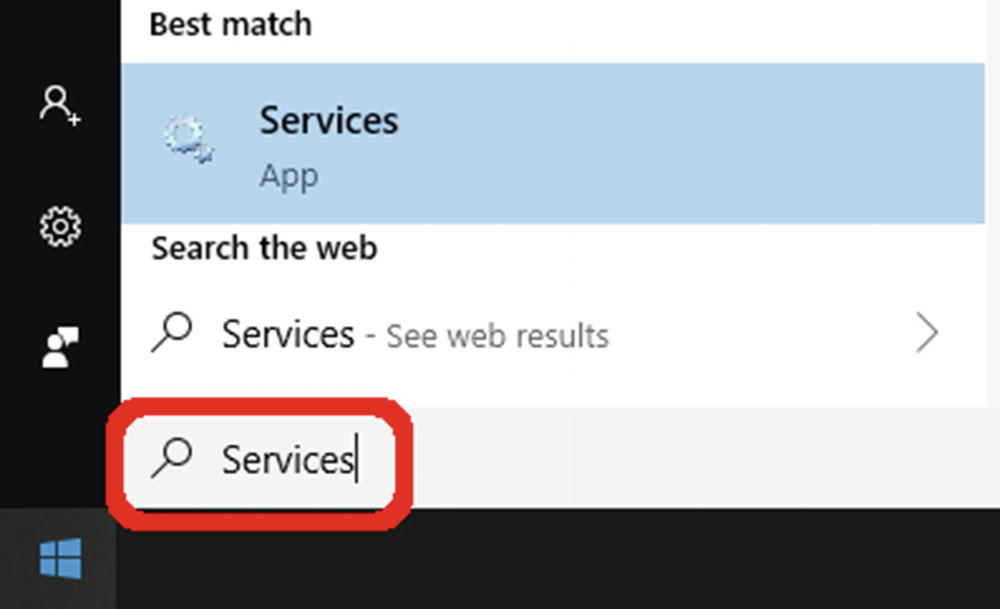
Opening the Services application
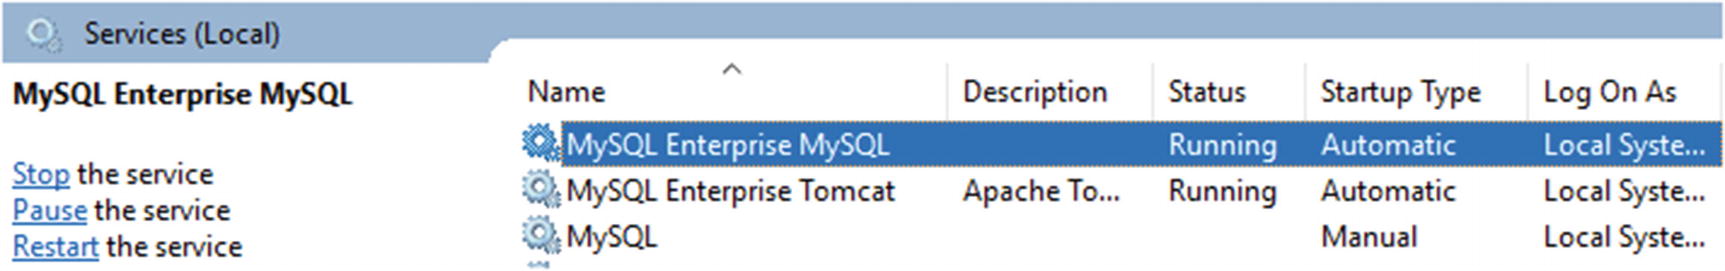
Controlling the services
When you click a service, you get the basic control actions in the pane to the left of the services list. You can also right-click the service to get the actions as well as the option to edit the properties of the service. These properties include whether to automatically start and stop the service.
Linux
How you start and stop MySQL Enterprise Monitor on Linux depends on whether you performed the installation using the root operating system user. If you used the root user, you start and stop the processes using the service command (there is no native support for systemd) with the mysql-monitor-server service; otherwise, you use the mysqlmonitorctl.sh script that is to the base of the installation directory. Either way, you can add the tomcat or mysql argument to just change the status of one of the processes.
Changing the status of the services with the service command
First, both services are started and then restarted, and finally the services are stopped one by one. It is not necessary to stop the services one by one, but it can be useful, for example, if you need to do maintenance on the repository.
Changing the status of the services with mysqlmonitorctl.sh
The steps are very similar to the previous example with the service command. In fact, the script invoked by the service command is the same as the mysqlmonitorctl.sh script except that the paths and usernames in it depend on the operating user used to install the Service Manager and the installation path.
Adding MySQL Instances
If you just want to play around with MySQL Enterprise Monitor, you do not need to do any more than you already have. The built-in Agent of the Service Manager will automatically monitor the repository instance, so already when you log in to the user interface the first time, there is monitoring data available. If you have installed an Agent, the Agent will also register the instance it is monitoring automatically. The last option, which will be discussed in this section, is to add an instance from the user interface.
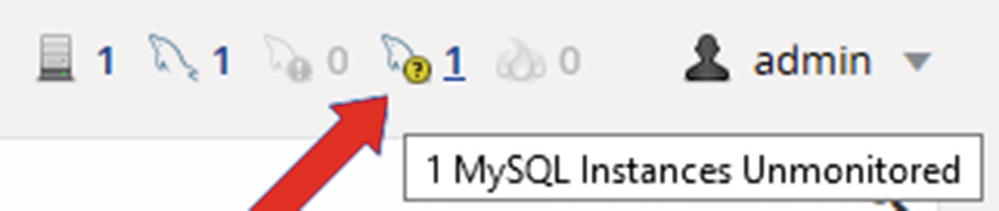
One instance is shown as unmonitored
Notice how it says 1 to the right of the dolphin with a question mark in a (yellow) circle. This is the number of MySQL instances that have been found but are not monitored. When you hover over the icon, a tooltip with the number of unmonitored instances will be displayed. If you click the dolphin or the number, it will take you to the MySQL instance configuration screen which you can also access through the menu in the left-hand pane.
Instances added through the user interface will be monitored by an existing Agent (the built-in Agent if you did not install any Agents yourself). Only those systems with the Agent installed will have their operating system monitored.
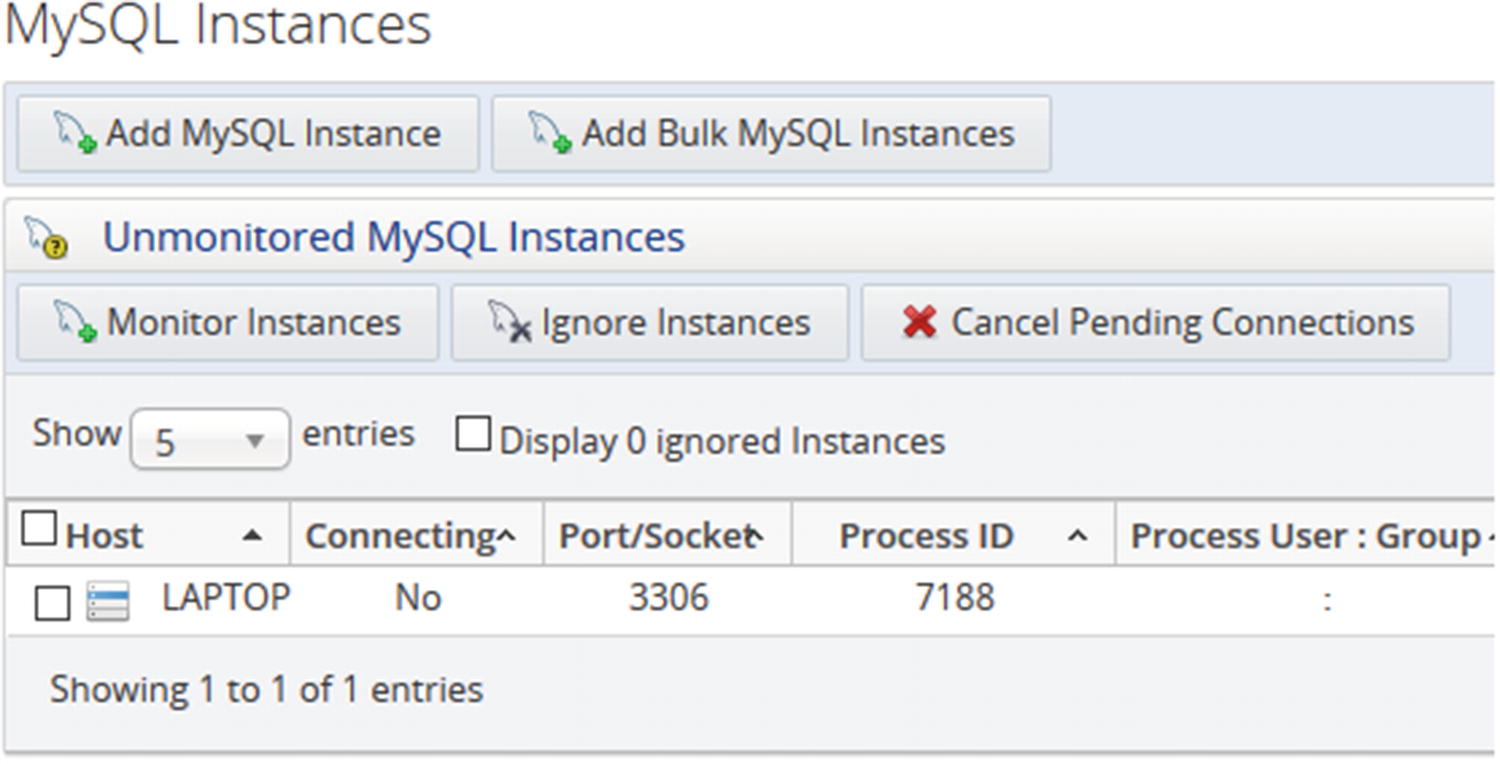
The instance configuration page
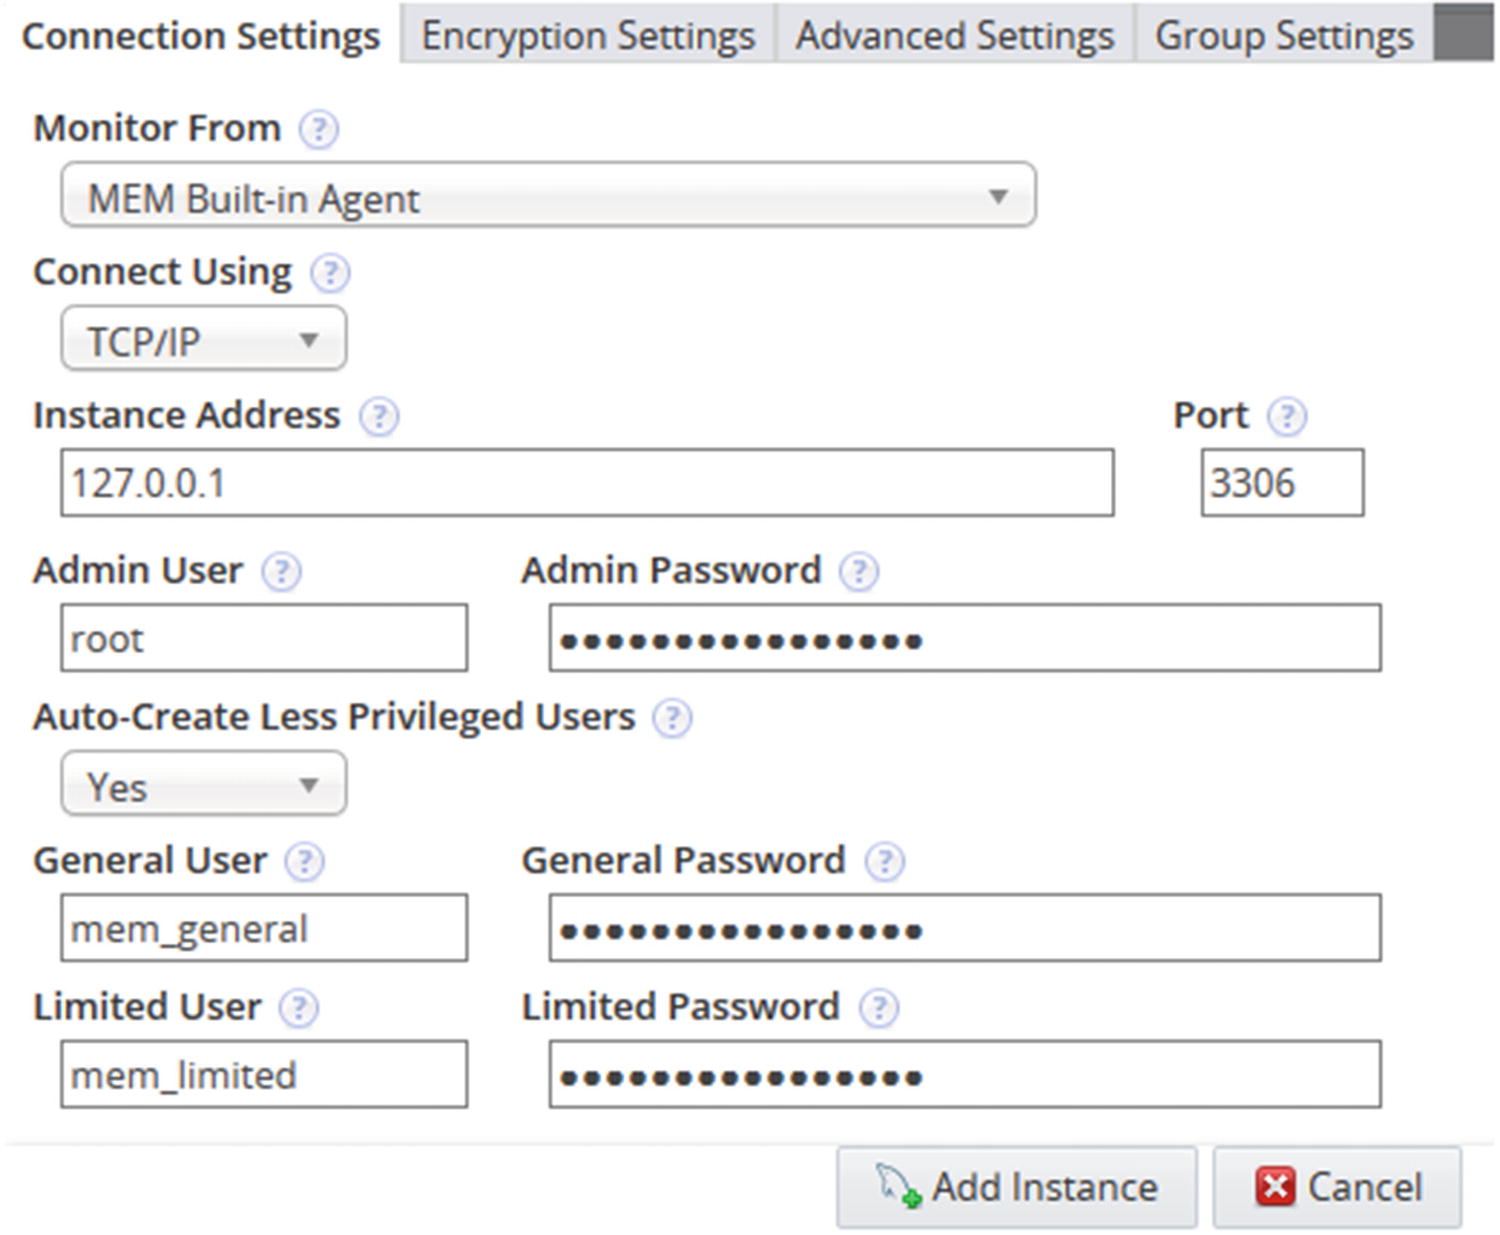
The Connection Settings tab of the add instance form
The main thing to note about the connection settings is that you can choose to have MySQL Enterprise Monitor auto-create users with fewer privileges than the administration user that is used to set up the monitoring. It is recommended to allow these users to be created as it allows the Agent to use a user with as few privileges as possible for the task it performs.
If you have encryption requirements, you can edit those in the Encryption Settings tab. The Advanced Settings tab is rarely needed. If you are setting up monitoring of several instances, you may want to specify a group for the instance in the Group Settings tab. These settings can also be changed after the instance has been added.
It will take a little time to add the instance. When it is ready, you can start exploring the rest of the user interface.
The Graphical User Interface
The user interface provided by the Service Manager’s Tomcat server is where you will spend most of the time using MySQL Enterprise Monitor. As you have already seen, it can be used to add new instances. This section will dive further into the user interface and discuss general navigation, advisors, timeseries graphs, and the Query Analyzer.
General Navigation
The MySQL Enterprise Monitor user interface divides the features into logical groups with support for filtering by the group, host, Agent, or instance. This section will give a brief tour of the interface with the aim that when graphs or reports are mentioned later in the book, you can find them in the interface, if you want to explore it closer.
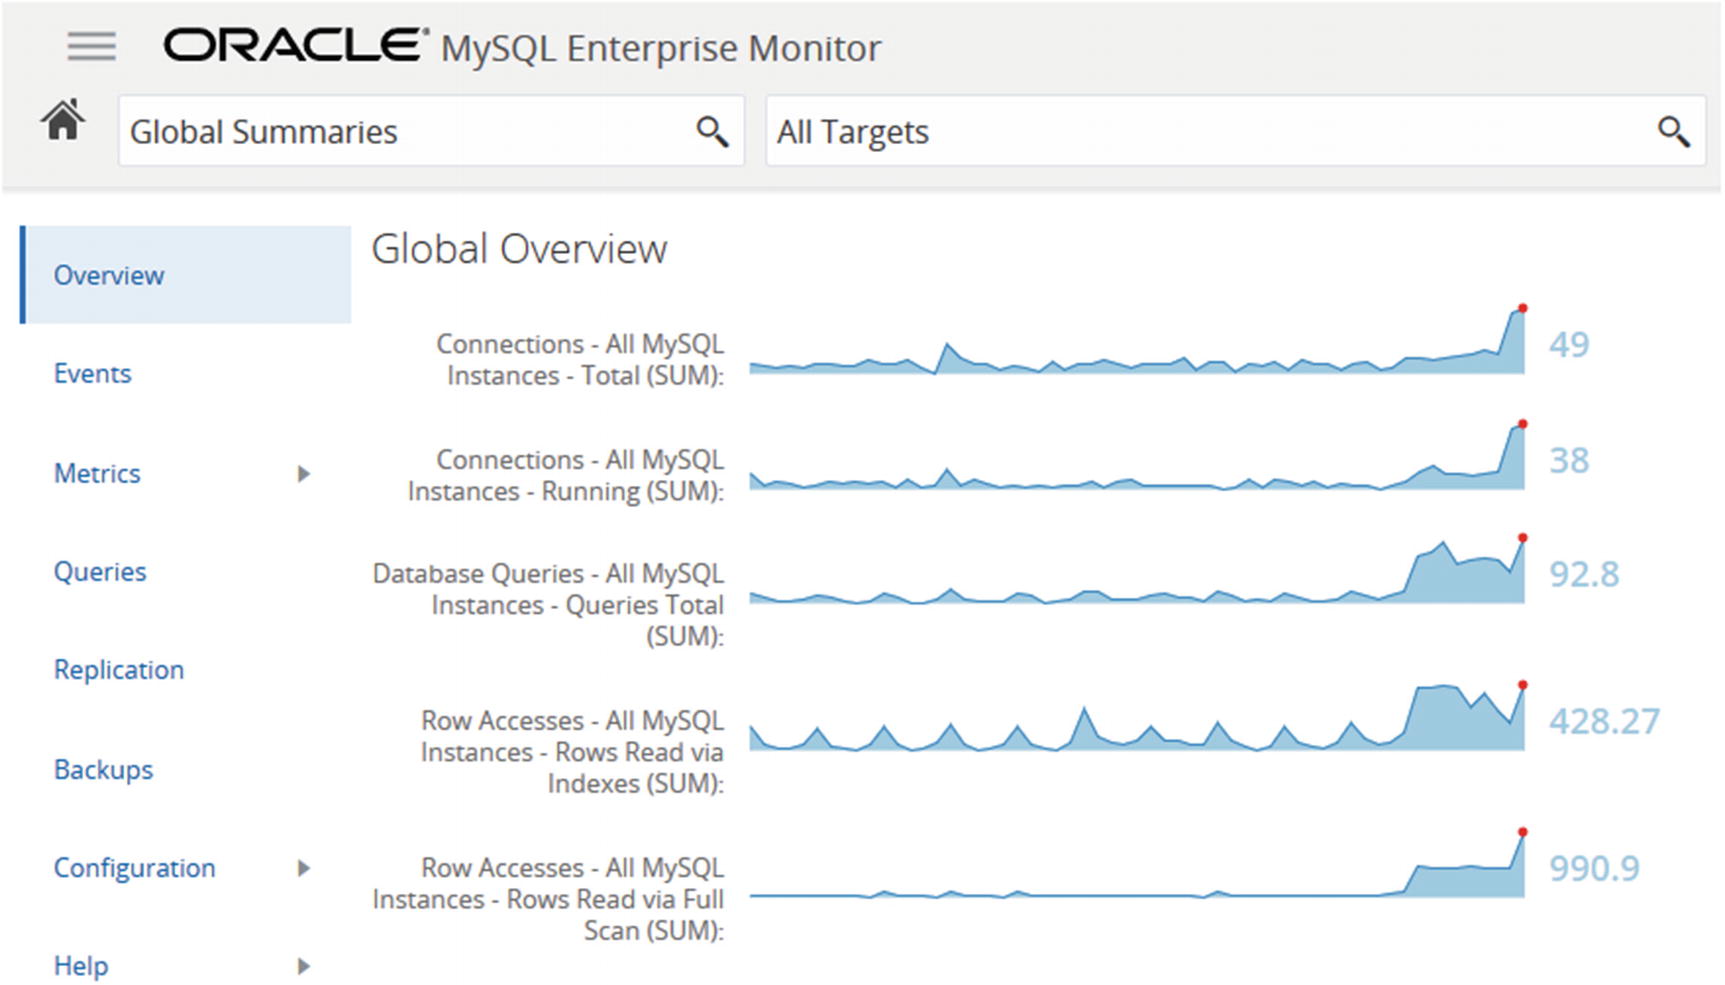
The top left of the page in MySQL Enterprise Monitor
The navigation to the features is centered on the left-hand pane with the filters applied in the two search fields at the top of the page. The search field with the label Global Summaries in the screenshot allows you to choose a group of instances. Groups can be created manually but are also created automatically for instances that are replicating between each other. Global Summaries is a special group that includes all instances. The right-hand search field allows you to limit the instances, Agents, or hosts included from the group.
Overview: This is a high-level dashboard.
Topology: This option is only available when a replication group has been chosen. It takes you to a diagram showing the topology of the group with the status of the replication for each instance.
Events: Returns a report of the monitoring events for the instances. The events are raised when some condition set by the advisors (more shortly) is met. The events have different severities ranging from a notice to an emergency.
Metrics: This takes you to the reports displaying metrics collected by the Agents. No matter the filter, the timeseries graphs are always available (but which graphs depends on the filter). For individual instances, there are also reports for table statistics, user statistics, memory usage, database file I/O, the InnoDB buffer pool, processes, and lock waits. Several of these reports will be used in later chapters.
Queries: This is the MySQL Query Analyzer which allows you to investigate which queries are executed on the instance. The timeseries graphs are linked to the Query Analyzer, so you can go from examining the graphs to seeing which queries were executing during the period being investigated.
Replication: The replication dashboard and other replication-related reports.
Backups: Information about backups created by MySQL Enterprise Backup (MEB).
Configuration: Configuration of the various aspects of MySQL Enterprise Monitor including instances and advisors.
Help: The documentation including What’s New that you have already seen and access to download a diagnostic report that can be used to troubleshoot problems. The diagnostic report is mostly used if you have a MySQL support contract and need to provide diagnostics in a support ticket.
One term that is necessary to explain further is advisors.
Advisors
Advisor is the name MySQL Enterprise Monitor uses for the rules that define how often data is collected, which conditions trigger events, and which severity the event is. This is an important concept that you should take some time to understand and configure.
One of the most important steps to get a useful monitoring solution is to ensure you get the right events (alerts) at the right time but avoid unnecessary events. This includes ensuring that each alert is set to the appropriate severity. You may at first think that the more events the better, so that you know everything that goes on. However, that is not how you best use a monitoring system. If you have many false positives when you examine the events or you get woken up unnecessarily at 3:00 a.m. for an issue that easily can wait until the morning, then you start ignoring events, and that is the sure recipe to miss an important event sooner or later. In short, your work with the advisors should be ongoing to keep improving them to trigger “just the right” events at “just the right” time.
An important part of the work with monitoring is to ensure the monitoring system triggers an event with a severity that matches the urgency of the issue. The goal should be never to ignore an event and that you always get alerted at a time and in a way that is appropriate for the urgency.
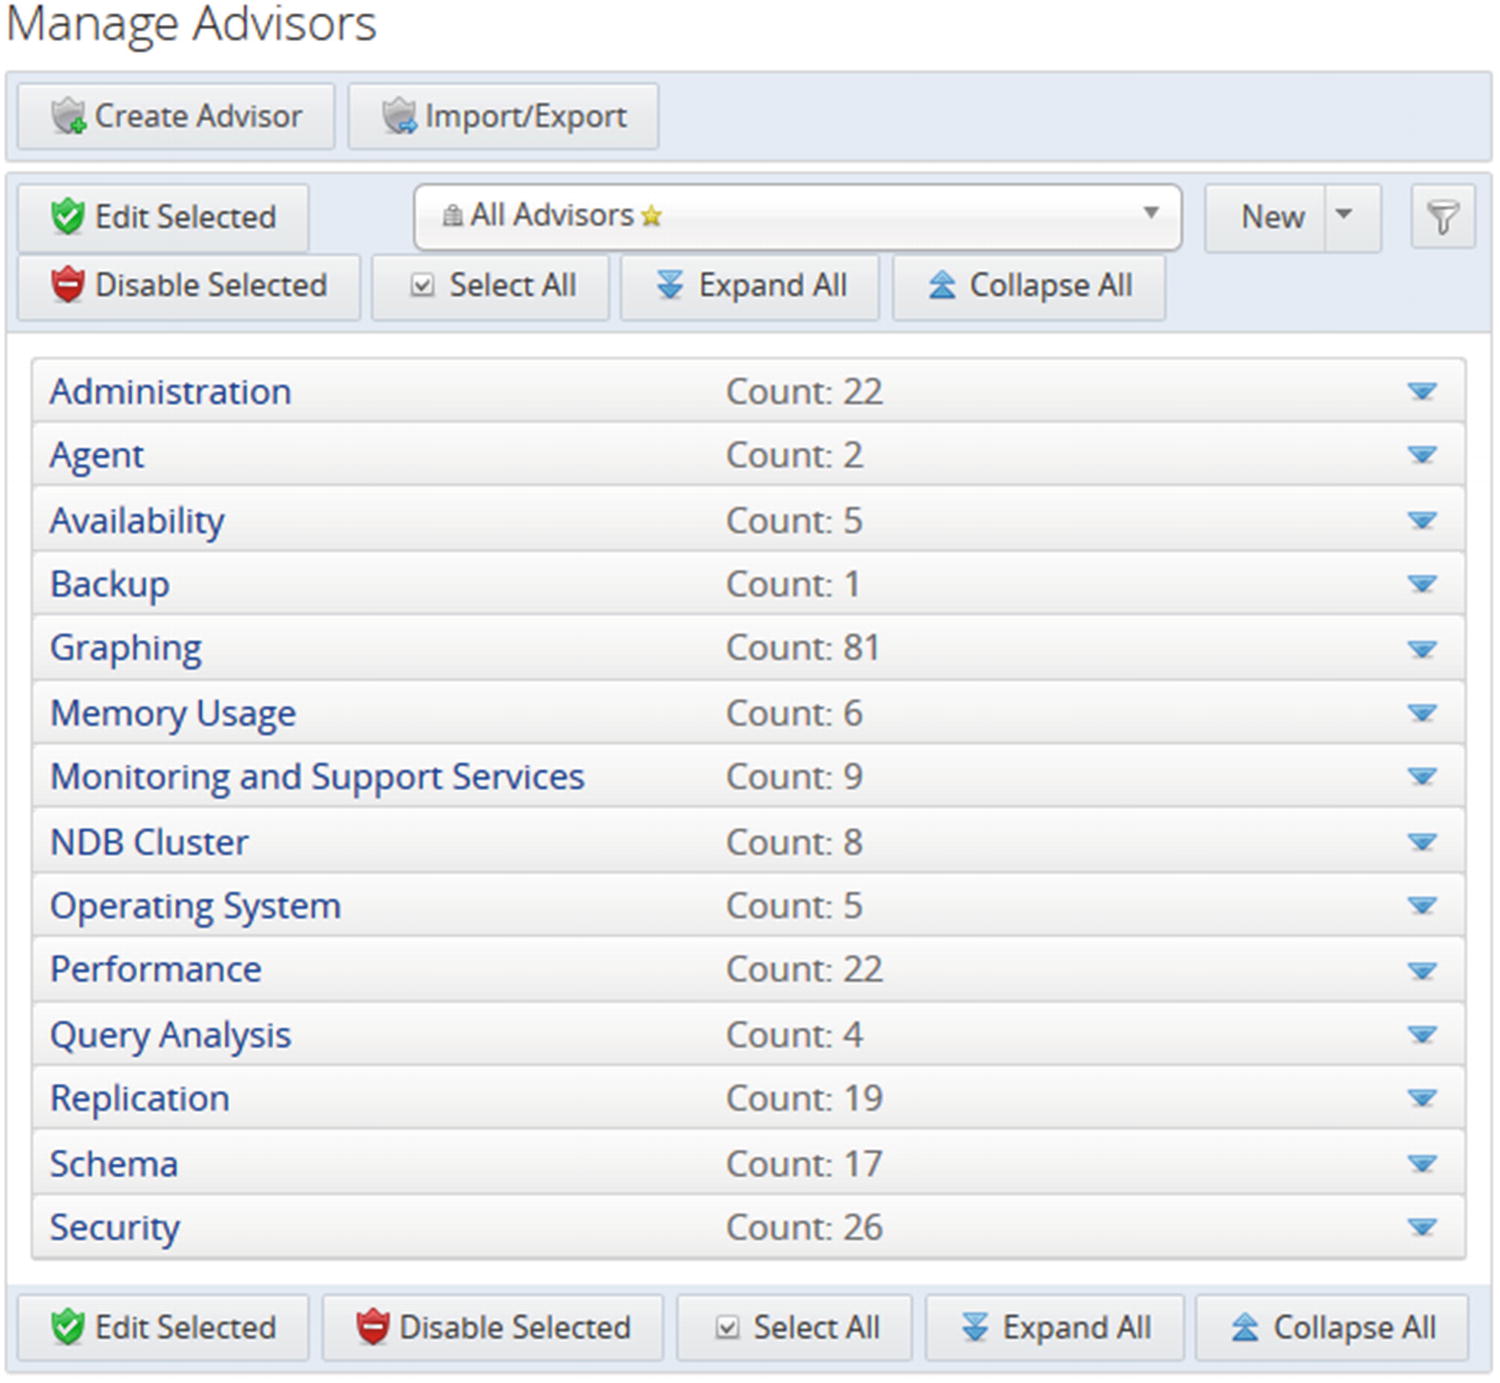
The advisors are organized into groups
Each group covers advisors of similar type, for example, there is the Performance group with 22 advisors such as Excessive Number of Locked Processes and Indexes Not Being Used Efficiently.
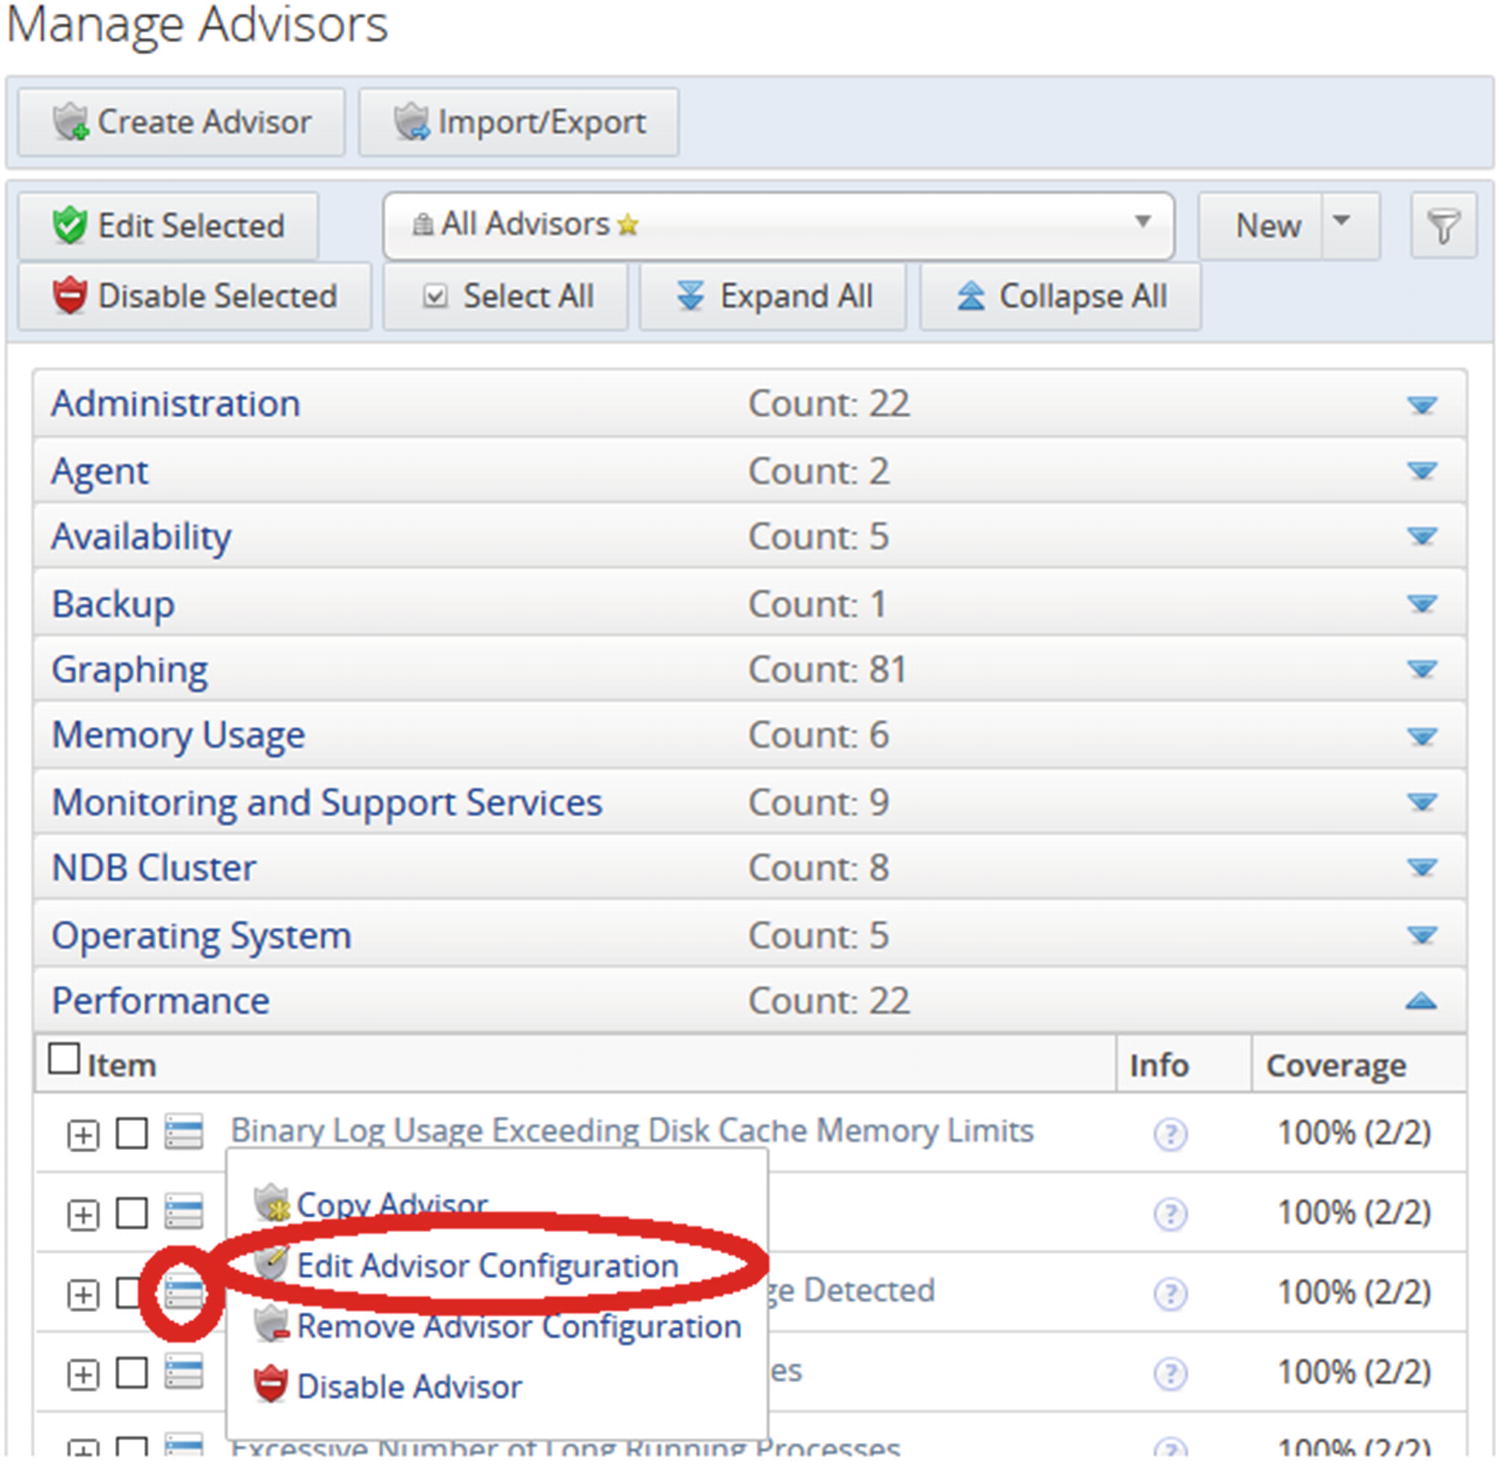
Menu to edit an advisor configuration
You can also expand the advisor using the + icon to the left of the advisor item which allows you to edit the advisor for a specific group of instances or a single instance. The ? icon in the Info column provides additional information such as the expression evaluated or the source of the data for the advisor. There is additional information available which is not shown in the figure.
Timeseries Graphs
The timeseries graphs are the graphs that show the metrics over time. This is a standard feature of all monitoring solutions. You can filter which graphs to display and change the time frame to plot as well as the plotting style.
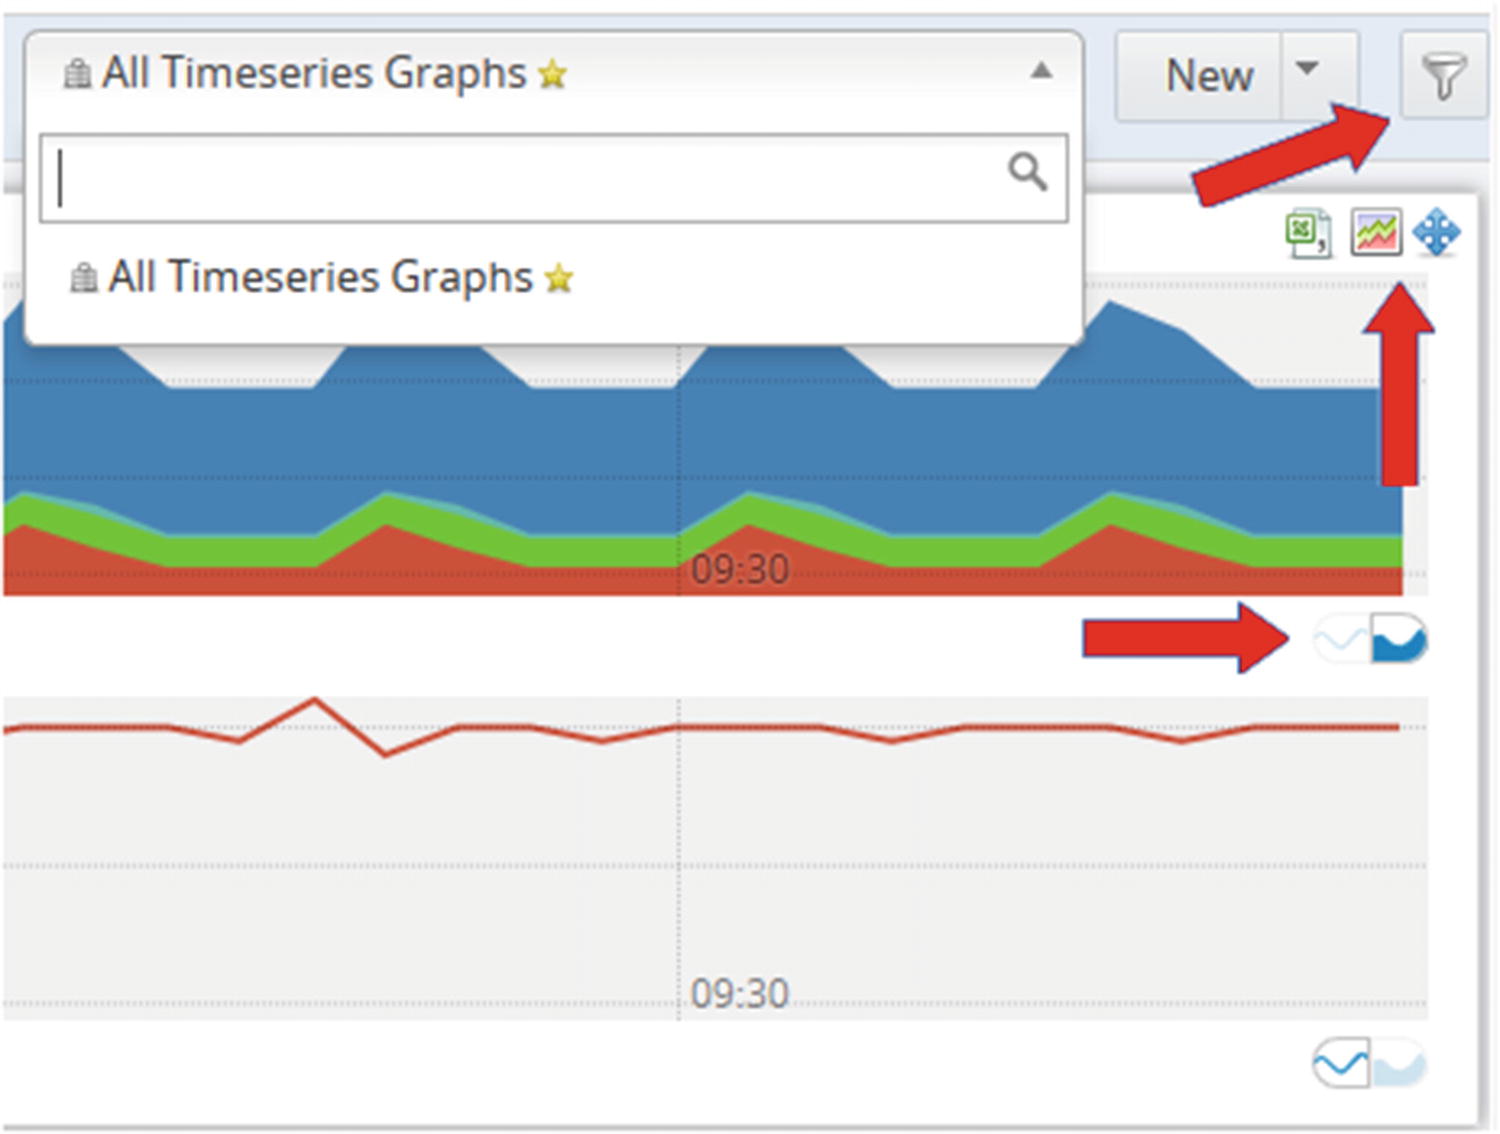
The timeseries graphs
Above the graphs are the options to choose which graphs to display and the time frame of the graphs. The search field to the left in the screenshot allows you to choose between saved timeseries groups. By default, there is a single group called All Timeseries Graphs that – as the name suggests – includes all timeseries graphs appropriate for the instance filtering in place.
You access the options for the timeseries graphs by using the funnel icon in the top-right corner of the screenshot. This will open a frame that allows you to choose which graphs to display and the time frame to cover.
The two small buttons below each graph allow you to toggle between using the line and stacked plotting modes. The screenshot shows an example of the stacked mode in the topmost graph and the line mode in the lower graph. The line mode is the default. You can also change the height of the graphs using a slider (not included in the screenshot) to the left of the field to select between saved graph groups.
The three icons above the graph become visible when you hover above the graph and allows you to export the data for the graph in CSV format, open the graph as a PNG image, or move the graph which allow you to reorder the graphs as it suits you best. In this case where there are two graphs grouped together, the controls apply to both graphs.
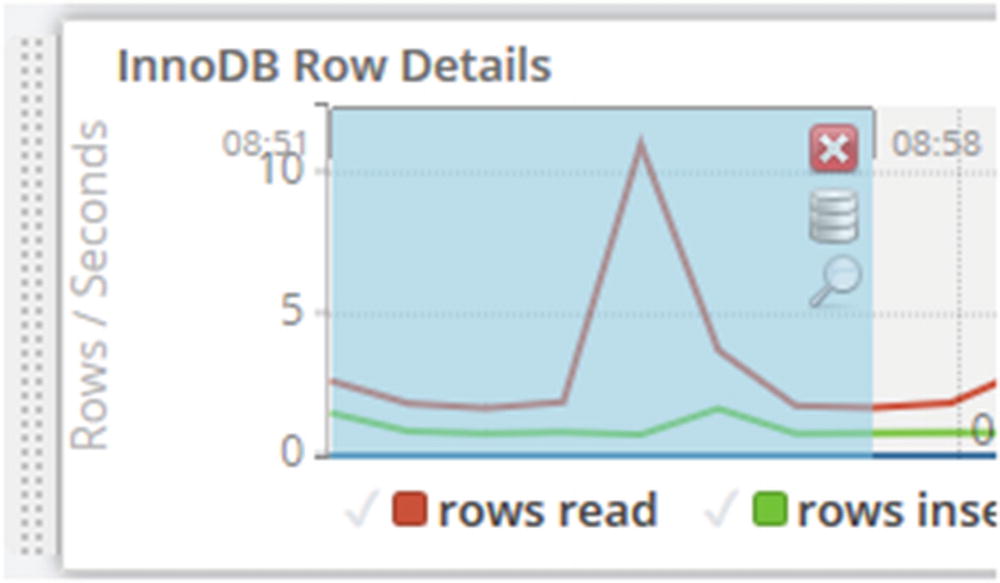
Selecting a part of a timeseries graph
Notice that in the upper-right part of the highlighted area, there are three icons to control what to do with the selection. The X in the box discards the selection, the database cylinder opens the graph for the selected time frame in the Query Analyzer, and the magnifying glass zooms the timeseries graphs to use the selected time frame.
The Query Analyzer
The Query Analyzer is a feature that makes MySQL Enterprise Monitor stand out from other monitoring solutions. It allows you to see which queries execute on the instance in a given period which is invaluable when investigating performance problems.
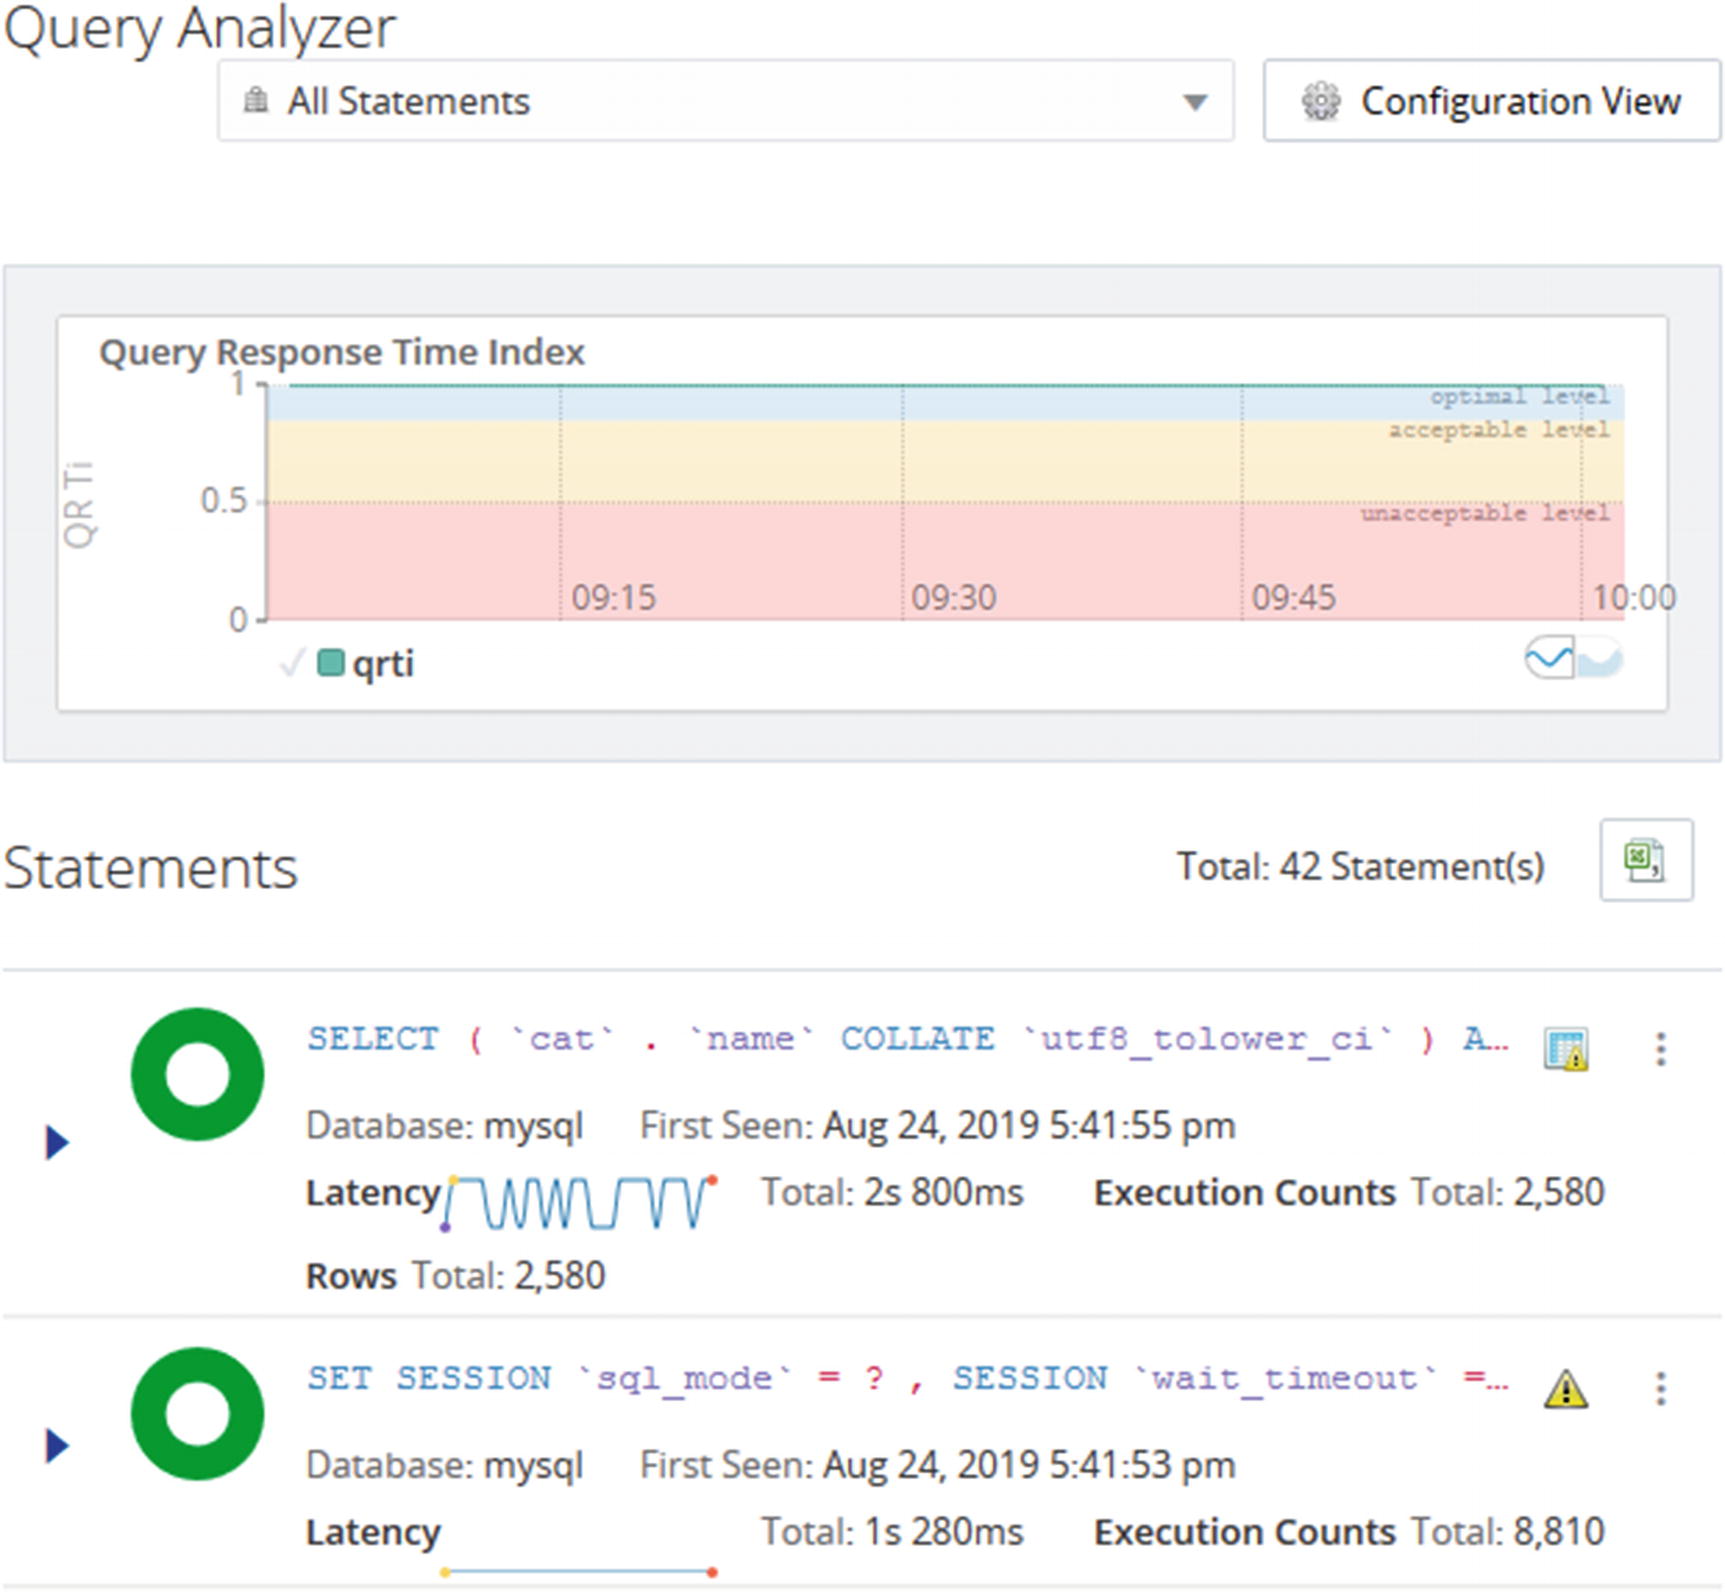
The Query Analyzer
The drop box at the top saying All Statements in the screenshot allows you to choose the statement type to show statements for. The default is to include all statements. To the right there is the Configuration View button which takes you to a page where you can configure how the Query Analyzer page should be configured. This includes the time frame to cover, which graphs to display, filtering options, and which information to include for each statement.
By default, the Query Analyzer includes the graph for the query response time index (QRTi) . The definition of the query response time index and how to use it will be covered in Chapter 19 when the Query Analyzer is used to find candidates for optimization.
That concludes the tour of MySQL Enterprise Monitor. You are encouraged to explore the user interface further on your own.
Summary
This chapter has provided a brief introduction to MySQL Enterprise Monitor with the aim at allowing you to get it installed and monitor a MySQL instance. First, an overview of the architecture and principles was discussed. MySQL Enterprise Monitor consists of a Service Manager where the data is aggregated, and you can access the monitoring system through the user interface. The monitoring of the hosts and instances is done by the Agent. There is a built-in agent in the Service Manager, and you can install additional agents on the hosts of your MySQL instances.
The overview was followed by download and installation instructions. Since MySQL Enterprise Monitor is a commercial-only product, you download it either from Oracle Software Delivery Cloud or My Oracle Support. The installation is done using an installer. This chapter showed how to use the graphical user interface of the installer for the Service Manager.
Starting and stopping the Service Manager is based on having it installed as a service. On Linux and Unix, you can also have the Service Manager installed as a non-root user in which case the same script that the service command uses can be invoked directly from the installation directory.
There are two main ways to add an instance to be monitored. If you install an agent to monitor the instance, the agent will register the instance. You can also add an instance from the user interface of the Service Manager.
Finally, there was a quick tour of the graphical user interface of the Service Manager. The focus was on the filtering of the instances you see data for and the list of features, the timeseries graphs, and the Query Analyzer. Several of these features will be used to demonstrate monitoring in the remainder of the book.
The next chapter will look at another useful tool that is used in the later chapters: MySQL Workbench.