
Together with the optimizer that was discussed in the previous chapter, locks are possibly the most complex topic of query optimization. When locks show their worst side, they can cause gray hairs for even the best expert on locks. However, do not despair. This chapter will introduce you to most of the knowledge of locks you will need – and possibly some more. After you have read this chapter, you should be able to start investigating locks and use that to gain further knowledge.
The chapter starts out discussing why locks are needed and the lock access levels. The largest section of the chapter then goes through the most commonly encountered locks in MySQL. The other half of the chapter discusses why lock requests may fail, how to reduce the impact of locks, and how to monitor locks.
Most of the examples include the statements to reproduce the important parts of the outputs (some data will by nature differ from case to case). Since the interesting parts of locking often include more than one connection, the prompts for the queries have been set to indicate which connection to use for which queries when that is important. For example, Connection 1> means that the query should be executed by the first of your connections.
Why Are Locks Needed?
It can seem like a perfect world where locking in databases is not needed. The price will however be so high that only few use cases can use that database, and it is impossible for a general-purpose database such as MySQL. If you do not have locking, you cannot have any concurrency. Imagine that only one connection is ever allowed to the database (you can argue that itself is a lock and thus the system is not lock-free anyway) – that is not very useful for most applications.
Often what is called a lock in MySQL is really a lock request which can be in a granted or pending state.
When you have several connections executing queries concurrently, you need some way to ensure that the connections do not step on each other’s toes. That is where locks enter the picture. You can think of locks in the same way as traffic signals in road traffic that regulate access to the resources to avoid accidents. In a road intersection, it is necessary to ensure that two cars do not cross each other’s path and collide. In a database, it is necessary to ensure two queries’ access to the data does not conflict.
As there are different levels of controlling the access to an intersection – yielding, stop signs, and traffic lights – there are different lock types in a database.
Lock Access Levels
The lock access level determines which kind of access a given lock allows. It is also sometimes called the lock type, but since that can be confused with the lock granularity, the term lock access level is used here.
There are essentially two access levels: shared or exclusive. The access levels do what their names suggest. A shared lock allows other connections to also get a shared lock. This is the most permissive lock access level. An exclusive lock only allows that one connection to get the lock. A shared lock is also known as a read lock, and an exclusive lock is also known as a write lock.
MySQL also has a concept called intention locks which specify the intention of a transaction. An intention lock can be either shared or exclusive. Intention locks are discussed in more detail when implicit table locks are covered in the next section that goes through the main lock granularity levels in MySQL.
Lock Granularity
MySQL uses a range of different lock granularities (also called lock types) to control access to the data. By using different lock granularities, it makes it possible, to the greatest intent possible, to allow for concurrent access to the data. This section will go through the main granularity levels used by MySQL.
User-Level Locks
User-level locks are an explicit lock type the application can use to protect, for example, a workflow. They are not often used, but they can be useful for some complex tasks where you want to serialize access. All user locks are exclusive locks and are obtained using a name which can be up to 64 characters long.
GET_LOCK(name, timeout): Obtains a lock by specifying the name of the lock. The second argument is a timeout in seconds; if the lock is not obtained within that time, the function returns 0. If the lock is obtained, the return value is 1. If the timeout is negative, the function will wait indefinitely for the lock to become available.
IS_FREE_LOCK(name): Checks whether the named lock is available or not. The function returns 1 if the lock is available and 0 if it is not available.
IS_USED_LOCK(name): This is the opposite of the IS_FREE_LOCK() function. The function returns the connection id of the connection holding the lock if the lock is in use (not available) and NULL if it is not in use (available).
RELEASE_ALL_LOCKS(): Releases all user-level locks held by the connection. The return value is the number of locks released.
RELEASE_LOCK(name): Releases the lock with the provided name. The return value is 1 if the lock is released, 0 if the lock exists but is not owned by the connection, or NULL if the lock does not exist.
A deadlock for user-level locks
When Connection 2 attempts to get the my_lock_1 lock, the statement will block until Connection 1 attempts to get the my_lock_2 lock triggering the deadlock. If you obtain multiple locks, you should be prepared to handle deadlocks. Note that for user-level locks, a deadlock does not trigger a rollback of the transaction.
Listing user-level locks
The OBJECT_TYPE for user-level locks is USER LEVEL LOCK, and the lock duration is EXPLICIT as it is up to the user or application to release the lock again. In row 1, the connection with Performance Schema thread id 76 has been granted the my_lock_1 lock, and in row 3 thread id 62 is waiting (pending) for it to be granted. Thread id 62 also has a granted lock which is included in row 2.
The next level of locks involves non-data table-level locks. The first of these that will be discussed is the flush lock.
Flush Locks
A flush lock will be familiar to most who have been involved in taking backups. It is taken when you use the FLUSH TABLES statement and last for the duration of the statement unless you add WITH READ LOCK in which case a shared (read) lock is held until the lock is explicitly released. An implicit table flush is also triggered at the end of the ANALYZE TABLE statement. The flush lock is a table-level lock. The read lock taken with FLUSH TABLES WITH READ LOCK is discussed later under explicit locks.
A common cause of lock issues for the flush lock is long-running queries. A FLUSH TABLES statement cannot flush a table as long as there is a query that has the table open. This means that if you execute a FLUSH TABLES statement while there is a long-running query using one or more of the tables being flushed, then the FLUSH TABLES statement will block all other statements needing any of those tables until the lock situation has been resolved.
Flush locks are subject to the lock_wait_timeout setting. If it takes more than lock_wait_timeout seconds to obtain the lock, MySQL will abandon the lock. The same applies if the FLUSH TABLES statement is killed. However, due to the internals of MySQL, a lower-level lock called the table definition cache (TDC) version lock cannot always be released until the long-running query completes.1 That means that the only way to be sure the lock problem is resolved is to kill the long-running query, but be aware that if the query has changed many rows, it may take a long time to roll back the query.
Example of waiting for a flush lock
The example uses the sys.session view; similar results can be obtained using performance_schema.threads and SHOW PROCESSLIST. In order to reduce the output to only include the queries of relevance for the flush lock discussion, the current thread and threads without ongoing queries are filtered out.
The connection with conn_id = 21 is executing a slow query that uses the world.city table (a SLEEP(180) was used to ensure it took a long time). In the meantime, conn_id = 22 executed a FLUSH TABLES statement for the world.city table. Because the first query still has the table open (it is released once the query completes), the FLUSH TABLES statement ends up waiting for the table flush lock. Finally, conn_id = 23 attempts to query the table and thus must wait for the FLUSH TABLES statement.
Another non-data table lock is a metadata lock.
Metadata Locks
Metadata locks are one of the newer lock types in MySQL. They were introduced in MySQL 5.5, and their purpose is to protect the schema, so it does not get changed while queries or transactions rely on the schema to be unchanged. Metadata locks work at the table level, but they should be considered as an independent lock type to table locks as they do not protect the data in the tables.
SELECT statements and DML queries take a shared metadata lock, whereas DDL statements take an exclusive lock. A connection takes a metadata lock on a table when the table is first used and keeps the lock until the end of the transaction. While the metadata lock is held, no other connection is allowed to change the schema definition of the table. However, other connections that execute SELECT statements and DML statements are not restricted. Usually the biggest gotcha with respect to metadata locks is idle transactions preventing DDL statements from starting their work.
Example of waiting for table metadata lock
In this example, the connection with conn_id = 21 has an ongoing transaction and in the previous statement queried the world.city table (the current statement in this case is the same as it is not cleared until the next statement is executed). While the transaction is still active, conn_id = 22 has executed an OPTIMIZE TABLE statement which is now waiting for the metadata lock. (Yes, OPTIMIZE TABLE does not change the schema definition, but it as a DDL statement is still affected by the metadata lock.)
Example of metadata locks
In the example, thread id 61 (the same as conn_id = 22 from the sys.session output) owns a shared read lock on the world.city table due to an ongoing transaction, and thread id 62 is waiting for a lock as it is trying to execute a DDL statement on the table.
A special case of metadata locks are locks taken explicitly with the LOCK TABLES statement.
Explicit Table Locks
Explicit table locks are taken with the LOCK TABLES and the FLUSH TABLES WITH READ LOCK statements. With the LOCK TABLES statement, it is possible to take shared or exclusive locks; FLUSH TABLES WITH READ LOCK always takes a shared lock. The tables are locked, until they are explicitly released with the UNLOCK TABLES statement. When FLUSH TABLES WITH READ LOCK is executed without listing any tables, the global read lock (i.e., affecting all tables) is taken. While these locks also protect the data, they are considered as metadata locks in MySQL.
Explicit table locks, other than FLUSH TABLES WITH READ LOCK in connection with backups, are not often used with InnoDB as InnoDB’s sophisticated lock features are in most cases superior to handling locks yourself. However, if you really need to lock the entire tables, explicit locks can be useful as they are very cheap for MySQL to check.
Since explicit locks are considered metadata locks, the symptoms and information in the performance_schema.metadata_locks table are the same as for implicit metadata locks.
Another table-level lock but handled implicitly is plainly called a table lock.
Implicit Table Locks
MySQL takes implicit table locks when a table is queried. Table locks do not play a large role for InnoDB tables except for flush, metadata, and explicit locks as InnoDB uses record locks to allow concurrent access to a table as long as the transactions do not modify the same rows (roughly speaking – as the next subsections show – there is more to it than that).
InnoDB does however work with the concept of intention locks at the table level. Since you are likely to encounter those when investigating lock issues, it is worth familiarizing yourself with them. As mentioned in the discussion of lock access levels, intention locks mark what the intention of the transaction is. If you use an explicit LOCK TABLES statement, the table will be locked directly with the access level you have requested.
A SELECT ... FOR SHARE statement takes an intention shared lock on the tables queried. The SELECT ... LOCK IN SHARE MODE syntax is a synonym.
A SELECT ... FOR UPDATE statement takes an intention exclusive lock on the tables queried.
A DML statement (not including SELECT) takes an intention exclusive lock on the modified tables. If a foreign key column is modified, an intention shared lock is taken on the parent table.
InnoDB lock compatibility
Exclusive (X) | Intention Exclusive (IX) | Shared (S) | Intention Shared (IS) | |
|---|---|---|---|---|
Exclusive (X) | ✘ | ✘ | ✘ | ✘ |
Intention Exclusive (IX) | ✘ | ✔ | ✘ | ✔ |
Shared (S) | ✘ | ✘ | ✔ | ✔ |
Intention Shared (IS) | ✘ | ✔ | ✔ | ✔ |
In the table, a checkmark indicates that the two locks are compatible, whereas a cross mark indicates the two locks are conflicting with each other. The only conflicts of intention locks are the exclusive and shared locks. An exclusive lock conflicts with all other locks including both intention lock types. A shared lock conflicts only with an exclusive lock and an intention exclusive lock.
Why are the intention locks even necessary? They allow InnoDB to resolve the lock requests in order without blocking compatible operations. The details are beyond the scope of this discussion. The important thing is that you know that the intention locks exist, so when you see them you know where they come from.
Example of an InnoDB intention shared lock
This shows an intention shared lock on the world.city table. Notice that the ENGINE is set to INNODB and that LOCK_DATA is NULL. The values of the ENGINE_LOCK_ID, ENGINE_TRANSACTION_ID, and OBJECT_INSTANCE_BEGIN columns will be different if you execute the same query.
As mentioned, InnoDB’s main access level protection is at the record level, so let’s look at those.
Record Locks
Record locks are often called row locks; however, it is more than just locks on rows as it also includes index and gap locks. These are typically the locks that are meant when talking about InnoDB locks. They are fine-grained locks that aim at just locking the least amount of data while still ensuring the data integrity.
A record lock can be shared or exclusive and affect just the rows and indexes accessed by the transaction. The duration of exclusive locks is usually the transaction with an exception, for example, being delete-marked records used for uniqueness checks in INSERT INTO ... ON DUPLICATE KEY and REPLACE statements. For shared locks, the duration can depend on the transaction isolation level as discussed in “Transaction Isolation Levels” in the section “Reduce Locking Issues.”
Example of InnoDB record locks
The first row is the intention exclusive table lock that has already been discussed. The second row is a next-key lock (more shortly) on the CountryCode index for the value (‘LUX’, 2452) where ‘LUX’ is the country code used in the WHERE clause and 2452 is the primary key id added to the nonunique secondary index. The city with ID = 2452 is the only city matching the WHERE clause, and the primary key record (the row itself) is shown in the third row of the output. The lock mode is X,REC_NOT_GAP which means it is an exclusive lock on the record but not on the gap.
What is a gap? An example is shown in the fourth row of the output. Gap locks are so important that the discussion of the gap lock is split out into its own.
Gap Locks, Next-Key Locks, and Predicate Locks
A gap lock protects the space between two records. This can be in the row through the clustered index or in a secondary index. Before the first record in an index page and after the last in the page, there are pseudo-records called the infimum record and supremum record, respectively. Gap locks are often the lock type causing the most confusion. Experience from studying lock issues is the best way to become familiar with them.
This query changes the population of all cities with CountryCode = 'LUX'. What happens if a new city is inserted between the update and the commit of the transaction? If the UPDATE and INSERT statements commit in the same order they are executed, all is as such fine. However, if you commit the changes in the opposite order, then the result is inconsistent as it would be expected the inserted row would also have been updated.
This is an exclusive gap lock on the CountryCode index for the value (‘LVA’, 2434). Since the query requested to update all rows with the CountryCode set to “LUX”, the gap lock ensures that no new rows are inserted for the “LUX” country code. The country code “LVA” is the next value in the CountryCode index, so the gap between “LUX” and “LVA” is protected with an exclusive lock. On the other hand, it is still possible to insert new cities with CountryCode = 'LVA'. In some places this is referred to as a “gap before record” which makes it easier to understand how the gap lock works.
Gap locks are taken to a much less degree when you use the READ COMMITTED transaction isolation level rather than REPEATABLE READ or SERIALIZABLE. This is discussed further in “Transaction Isolation Levels” in the section “Reduce Locking Issues.”
So to recapitulate, row 2 is the next-key lock, row 3 is the record lock on the primary key (the row), and row 4 is a gap lock between “LUX” and “LVA” (or a before-LVA gap lock).
A predicate lock is similar to a gap lock but applies to spatial indexes where an absolute ordering cannot be made and thus a gap lock does not make sense. Instead of a gap lock, for spatial indexes in the REPEATABLE READ and SERIALIZABLE transaction isolation levels, InnoDB creates a predicate lock on the minimum bounding rectangle (MBR) used for the query. This will allow consistent reads by preventing changes to the data within the minimum bounding rectangle.
One final lock type related to records that you should know is insert intention locks.
Insert Intention Locks
Remember that for table locks, InnoDB has intention locks for whether the transaction will use the table in a shared or exclusive manner. Similarly, InnoDB has insert intention locks at the record level. InnoDB uses these locks – as the name suggests – with INSERT statements to signal the intention to other transactions. As such, the lock is on a yet to be created record (so it is a gap lock) rather than on an existing record. The use of insert intention locks can help increase the concurrency that inserts can be performed at.
Example of an insert intention lock
Connection 2 has the Performance Schema thread id 62, so in Connection 3, it is possible just to query for that thread and exclude the locks taken by Connection 1. Notice that for the RECORD lock, the lock mode includes INSERT_INTENTION – the insert intention lock. In this case, the data locked is the supremum pseudo-record, but that can also be the value of the primary key depending on the situation. If you recall the next-key lock discussion, then X means a next-key lock, but this is a special case as the lock is on the supremum pseudo-record, and it is not possible to lock that, so effectively it is just a gap lock on the gap before the supremum pseudo-record.
Another lock that you need to be aware of when inserting data is the auto-increment lock.
Auto-increment Locks
When you insert data into a table that has an auto-increment counter, it is necessary to protect the counter so two transactions are guaranteed to get unique values. If you use statement-based logging to the binary log, there are further restrictions as the auto-increment value is recreated for all rows except the first when the statement is replayed.
Supported values for the innodb_autoinc_lock_mode option
Value | Mode | Description |
|---|---|---|
0 | Traditional | The locking behavior of MySQL 5.0 and earlier. The lock is held until the end of the statement, so values are assigned in repeatable and consecutive order. |
1 | Consecutive | For the INSERT statement where the number of rows is known at the start of the query, the required number of auto-increment values is assigned under a lightweight mutex, and the auto-increment lock is avoided. For statements where the number of rows is not known, the auto-increment lock is taken and held to the end of the statement. This was the default in MySQL 5.7 and earlier. |
2 | Interleaved | The auto-increment lock is never taken, and the auto-increment values for concurrent inserts may be interleaved. This mode is only safe when binary logging is disabled or binlog_format is set to ROW. It is the default value in MySQL 8. |
The higher value of innodb_autoinc_lock_mode, the less locking. The price to pay for that is increased number of gaps in the sequence of auto-increment values and for innodb_autoinc_lock_mode = 2 the possibility of interleaved values. Unless you cannot use row-based binary logging or have special needs for consecutive auto-increment values, it is recommended to use the value of 2.
That concludes the discussion of user-level, metadata, and data-level locks. There are a couple other locks related to backups that you should know of.
Backup Locks
Statements that create, rename, or remove files. This includes CREATE TABLE, CREATE TABLESPACE, RENAME TABLE, and DROP TABLE statements.
Account management statements such as CREATE USER, ALTER USER, DROP USER, and GRANT.
DDL statements that do not log their changes to the redo log. This, for example, includes adding an index.
At the time of writing, taking a backup lock and releasing it is not allowed when using the X Protocol (connecting through the port specified with mysqlx_port or the socket specified with mysqlx_socket). Attempting to do so returns an ER_PLUGGABLE_PROTOCOL_COMMAND_NOT_SUPPORTED error: ERROR: 3130: Command not supported by pluggable protocols.
Additionally , statements that conflict with the backup lock also take the backup lock. Since DDL statements sometimes consist of several steps, for example, rebuilding a table in a new file and renaming the file, the backup lock can be released between the steps to avoid blocking LOCK INSTANCE FOR BACKUP for longer than necessary.
Example of a conflict for the backup lock
In the example, the connection with thread id 49 owns the backup lock, whereas the connection with thread id 60 is waiting for it. Notice that LOCK INSTANCE FOR BACKUP holds a shared lock, whereas the DDL statement requests an intention exclusive lock.
Related to the backup lock is the log lock which has also been introduced to reduce locking during backups.
Log Locks
When you create a backup, you typically want to include information about the log positions the backup is consistent with. In MySQL 5.7 and earlier, you needed the global read lock while obtaining this information. In MySQL 8, the log lock was introduced to allow you to read information such as the executed global transaction identifiers (GTIDs), the binary log position, and the log sequence number (LSN) for InnoDB without taking a global read lock.
Example output of the log_status table
That concludes the review of the main lock types in MySQL. What happens when a query requests a lock, but it cannot be granted? Let’s consider that.
Failure to Obtain Locks
The whole idea of locks is to restrict access to objects or records to avoid conflicting operations to execute concurrently. That means that sometimes a lock cannot be granted. What happens in that case? It depends on the lock requested and the circumstances. Metadata locks (including explicitly requested table locks) operate with a timeout. InnoDB record locks both support a timeout and explicit deadlock detection.
Whether two locks are compatible with each other is very complex to determine. It becomes particularly interesting as the relationship is not symmetric, that is, a lock may be allowed in the presence of another lock, but not vice versa. For example, an insert intention lock must wait for a gap lock, but a gap lock does not have to wait for an insert intention lock. Another example (of lack of transitivity) is that a gap plus record lock must wait for a record-only lock, and an insert intention lock must wait for a gap plus record lock, but an insert intention lock does not need to wait for a record-only lock.
It is important to understand that failures to obtain locks are a fact of life when working with databases. In principle you can use very coarse-grained locks and avoid failed locks except for timeouts – this is what the MyISAM storage engine does with very poor write concurrency as a result. However, in practice to allow for high concurrency of write workloads, fine-grained locks are preferred which also introduces the possibility of deadlocks.
The conclusion is that you should always make your application prepared to retry getting a lock or fail gracefully. This applies whether it is an explicit or implicit lock.
Always be prepared to handle failures to obtain locks. Failing to get a lock is not a catastrophic error and should not normally be considered a bug. That said, as discussed in the section “Reducing Locking Issues,” there are techniques to reduce lock contention that are worth having in mind when developing an application.
The rest of this chapter will discuss the specifics of table-level timeouts, record-level timeouts, and InnoDB deadlocks.
Metadata and Backup Lock Wait Timeouts
When you request a flush, metadata, or backup lock, the attempt to get the lock will time out after lock_wait_timeout seconds. The default timeout is 31536000 seconds (365 days). You can set the lock_wait_timeout option dynamically and both at the global and session scopes, which allows you to adjust the timeout to the specific needs for a given process.
The recommended setting for the lock_wait_timeout option depends on the requirements of the application. It can be an advantage to use a small value to prevent the lock request to block other queries for a long time. This will typically require you to implement handling of a lock request failure, for example, by retrying the statement. A large value can on the other hand be useful to avoid having to retry the statement. For the FLUSH TABLES statement, also remember that it interacts with the lower-level table definition cache (TDC) version lock which may mean that abandoning the statement does not allow subsequent queries from progressing. In that case, it can be better to have a high value for lock_wait_timeout to make it clearer what the lock relationship is.
InnoDB Lock Wait Timeouts
When a query requests a record-level lock in InnoDB, it is subject to a timeout similarly to the timeout for flush, metadata, and backup locks. Since record-level lock contention is more common than table-level lock contention, and record-level locks increase the potential for deadlocks, the timeout defaults to 50 seconds. It can be set using the innodb_lock_wait_timeout option which can be set both for the global and session scopes.
Example of an InnoDB lock wait timeout
In this example, the lock wait timeout for Connection 2 is set to 3 seconds, so it is not necessary to wait the usual 50 seconds for the timeout to occur.
When the timeout occurs, the innodb_rollback_on_timeout option defines how much of the work done by the transaction is rolled back. When innodb_rollback_on_timeout is disabled (the default), only the statement that triggered the timeout is rolled back. When the option is enabled, the whole transaction is rolled back. The innodb_rollback_on_timeout option can only be configured at the global level, and it requires a restart to change the value.
It is very important that a lock wait timeout is handled as otherwise it may leave the transaction with locks that are not released. If that happens, other transactions may not be able to acquire the locks they require.
It is in general recommended to keep the timeout for InnoDB record-level locks low. Often it is best to lower the value from the default 50 seconds. The longer a query is allowed to wait for a lock, the larger the potential for other lock requests to be affected which can lead to other queries stalling as well. It also makes deadlocks more likely to occur. If you disable deadlock detection (discussed next), you should use a very small value for innodb_lock_wait_timeout such as one or two seconds as you will be using the timeout to detect deadlocks. Without deadlock detection, it is also recommended to enable the innodb_rollback_on_timeout option.
Deadlocks
Deadlocks sound like a very scary concept, but you should not let the name deter you. Just like lock wait timeout, deadlocks are a fact of life in the world of high-concurrency databases. What it really means is that there is a circular relationship between the lock requests. The only way to resolve the gridlock is to force one of the requests to abandon. In that sense, a deadlock is no different from a lock wait timeout. In fact, you can disable deadlock detection in which case, one of the locks will end up with a lock wait timeout instead.
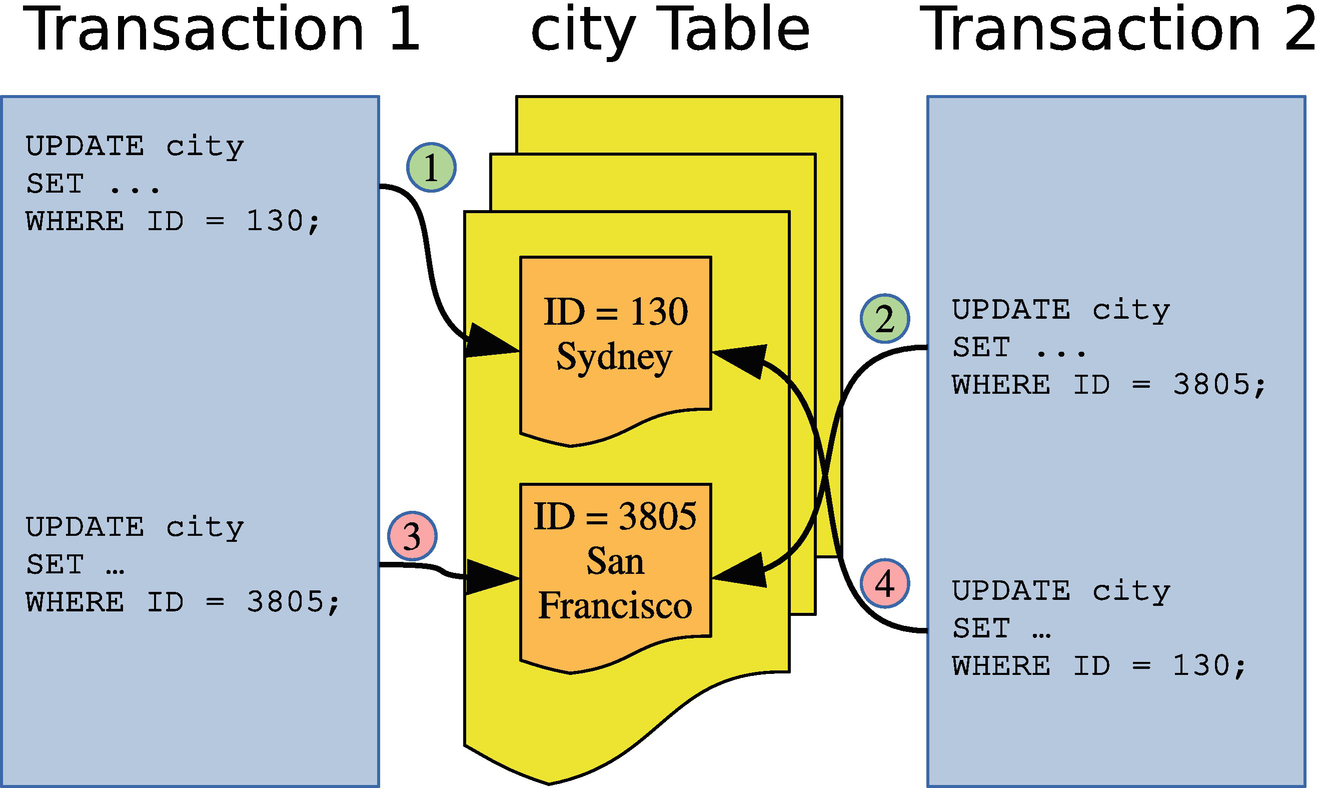
Example of two transactions causing a deadlock
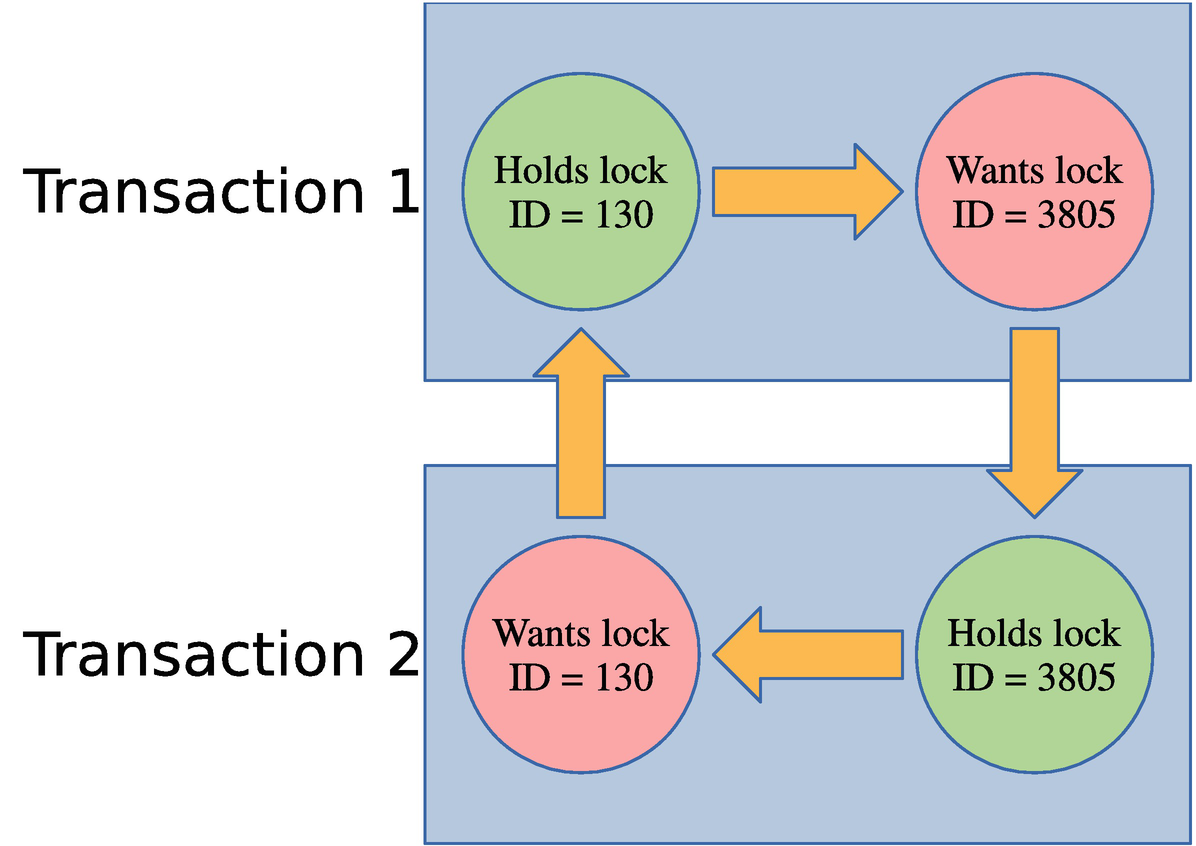
The circular relationship of the locks causing the deadlock
In this figure, it is clear which lock is held by transactions 1 and 2 and which locks are requested and how the conflict can never be resolved without intervention. That makes it qualify as a deadlock.
In the real world, deadlocks are often more complicated. In the example that has been discussed here, only primary key record locks have been involved. In general, often secondary keys, gap locks, and possible other lock types are also involved. There may also be more than two transactions involved. The principle, however, remains the same.
A deadlock may even occur with as little as one query for each of two transactions. If one query reads the records in ascending order and the other on descending order, it is possible to get a deadlock.
Example of a deadlock
In most cases, the automatic deadlock detection is great to avoid queries stalling for longer than necessary. Deadlock detection is not for free though. For MySQL instances with a very high query concurrency, the cost of looking for deadlocks can become significant, and you are better off disabling the deadlock detection which is done by setting the innodb_deadlock_detect option to OFF. That said, in MySQL 8.0.18 and later, the deadlock detection has been moved to a dedicated background thread which improves the performance.
If you do disable deadlock detection, it is recommended to set innodb_lock_wait_timeout to a very low value such as one second to quickly detect lock contention. Additionally, enable the innodb_rollback_on_timeout option to ensure the locks are released.
Now that you have an understanding of how locks work and how lock requests can fail, you need to consider how you can reduce the impact of locking.
Reduce Locking Issues
It is important to have locks in mind when you write an application and design the schema for its data and access. The strategies to reduce locking include adding indexes, changing the transaction isolation level, and preemptive locking.
Do not be carried away in optimizing locks. If you only occasionally encounter lock wait timeouts and deadlocks, it is usually better to retry the query or transaction rather than spend time avoiding the issue. How frequent is too frequent depends on your workload, but several retries every hour will not be an issue for many applications.
Transaction Size and Age
An important strategy to reduce lock issues is to keep your transactions small and to avoid delays that keep the transactions open for longer than necessary. Among the most common causes of lock issues are transactions that modify a large number of rows or that are active for much longer than necessary.
The size of the transaction is the amount of work the transaction does, particularly the number of locks it takes, but the time the transaction takes to execute is also important. As some of the other topics in this discussion will address, you can partly reduce the impact through indexes and the transaction isolation level. However, it is also important to have the overall result in mind. If you need to modify many rows, ask yourself if you can split the work into smaller batches or it is required that everything is done in the same transaction. It may also be possible to split out some preparation work and do it outside the main transaction.
The duration of the transaction is also important. One common problem is connections using autocommit = 0. This starts a new transaction every time a query (including SELECT) is executed without an active transaction, and the transaction is not completed until an explicit COMMIT or ROLLBACK is executed (or the connection is closed). Some connectors disable auto-commit by default, so you may be using this mode without realizing it which can leave transactions open for hours by mistake.
Enable the autocommit option unless you have a specific reason to disable it. When you have auto-committing enabled, InnoDB can also for many SELECT queries detect it is a read-only transaction and reduce the overhead of the query.
Another pitfall is to start a transaction and perform slow operations in the application while the transaction is active. This can be data that is sent back to the user, interactive prompts, or file I/O. Make sure that you do these kinds of slow operations when you do not have an active transaction open in MySQL.
Indexes
Indexes reduce the amount of work performed to access a given row. That way indexes are a great tool to reduce locking as only records accessed while executing the query will be locked.
On the flip side, more indexes provide more ways to access the same rows which potentially can increase the number of deadlocks.
Record Access Order
Ensure that you to as large degree as possible access the records in the same order for different transactions. In the deadlock example discussed earlier in this chapter, what led to the deadlock was that the two transactions accessed the rows in opposite order. If they had accessed the rows in the same order, there would have been no deadlock. This also applies when you access records in different tables.
Ensuring the same access order is by no means a trivial task. Different access orders may even happen when you perform joins and the optimizer decides on different join orders for two queries. If different join orders lead to excessive lock issues, you can consider using the optimizer hints described in Chapter 17 to tell the optimizer to change the join order, but you should of course also have the query performance in mind in such cases.
Transaction Isolation Levels
InnoDB supports several transaction isolation levels. Different isolation levels have different lock requirements: particularly REPEATABLE READ and SERIALIZABLE require more locks than READ COMMITTED.
The READ COMMITTED transaction isolation level can help on locking issues in two ways. Far less gap locks are taken, and rows that are accessed during a DML statement but not modified have their locks released again after the statement has completed. For REPEATABLE READ and SERIALIZABLE, locks are only released at the end of the transaction.
It is often said that the READ COMMITTED transaction isolation level does not take gap locks. That is a myth and not correct. While far fewer gap locks are taken, there are still some that are required. This, for example, includes when InnoDB performs a page split as part of the update. (Page splits are discussed in Chapter 25.)
The locks held in the REPEATABLE READ transaction isolation level
The locks held in the READ-COMMITTED transaction isolation level
Here the record locks are reduced to one lock on each of the CountryCode index and primary key. There are no gap locks.
It is not all workloads that can use the READ COMMITTED transaction isolation level. If you must have SELECT statements return the same result when executed multiple times in the same transaction or have different queries correspond to the same snapshot in time, you must use REPEATABLE READ or SERIALIZABLE. However, in many cases, it is an option to reduce the isolation level, and you can choose different isolation levels for different transactions. If you are migrating an application from Oracle DB, you are already using READ COMMITTED, and you can also use it in MySQL.
Preemptive Locking
The last strategy that will be discussed is preemptive locking. If you have a complex transaction executing several queries, it can in some cases be an advantage to execute a SELECT ... FOR UPDATE or SELECT ... FOR SHARE query to take locks on the records you know you will need later in the transaction. Another case where it can be useful is to ensure you access the rows in the same order for different tasks.
Preemptive locking is particularly effective to reduce the frequency of deadlocks. One drawback is that you will end up holding the locks for longer. Overall, preemptive locking is a strategy that should be used sparingly, but when used for the right cases, it can be powerful to prevent deadlocks.
The final topic of this chapter is to review how to monitor locks.
Monitoring Locks
There have already been several examples of querying information about the locks held. This section will review the sources already mentioned as well as introducing some extra ones. Chapter 22 will go further into this by showing examples of investigating lock issues. The monitoring options can be divided into four groups: the Performance Schema, the sys schema, status metrics, and InnoDB lock monitoring.
The Performance Schema
The Performance Schema contains the source of most of the lock information available except for deadlocks. Not only can you use the lock information in the Performance Schema directly; it is also used for two lock-related views in the sys schema.
data_locks: This table contains details of table and lock records at the InnoDB level. It shows all locks currently held or are pending.
data_lock_waits: Like the data_locks table, it shows locks related to InnoDB, but only those waiting to be granted with information on which threads is blocking the request.
metadata_locks: This table contains information about user-level locks, metadata locks, and similar. To record information, the wait/lock/metadata/sql/mdl Performance Schema instrument must be enabled (it is enabled by default in MySQL 8). The OBJECT_TYPE column shows which kind of lock is held.
table_handles: This table holds information about which table locks are currently in effect. The wait/lock/table/sql/handler Performance Schema instrument must be enabled for data to be recorded (this is the default). This table is less frequently used than the other tables.
Object types in the performance_schema.metadata_locks table
Object Type | Description |
|---|---|
ACL_CACHE | For the access control list (ACL) cache. |
BACKUP_LOCK | For the backup lock. |
CHECK_CONSTRAINT | For the names of CHECK constraints. |
COLUMN_STATISTICS | For histograms and other column statistics. |
COMMIT | For blocking commits. It is related to the global read lock. |
EVENT | For stored events. |
FOREIGN_KEY | For the foreign key names. |
GLOBAL | For the global read lock (triggered by FLUSH TABLES WITH READ LOCK). |
FUNCTION | For stored functions. |
LOCKING_SERVICE | For locks acquired using the locking service interface. |
PROCEDURE | For stored procedures. |
RESOURCE_GROUPS | For the resource groups. |
SCHEMA | For schemas/databases. These are similar to the metadata locks for tables except they are for a schema. |
SRID | For the spatial reference systems (SRIDs). |
TABLE | For tables and views. This includes the metadata locks discussed in this chapter. |
TABLESPACE | For tablespaces. |
TRIGGER | For triggers (on tables). |
USER_LEVEL_LOCK | For user-level locks. |
The data in the Performance Schema tables is the raw lock data. Often when you investigate lock issues or monitor for lock issues, it is more interesting to determine if there are any lock waits. For that information, you need to use the sys schema.
The sys Schema
The sys schema has two views that take the information in the Performance Schema tables and return the lock pairs where one lock cannot be granted because of the other lock. Thus, they show where there are problems with lock waits. The two views are innodb_lock_waits and schema_table_lock_waits.
The innodb_lock_waits view uses the data_locks and data_lock_waits view in the Performance Schema to return all cases of lock waits for InnoDB record locks. It shows information such as what lock the connection is trying to obtain and which connections and queries are involved. The view also exists as x$innodb_lock_waits, if you need the information without formatting.
The schema_table_lock_waits view works in a similar way but uses the metadata_locks table to return lock waits related to schema objects. The information is also available unformatted in the x$schema_table_lock_waits view.
Chapter 22 includes examples of using both views to investigate lock issues.
Status Counters and InnoDB Metrics
Lock metrics
As you can see, not all of the metrics are enabled by default. Those that are not enabled can be enabled using the innodb_monitor_enable option as discussed in Chapter 7. The innodb_row_lock_%, lock_deadlocks, and lock_timeouts metrics are the most interesting. The row lock metrics show how many locks are currently waiting and statistics for the amount of time in milliseconds spent on waiting to acquire InnoDB record locks. The lock_deadlocks and lock_timeouts metrics show the number of deadlocks and lock wait timeouts that have been encountered, respectively.
InnoDB Lock Monitor and Deadlock Logging
InnoDB has for a long time had its own lock monitor with the lock information returned in the InnoDB monitor output. By default, the InnoDB monitor includes information about the latest deadlock as well as locks involved in lock waits. By enabling the innodb_status_output_locks option (disabled by default), all locks will be listed; this is similar to what you have in the Performance Schema data_locks table.
The InnoDB monitor output
Near the top is the section LATEST DETECTED DEADLOCK which includes details of the transactions and locks involved in the latest deadlock and when it occurred. If no deadlocks have occurred since the last restart of MySQL, this section is omitted. Chapter 22 will include an example of investigating a deadlock.
The deadlock section in the InnoDB monitor output only includes information for deadlocks involving InnoDB record locks. For deadlocks involving user-level locks, there is no equivalent information.
A little further down the output, there is the section TRANSACTIONS which lists the InnoDB transactions. Do note that transactions that are not holding any locks (e.g., pure SELECT queries) are not included. In the example, there is an intention exclusive lock held on the world.city table and an exclusive lock on the row with the primary key equal to 130 (the 80000082 in the record lock information for the first field means the row with the value 0x82, which is the same as 130 in decimal notation).
Nowadays the lock information in the InnoDB monitor output is better obtained from the performance_schema.data_locks and performance_schema.data_lock_waits tables. The deadlock information is however still very useful.
You can request the monitor output to be dumped every 15 seconds to stderr. You enable the dumps by enabling the innodb_status_output option. Do note that the output is quite large, so be prepared for your error log to grow quickly if you enable it. The InnoDB monitor output can also easily end up hiding messages about more serious issues.
If you want to ensure you record all deadlocks, you can enable the innodb_print_all_deadlocks option . This causes deadlock information like that in the InnoDB monitor output to be printed to the error log every time a deadlock occurs. This can be useful, if you need to investigate deadlocks, but it is recommended only to enable it on demand to avoid the error log to become very large and potentially hide other problems.
Be careful if you enable regular outputs of the InnoDB monitor or information about all deadlocks. The information may easily hide important messages logged to the error log.
Summary
The topic of locks is large and complex. Hopefully this chapter has helped you get an overview of why locks are needed and the various kinds of locks.
The chapter started out asking why locks are needed. Without locks, it is not safe to have concurrent access to the schema and data. Metaphorically speaking, database locks work in the same way as traffic lights and stop signs work in the traffic. It regulates the access to the data, so transactions can be sure there will not be a collision with another transaction causing inconsistent results.
There are two access levels to the data: shared access also known a read access and exclusive access also known as write access. These access levels exist for various lock granularities ranging from a global read lock to record and gap locks. Additionally, InnoDB uses intention shared and intention exclusive locks at the table level.
It is important to work at reducing the number of locks the application needs and to reduce the impact of the locks required. The strategies to reduce lock issues essentially boil down to doing as little work as possible in a transaction by using indexes and splitting large transactions into smaller ones, and holding the locks for as short time as possible. It is also important to attempt to access the data in the same order for different tasks in the application; otherwise, unnecessary deadlocks may occur.
The final part of the chapter went through the lock monitoring options in the Performance Schema, the sys schema, status metrics, and the InnoDB monitor. Most of the monitoring is best done using the Performance Schema tables and the sys schema views. The exception is for deadlocks where the InnoDB monitor is still the best option.
This is the conclusion of Part IV. It is time to become more practical with query analysis starting with finding the queries that are candidate for optimization.