
Welcome to the world of MySQL performance tuning. It is a world that sometimes can seem like it is dominated by black magic and luck, but hopefully this book can help you work in a structured way and methodically work your way to a better performance.
This chapter introduces you to MySQL performance tuning by talking about the whole stack as well as the importance of monitoring and basing your actions on data. Since this book is mainly about working with queries, the lifecycle of a query is reviewed before concluding the chapter.
If you need a test instance, whether it is while reading this book or for working on a problem at work, the cloud can be your friend. It allows you to quickly spin up a test instance. If you just need a small instance, for example, to explore examples in this book, you may even be able to use a free instance, such as through Oracle Cloud’s free tier (registration and a credit card is still required): https://mysql.wisborg.dk/oracle_cloude_free_tier.
Consider the Whole Stack
When you investigate performance problems, it is important that you consider all parts of the system from the end user through the application to MySQL. When someone reports that the application is slow, and you know that MySQL is a central part of the application, then it is easy to jump to the conclusion that “MySQL is slow.” That would however rule out a large array of potential causes of the poor performance.
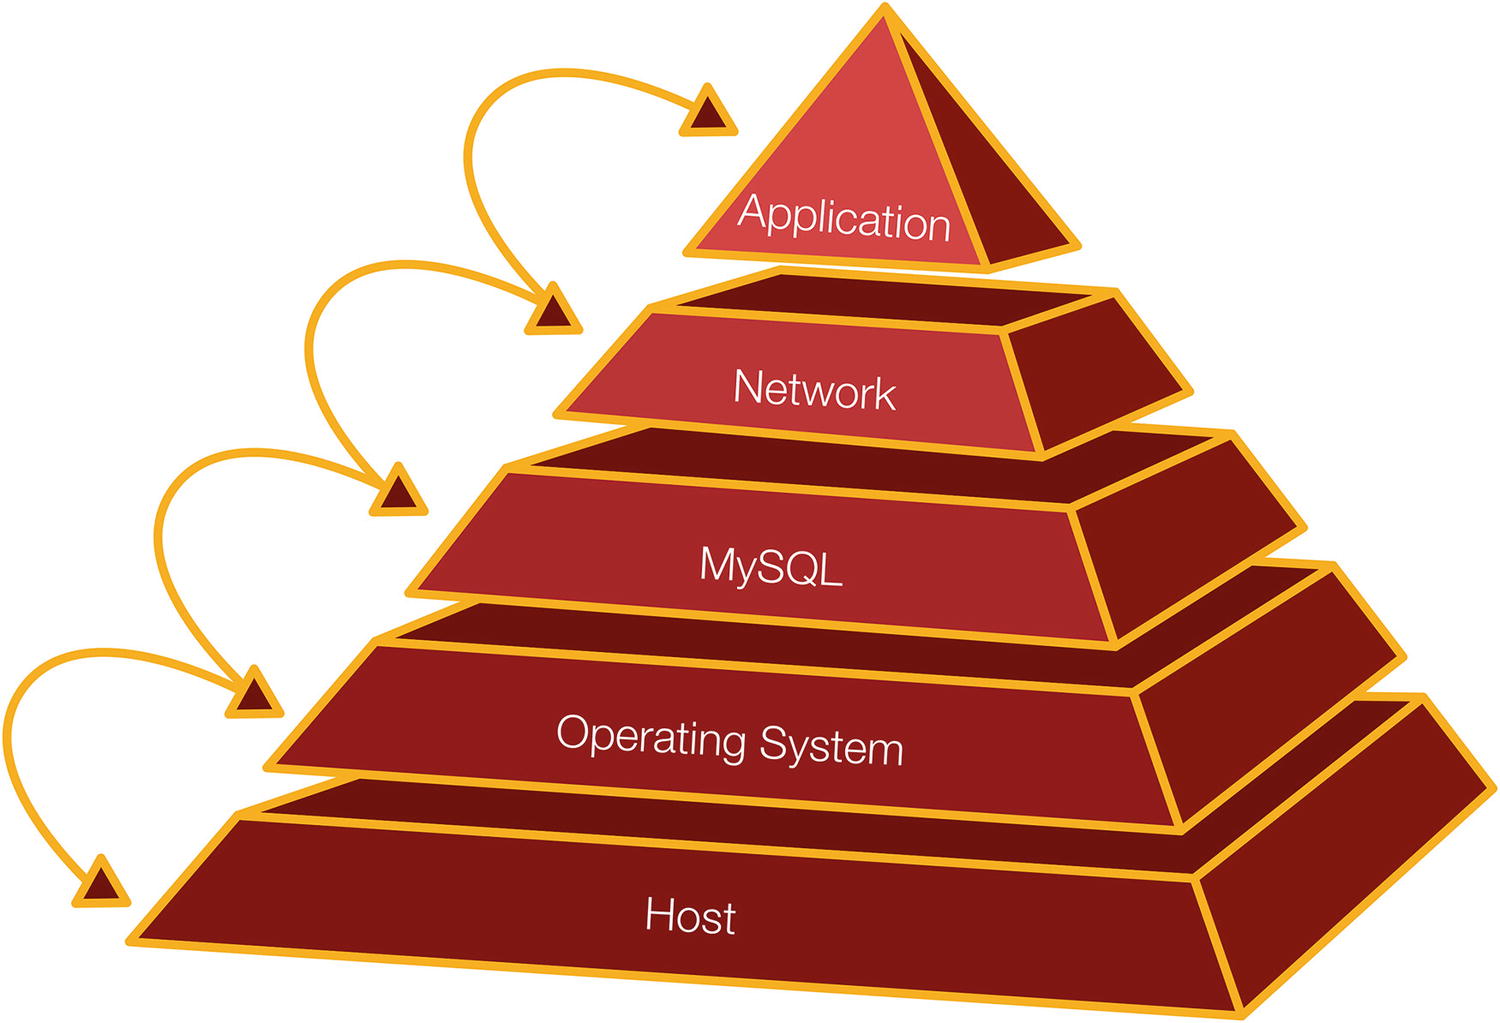
The stack focused around MySQL
The pyramid is a very simplified picture which leaves out everything beyond the application which may in turn communicate with a user and use its own resources. Communicating over the network also involves both the host and operating system.
To illustrate how the layers can interact, consider a real-world example. A MySQL user reported problems with MySQL experiencing temporary stalls. An investigation using the perf tool on Linux revealed that stalls happened because the memory got extremely fragmented, mainly caused by the I/O cache. When you submit data over the network, Linux requests a contiguous piece of memory (using kmalloc), but because of the severe memory fragmentation, Linux had to defragment (compact) the memory first. While this compaction took place, everything including MySQL stalled, and as it in the worst cases took up to a minute (the server had a large amount of memory available for I/O caching), it caused a severe impact. In this case, changing the MySQL configuration to use direct I/O worked around the issue. While this is an extreme case, it is worth bearing in mind that interactions can cause surprising points of congestion.
A more straightforward real-world example was an application that used a framework to generate queries. There was a bug in the framework that meant that a WHERE clause was omitted for queries against a large table. That meant a cascading list of problems including the application retrying the query and culminating with 50 copies of the query finishing within a few seconds (because the data finally had been read into the buffer pool making the last queries execute much faster than the first) and sending a huge amount of data back to the application causing the network to overload and the application to run out of memory.
This book focuses on MySQL and the aspects affecting queries, but do not forget the rest of your system. That includes when you monitor your system.
Monitoring
If you take just one thing with you from reading this book, then let it be that monitoring is critical to maintain a healthy system. Everything you do should revolve around monitoring. In some cases, monitoring through a dedicated monitoring solution provides all the data you need, and in other cases you need to make ad hoc observations.
The Performance Schema which includes information ranging from low-level mutexes to query and transaction metrics. This is the single most important source of information for query performance tuning. The sys schema provides a convenient interface particularly for ad hoc queries.
The Information Schema which includes schema information, InnoDB statistics, and more.
SHOW statements which, for example, include information from InnoDB with detailed engine statistics.
The slow query log which can record queries matching certain criteria such as taking longer than a predefined threshold.
The EXPLAIN statement to return the query execution plan. This is an invaluable tool to investigate why a query is not performing well due to missing indexes, the query being written in a suboptimal way, or MySQL choosing a suboptimal way to execute the query. The EXPLAIN statement is mostly used in an ad hoc fashion when investigating a specific query.
Operating system metrics such as disk utilization, memory usage, and network usage. Do not forget simple metrics such as the amount of free storage as running out of storage will cause an outage.
These sources of information are all discussed and used throughout this book.
When you use monitoring throughout the whole performance tuning process, you can verify what the issue is, find the cause, and prove that you have solved the issue. While working on a solution, it can also be useful to understand the lifecycle of a query.
The Lifecycle of a Query
When you execute a query, it goes through several steps before the result of the query is back at the application or client. Each step takes time and may itself be a complex operation consisting of several subparts.
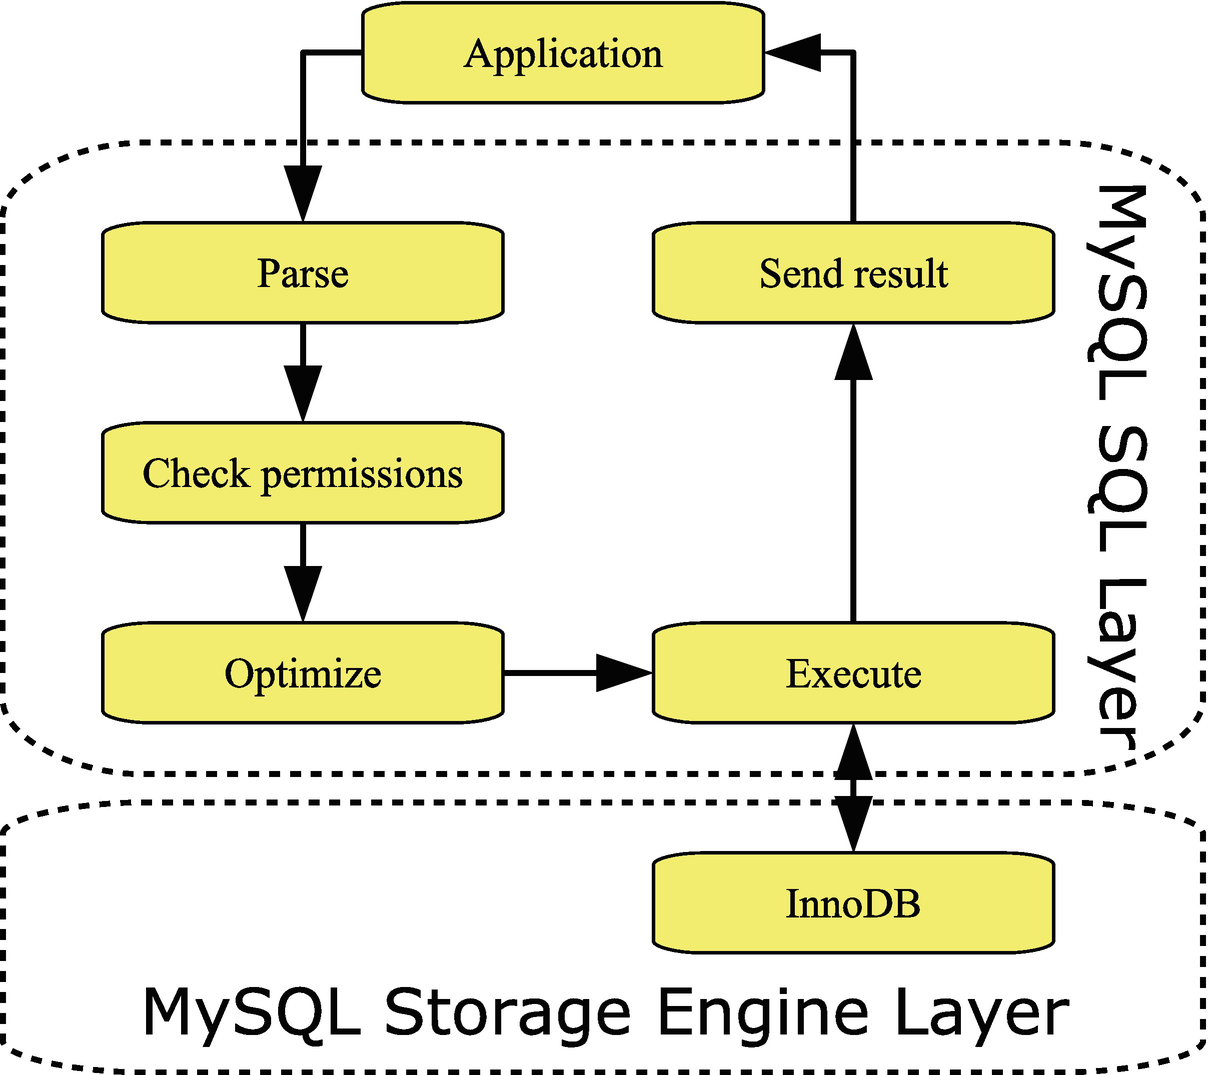
The basic query lifecycle
MySQL Server can be divided into two layers. There is the SQL layer which, for example, handles the connections and prepares statements for execution. The actual data is stored by storage engines which are implemented as plugins which makes it relatively easy to implement different ways to handle data. The main storage engine – and the only one that will be considered in this book – is InnoDB which is fully transactional and has very good support for high-concurrency workloads. An example of another storage engine is NDBCluster which is also transactional and is used as part of MySQL NDB Cluster.
When the application needs to execute a query, then the first thing is to create a connection (this is not included in the figure as the connection may be reused to execute more queries). When the query arrives, MySQL parses it. This includes splitting the query into tokens, so the query type is known, and there is a list of the tables and columns required by the query. This list is needed during the next step where it is checked whether the user has the necessary permissions to execute the query.
At this time, the query has reached the important step of determining how to execute the query. This is the job of the optimizer and involves rewriting the query as well as determining the order to access the tables and which indexes to use.
The actual execution step includes requesting the data from the storage engine layer. The storage engine may itself be complex. For InnoDB, it includes a buffer pool used to cache data and indexes, redo and undo logs, other buffers, as well as tablespace files. If the query returns rows, these are sent back from the storage engine through the SQL layer to the application.
In query tuning, the most important steps are the optimizer and execution steps including the storage engine. Most of the information in this book relates to these three parts either directly or indirectly.
Summary
This chapter has scratched the surface of performance tuning and prepared you for the journey of the rest of the book. The key takeaways are that you need to consider the whole stack from the end user to the low-level details of the host and operating system and monitoring is an absolute must in performance tuning. Executing a query includes several steps, of which the optimizer and execution steps are the ones that you will learn the most about in this book.
The next chapter will look closer at a methodology that is useful for solving performance issues.