
An essential part of the development process of almost any software project is debugging. A good debug method allows developers to exactly pinpoint problems in the application.
Application Express offers some built-in functionality to debug applications, pages, and even items. This recipe will explain how to set up debugging on an application and how to interpret the reports that APEX generates.
The only thing we need to start on this recipe is a (working) application. We will use a simple application, based on the EMP table.
Create a new application with a Form and Report (based on an interactive report) on the EMP table. That is enough to get through this recipe.
First of all debugging has to be enabled for the application. By default, this option is disabled. To enable debugging, follow the next steps:
- In the Application Builder, select the application that we are going to debug.
- Locate the button labelled Edit Application Properties near the top of the main region and press it.
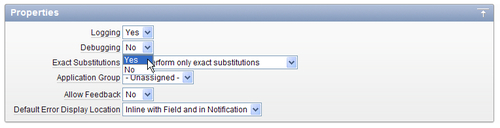
- Find the area called Properties and change the value of the select list called Debugging from No to Yes.
- Press Apply Changes.
Now the application is ready to be debugged.
- Start the application.
- In the Developer Toolbar at the bottom of the screen, press the button labeled Debug. If the steps in the first part of this recipe have gone well, then the label will change to No Debug. Otherwise an error message will appear and we have to check if debugging on the application is really set to Yes.
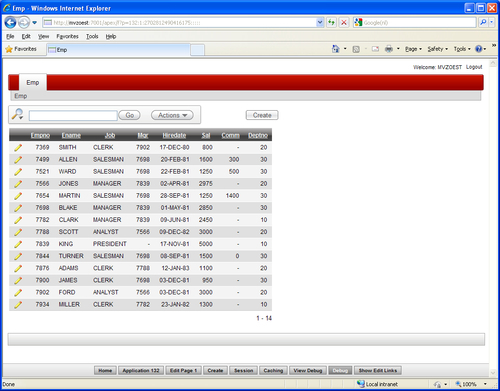
- Perform some actions on the application, like navigating or performing a search.
- When you navigate to a different page, the Debug option will turn off automatically. If you want to re-enable it, simply press the button in the Developer Toolbar again. To avoid this behaviour, we can also call the application using the value YES for the &DEBUG. substitution in the URL on the fifth parameter position. Buttons and links calling URLs inside the application will have to hold the substitution as well. A URL with this substitution will look like this:
f?p=APP_ID:APP_PAGE_ID:APP_SESSION::YES:::- Press the button labelled View Debug in the Toolbar. This will open up a new window with a list of actions that have been performed during the time that Debug was enabled.
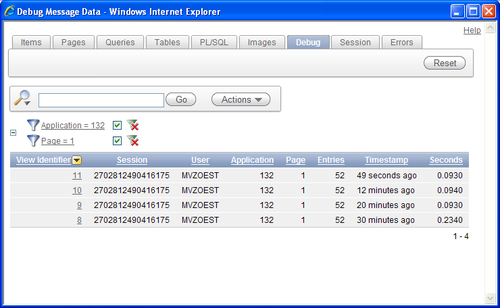
By default the current page is selected. To see debug information for other pages, deselect the filter for Page.
The list in the screenshot shows a timestamp for when the page was called, how many actions took place while loading the page (under the Entries column), and how many Seconds it took to fully load the page.
- Press one of the links in the column View Identifier to see the debug information for the loading of that page.
- Review the report that is now shown. The following screenshot shows an example of a Save action on the Edit page of the EMP application. Results may look different when another action or page has been selected.
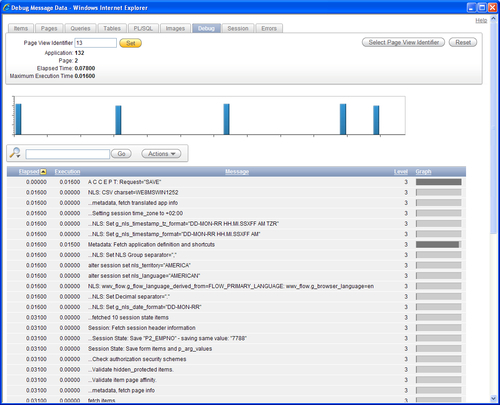
This report is made up of three regions of interest. The top region shows information about the currently selected page. Most of it is also shown in the main overview from the previous screenshot, but Maximum Execution Time is new. This tells us the time it took the longest process to complete, so we can quickly identify where a performance problem might exist.
In this same perspective of quickly identifying problems, the graph section can be seen. Processes taking a lot of time to load will get a higher graph bar. When hovering over a bar with the cursor, the relevant process can be identified.
The main part of the screen is occupied by a report. This report shows all processes that are executed during the load of the currently selected page.
The first column shows the elapsed time after processing the current line. The second column shows the time that the particular process took. So, for example, when we look at the line that says ...fetch session state from database, we can see that the time it took to complete that process was 0.01600 seconds, but the total loading time for all processes until that moment was 0.03100 seconds.
The total report can be used for three purposes: what happened, when it happened, and how long it took.
We can see some NLS parameters being set in lines like:
NLS: CSV charset=WE8MSWIN1252
Or
alter session set nls_language="AMERICAN"
Because we selected a SAVE operation to debug, we can also find a couple of lines for this as well.
Session State: Saved Item "P2_ENAME" New Value="SCOTT"
Session State: Saved Item "P2_SAL" New Value="3200"
(Variable names and values may vary).
Now, we will change the Edit page and try to find out if we can find this alteration in the debug information.
- Go to the Application Builder and select Page 2 to edit.
- In the Edit Emp region, add a hidden item.
- Name it DEBUG_TESTING and click Next.
- Set Value Protected to No and click Next.
- The Source Type will be SQL Query (return single value).
- In Item Source Value enter the query:
select sysdate from dual. - Press Create Item.
Now when we run the application and enable Debug on the pages, the information for this new item should be seen in the debug report.
To check this, press the View Debug button again and find the latest entry for page 2. When browsing down the debug report, you will find a line with the text Item: DEBUG_TESTING NATIVE_HIDDEN to show that the new item was indeed created at runtime with the rest of the page.
In the same fashion, any item loaded in a page can be found and analyzed.
Besides the debug messages that APEX generates itself, it's also possible to create our own custom messages inside PL/SQL processes.
- Go to Page 1 of this recipe.
- Expand the Before Header node.
- Right-click on Processes and press Create.
- Select PL/SQL and press Next.
- Enter the name show_custom_debug and click Next.
- Enter the following code in the PL/SQL Process area and press Create Process:
wwv_flow.debug('My Custom Debug Message'), - Run the page and click the Debug button in the Developer Toolbar.
- Click the View Debug button.
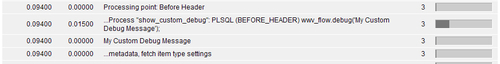
In the Debug screen, we can now see two entries mentioning our custom code. The first is the process itself that is being called. The second is our custom debug message.
Using this it's possible to quickly find certain pieces of code using these custom messages as a sort of bookmark. But more advanced debugging is also possible, for example, by showing the value of a variable.
- Go back to the page and edit the
show_custom_debugprocess. - Change the PL/SQL code to the following:
wwv_flow.debug('My Custom Debug Message for: '||:APP_USER); - This will add the username of the current logged-in user to the message.
- Press Apply Changes.
- Run the page and press the Debug button in the Developer Toolbar.
- Press the View Debug button.
When we open the Debug window now and look for our message, we can see that it indeed changed and now shows the username.