
CHAPTER 6
Designing the Workbook Structure
INTRODUCTION
This chapter discusses issues relating to the design of the overall workbook structure. These include the use of linked workbooks, the number of worksheets, the role of each worksheet and the data structures used. It is probably fair to say that insufficient attention is generally paid to such issues. We present a set of generic base practice structures in terms of the placement of data and calculations, as well as tools and techniques to select or consolidate data that is used across multiple worksheets.
Designing Workbook Models with Multiple Worksheets
This section presents some general principles relating to overall model structure, especially the use of linked workbooks, and the role of each worksheet in models with multiple worksheets.
Linked Workbooks
In principle, models should be self-contained within a single workbook, and not have links to other workbooks. The main reason is to avoid potential errors that can otherwise easily arise, yet be hard to detect:
- If structural changes are made to a source workbook (e.g. the addition/deletion of rows or columns, renaming of the workbook or of a worksheet) when the destination workbook is not open, then such changes will generally not be reflected in the formulae in the (closed) destination workbook. For example, the link may be altered to refer to last month's oil price rather than this month's. As a result, one cannot know a priori whether the linked cells in a destination workbook are linked to the correct cells in the source workbook or not. Thus, such models are inherently prone to errors. In principle, an “audit” would be required every time the model is used. Clearly, this is not only impractical but also highly unsatisfactory if one wishes to have reliable and efficient models.
- If numerical changes are made (such as to run sensitivity analysis) within linked workbook structures, the results may be incorrect unless all workbooks are open at the same time.
In practice, it may not always be possible to avoid linking workbooks. Frequently, there is a need to access a centralised data set in another workbook (such as that of a company's standard oil price forecast). Similarly, the output of a set of individual analysts' work may need to be collected into a central reference workbook. When linked workbooks cannot be avoided, there are two main ways to improve robustness:
- Using “mirror” worksheets. These are worksheets which are identical in structure, and are placed in each of the source and destination workbook. The objective is to create indirect links, so that the owner of each workbook can work independently without having to consider other workbooks:
- The mirror sheet in the source workbook is populated from cells within the same workbook by using direct references to the relevant cells within it (i.e. taking data from that workbook).
- The mirror sheet in the destination workbook is populated by referencing the corresponding cells in the mirror sheet of the source workbook (thus creating the links between the workbooks). Note that once the sheets are placed in each workbook, they should not be changed structurally.
- The mirror sheet in the destination workbook is used to populate the main calculations of the destination workbook by using cell references.
- Using named ranges in the source workbook for the data that is to be linked, and referring to such data (from the destination workbook) using these names. In this way, the correct references will apply even if the cells in the source workbook have been moved when the destination workbook is not open.
The use of mirror sheets has the advantage that it isolates the linking process in a very explicit and transparent way. In principle, one can use both methods together (i.e. in which named ranges are used within mirror sheets). However, once mirror sheets have been implemented, the additional benefit of the named ranges is only marginal (whereas using only the named range approach does not isolate the linking process, nor does it create the same level of transparency about the existence of the linkages).
Multiple Worksheets: Advantages and Disadvantages
Many traditional models are structured over several worksheets. Reasons often cited for using multiple worksheets include:
- To devote a worksheet to each main item or concept. For example, one may have a dedicated worksheet for each of revenues, variable costs, capital investments, depreciation, net asset values, tax, dividends, financing, the income statement, balance sheet and cash flow statement, and so on.
- To ease model navigation or printing (this can also be facilitated using named ranges, rather than using multiple worksheets).
- As a result of the development of a model over time by various analysts. Sometimes, additional parts of the model are simply started in another worksheet to avoid changing the existing structure or to keep one's work separate from that of someone else's.
- It just seemed like a good idea!
However, there are some key disadvantages of using an excessive number of worksheets:
- Auditing the model is much more cumbersome, time-consuming and error-prone than it is for a model built in a single worksheet:
- The audit paths are three-dimensional and diagonal, with even the following of basic logical paths requiring one to move between worksheets. On the other hand, in a single worksheet model, the dependency paths are almost always either horizontal or vertical (not diagonal). Thus, the complexity, time taken and potential for errors become significantly larger when multiple worksheets are involved.
- The formulae are larger and look more complex, not least due to the explicit presence of worksheet names within them.
- There are often many repeated formulae and cell references, as items are transferred from one sheet to another.
- There is a higher risk of unforeseen errors, such as the creation of circular references.
- The detection and correction of errors by modifying formulae and their linkages is much harder and cumbersome in multi-sheet calculations.
- A single worksheet model generally may be used quite readily as a template. For example, a model that is developed in a single worksheet could be copied several times within the same workbook (for example, with each worksheet representing a business unit, and a consolidation sheet used to aggregate these).
The author's overall experience is that most models have too many worksheets, with insufficient attention paid to the appropriate role of each. This is discussed in detail in the next section.
GENERIC BEST PRACTICE STRUCTURES
In this section, we present the author's view of some best practice model structures, especially with respect to the workbook structure and role of each worksheet.
The Role of Multiple Worksheets in Best Practice Structures
In the author's opinion, the most legitimate uses of using multiple worksheets are:
- To create modularised structures. There may be several components (such as business units, scenarios, months etc.) with identical structures (at least at the summary level) and which need to be used individually within an overall model.
- To allow for the easy entry or deletion of data sets (see later).
- Where several separate (single sheets) or analyses are to be consolidated. For example, the sales department may provide a revenue forecast, whereas the engineering team may provide cost analysis, with the main model using both sets of data to calculate profit. It would often make sense for the components to be in separate worksheets (and to have an additional consolidation worksheet) to allow for each group to update their own models, with each acting as an input to the overall consolidated model.
- When the structure of the calculations changes significantly between model areas. For example, the main model may contain a time axis that develops across columns, whereas some input values may be determined from a statistical analysis of a database, in which the time axis develops in the rows. In such case, it would often make sense to have the analysis and the main model on separate worksheets.
- To create robust links to another workbook using mirror sheets (see above), or to link to an external data source using a dedicated linking worksheet.
- Where it is desired to hide confidential data (by hiding the worksheet and applying the appropriate password-protection to the workbook structure); this is not a very robust approach for highly confidential data, but may be considered in less important cases.
In Figure 6.1, we show some key generic best practice model structures, which are described in the following text.

FIGURE 6.1 Generic Best Practice Model Structures
Type I: Single Worksheet Models
In single worksheet models, the input data and the calculations are built into a single sheet. Generally, there will be a presentation, reporting or summary area within the sheet as well. The author believes that, as a default approach, models should be built in this way (a view which contrasts with many models observed in practice). Single-sheet models (if reasonably well-built), will generally have easy (horizontal/vertical) audit paths, and can also be used as a template for larger models that are constructed by copying this sheet several times in the same workbook (and can form the basis for Type III models).
Type II: Single Main Formulae Worksheet, and Several Data Worksheets
In this case, data sheets contain “local” inputs (e.g. that describe data for a business unit, or a scenario or a month). In principle, these sheets have the same structure as each other. The overall model will typically require “global” inputs (such as the oil price that is applicable to all business units); such global inputs may be contained within the main formula worksheet (so that this main sheet is rather like a Type I model, albeit also requiring external inputs from the data sheets).
Type III: Single Main Formulae Worksheet, and Several Data and Local Analysis Worksheets
This is similar to Type II models, except that “data” sheets also contain some calculations which drive the information or values that are ultimately passed to the main model's calculations. In the following, we shall continue to refer to such sheets as data sheets, even as they also contain some calculations. In general, the calculations in each data sheet may be different to each other: for example, each sheet may represent a country, with the calculations determining the taxes payable in that country according to country-specific calculations. However, each sheet would contain a summary area (generally placed at the top of the sheet), which is structured in the same way across all sheets, and which contains the information that needs to be passed to the Intermediate sheet.
Further Comparative Comments
The following additional points are worth noting when comparing the generic structures:
- For simplicity of presentation, Figure 6.1 does not explicitly show additional worksheets that would be required to link to other workbooks (i.e. the mirror sheets). Such worksheets would simply be extra worksheets that would link into the local data worksheets or the main model sheet.
- Although Type II and Type III are typically the appropriate generic structures for multi-sheet models, they can also be considered as describing possible variations of the single sheet (Type I) model, i.e. one in which there is a modular structure, with formulae placed closed to the data which is required within the calculations. A discussion and an example of this are provided in Chapter 7.
- The models of Type II and Type III each contain an Intermediate worksheet which links into the main formula sheet. This Intermediate sheet contains the result of a structured query of the data sheets: either using the information on only one of the data sheets (i.e. an exclusive/selection process) or the information on several of the sheets at the same time (i.e. a consolidation process, in the general sense). The final model's calculations in the main formula sheet are built by referencing this Intermediate sheet (rather than referencing the individual data sheets). Although such an intermediate step is not always strictly necessary, generally it allows for more flexibility in the construction of the main model; the cell links between the main formula sheet and the Intermediate sheet can be created in any way that is appropriate for the structure of the main model, whilst the formulae within the Intermediate sheet would be required to follow the same structure as that of the data sheets.
- When the structures in Type II and Type III are used, the data sheets within each should generally have the same structure as each other. This facilitates the processes to populate the Intermediate sheet. Nevertheless, their structures do not need to be identical in all cases. For example, in Type II, each data sheet may contain a database which has the same column (field) structure as in the other data sheets, even as the number of rows within each may be different. For example, the Intermediate sheet may be constructed from these using a VBA macro to consolidate the data sets one underneath the other.
- When working with Type II or Type III structures, one may also have a template sheet (contained within the model or held separately) that contains the generic data sheet structure (Type II) or the generic data and calculations (Type III). This template can be used to add a new sheet to the model when required (it will generally be more robust to do this than to copy an existing data sheet, especially if a macro is used to add it).
- The presentation or reporting area may often be an implicit part of the main model (formula sheet), rather than a separate sheet. In particular, if one wishes to use a DataTable to show sensitivity analysis (see Chapter 12), then this needs to be on the same worksheet as the inputs that are varied.
USING INFORMATION FROM MULTIPLE WORKSHEETS: CHOICE (EXCLUSION) AND CONSOLIDATION (INCLUSION) PROCESSES
In this section, we cover techniques that can be used to access the individual data sheets, i.e. formulae and processes that can be used in the Intermediate sheet. Some of the techniques are mentioned only at a summary level here, as they are described later in more detail in Part V and Part VI. Those methods that relate to Excel functionality (rather than to its functions or to VBA) are shown with examples in this section.
It is necessary to distinguish:
- Exclusive processes, where data from only one of the sheets needs to be accessed at any one time (such as with scenario data). The data can be brought onto the Intermediate worksheet (and subsequently into main model calculations) by:
- Using a CHOOSE function (Chapter 25) to directly reference each data sheet. This is appropriate when the number of data sheets is fixed.
- Using the INDIRECT function (Chapter 25) where the number of data sheets may change (as new sheets are added or deleted). Similar functionality can also be obtained using VBA user-defined functions (Chapter 33).
- Consolidation processes, where data from several of the sheets needs to be accessed simultaneously (such as to add the revenues of several business units). The data can be brought onto the Intermediate worksheet (and subsequently into main model calculations) by:
- Using direct cell (or range) references to the data sheets. This is usually straightforward, so is not discussed further, other than to note that it is most applicable and efficient only when the number of data sheets is fixed.
- Use formulae that perform calculations across sheets, or which consolidate values across several sheets in some way. This is most appropriate where the number of data sheets may vary. Such approaches include using:
- Multi-sheet (“3-dimensional”) formulae.
- Excel's Data/Consolidation functionality.
- A VBA macro to create a consolidated data set.
- User-defined functions that sum (or perform other operations) on the values in a set of data sheets, with this set (or a range which defines them) being an input parameter to the user-defined function (see Chapter 33).
Multi-sheet or “Three Dimensional” Formulae
The file Ch6.1.Consolidate.SumAcrossSheets.1.xlsx contains an example of multi-sheet formulae.
Figure 6.2 shows the overall worksheet structure of the workbook, which consists of several data sheets (Field1, Field2 etc.), one of which is shown in Figure 6.3 (that of Field2).

FIGURE 6.2 Structure of Worksheets in the Workbook

FIGURE 6.3 A Typical Data Sheet for the Summing Across Worksheets Example
In Figure 6.4, we show the consolidation formulae used in the Intermediate sheet, which calculates the sum of the values in the corresponding cells of the data sheets.
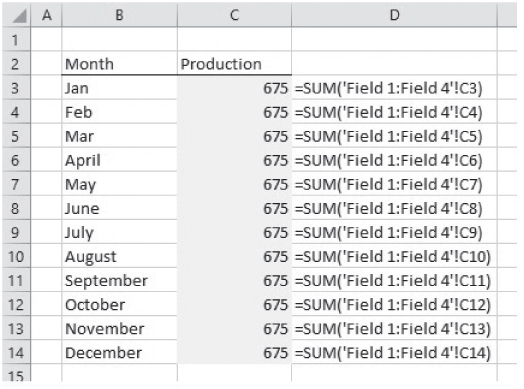
FIGURE 6.4 Summing Across Ranges of Worksheets
Note that the formula is entered in the summary (Intermediate) sheet by:
- Typing “=SUM(” within the cell at which one wishes to place the formula.
- Selecting the cell in the first sheet that is desired to be included in the sum, so that the formula then reads (for example) “=SUM('Field 1'!C3”.
- Holding down the Shift key.
- Clicking on the tab name of the last sheet to include (such as Field4).
- Within the Formula Bar, adding the closing bracket and pressing Enter.
It is very important to note that the worksheets included within the sum are determined by their physical placement in the model (not by their number), so that in the example file, if the data sheet Field3 were moved to be to the right of Field4, then the data for Field3 would not be included in the summation.
Note also that functions such as AVERAGE and COUNT can be used in the same way.
Using Excel's Data/Consolidation Functionality
The Consolidation icon on the Data tab can be used to consolidate data, either by using their values (by not retaining the links to the original data sets), or by creating direct formula links to the data sets (which would be cumbersome to create otherwise).
The file Ch6.2.Consolidation.Data.SameStructure.xlsx contains an example. Multiple tables of data with the same structure can be consolidated (using Data/Consolidation), with an example dialogue shown in Figure 6.5. In the dialogue box as shown, the option to link to the source data has not been used, resulting in a consolidation as shown in Figure 6.6.

FIGURE 6.5 Using Excel's Data/Consolidation Feature

FIGURE 6.6 Results of Consolidating Without Links to Source Data
Figure 6.7 shows the results that would be produced if the “Create links to source data” option had instead been selected (see Figure 6.5). Note that in this case, the process produces grouped rows in this case. This approach retains live links to the data sets (so that the underlying values can be changed), but would only generally be appropriate if the number of data sets and their size is fixed (otherwise the process would need to be repeated, and overwrite the original formulae links, and so on).

FIGURE 6.7 Results of Consolidating with Links to Source Data
Consolidating from Several Sheets into a Database Using a Macro
The above approaches have consolidated the values in the data sets in the sense of (generally) adding the values together. In some cases, a consolidation of the data sets may be desired in which the values of individual data are retained when transferred to the Intermediate sheet (i.e. without any calculations being performed). One way to create a single database of the data sets in the Intermediate sheet is by using a macro to sequentially assign the values in one data sheet into the Intermediate sheet, placing the data sets one under the other (see Chapter 32). Such an approach is essentially identical, irrespective of whether the number of data sheets is fixed or is variable. Note that where (especially for Type III) the data sheets are not identically structured to each other, only the (identically structured) summary part of each sheet should be copied. In such a structure, the main calculations (formulae sheet) will contain queries that refer to the Intermediate sheet (such as using SUMIFS, Database or other functions).
One potential disadvantage of this approach is the lack of live-linking from the data sets to the final calculations. Thus, a direct sensitivity analysis (in which values of items in the data sheets are varied) could not be conducted. On the other hand, whereas such sensitivity could be conducted with macros (see Chapter 14), in many cases the items that would be varied would not be the individual detailed items in the data sets, but those that result from the intermediate queries.
User-defined Functions
User-defined functions (udfs) can be written which use a sheet name (or the names of multiple sheets) as an input parameter(s). They can be created to perform essentially any operation on the underlying data sets (and placed within the Intermediate sheet, or perhaps directly in the main model calculations, as appropriate). For example:
- To select the values in the same cell of a data sheet, where the name of the data sheet is an input parameter to the udf.
- To perform operations on the data within a single data sheet, where the name of the data sheet is an input parameter to the udf.
- To perform operations on the data within multiple sheets (such as add up the values in the same cell reference of several sheets), where a range of cells containing the names of the data sheets is an input parameter to the udf.
These basic elements of these approaches are covered in Chapter 33.