37
Continuous Delivery
NOMENCLATURE
The world of Continuous Delivery introduces a number of terms that you either might not be familiar with or might only know in a different context. So it’s worthwhile to take a few minutes to define some of these terms, just to make sure that you understand their meaning in the context of continuous delivery.
Continuous Delivery
Continuous Delivery is a process that allows you to get all types of software changes (including bug fixes, new features, and experimental development) into production in a fast, safe and sustainable way.
One of the fundamental ideas is that it shouldn’t take a long period of time for a piece of software to get into production. This means that instead of spending weeks designing a set of features, months developing them, and finally releasing them into production, the cycle from start to finish is greatly shortened. You might even have multiple deployments to production every single day. The time from “hey, I think this might be a good idea” to being able to deliver it to the client could be measured in hours and days instead of not weeks and months.
Exactly how this is accomplished depends on the environments involved. A common practice is to set up a release pipeline. This is a series of successful environments that support progressively longer and more rigorous integration, load, and user acceptance testing.
For example, you might have a development environment, a QA environment, and a production environment. Each of these environments should be identical (ideally) or at least similar enough that moving the application from one environment to the other is painless. The starting point for a release is triggered by continuous integration (see the next section), and there is automation that moves the release from environment to environment depending on the successful completion of a suite of tests.
A release pipeline is not the sole measure of whether you’re performing continuous delivery. Depending you your needs, you might utilize techniques like features flags, deployment rings, and infrastructure as code. Each of these is aimed at solving the same problem: being able to move code to production safely and quickly.
Continuous Integration
Continuous delivery is triggered by continuous integration. And continuous integration (CI) is the process of automating the building and testing of the source code every time a team member commits a change to version control.
The idea behind CI is twofold. First, consider that development is a relatively solo occupation. You write code, fix bugs, and tweak design. Then you need to merge your results into the main code base so that others can use it or it can be deployed. However, if you want days or weeks to integrate your changes into the code base, the effort can be extraordinary, not to mention fraught with the possibility of introducing new, and as yet undiscovered, bugs.
Continuous integration is triggered the moment you commit your changes. It starts by building the entire application. Then, if successful, it runs the code through a series of tests. This not only ensures that your changes haven’t accidentally clashed with someone else’s changes, it also makes sure that there are no regression bugs that have been accidentally introduced.
DevOps
As a term, DevOps has grown in significance in the past five years. It is now part of the zeitgeist for thought leaders in the development world. But getting any significant agreement on exactly what is meant by DevOps is difficult. Part of the reason for this difficulty is because DevOps isn’t really a “thing.” It’s more of a process and the tools that are used to support that process. And that process is to enable continuous delivery.
Consider for a moment the genesis of the term. It’s a contraction of “Development” and “Operations.” The idea is to suggest that the greatest level of success is achieved by taking two formerly independent groups and joining them for the greater glory. To be frank, developers frequently don’t think about what it’s going to take to deploy and monitor their applications, and operations staff is frequently seen as imposing unrealistic restrictions on what would otherwise be awesome and world-changing applications. Combining development and operations together helps ensure that development and operations staff cooperate more productively.
A common approach to the DevOps process is to take advantage of something developed to help fighter pilots—the OODA Loop. OODA stands for Observe, Orient, Decide, Act. In the world of software, this means that, as part of your development and deployment cycle, you observe the current demands, results and requirements, identify what you can do about them (the “orient” phase), decide on the best course of action to take, and then act on that decision. This loop repeats itself for every delivery.
Ultimately, DevOps is the ability to quickly deliver on business value, determine the success or failure of that delivery, and then correct or continue in that direction. The speed with which you can perform this loop is your cycle time. The goal is to find ways to shorten this cycle time. To accomplish this, you take steps like implementing smaller features, using more automation, ensuring the quality of the product produced by your release pipeline, and improving the telemetry of your application.
Two of those items (smaller features and more automation) are determined by corporate culture and choices. The use of telemetry is covered in Chapter 34, “Obfuscation, Application Monitoring, and Management,” specifically in the “Application Instrumentation and Analytics” section. In this chapter, we look at some of the tools available in Visual Studio to help with the release pipeline.
CONTINUOUS DELIVERY TOOLS
In keeping with the philosophy of trying to minimize the footprint of Visual Studio (and because not every project benefits from continuous delivery), the tooling for continuous delivery is available through a separate extension. To install the Continuous Delivery Tools, open the Extensions and Updates dialog (Tools ➪ Extensions and Updates. Then select the Online node in the tree view on the left and enter “Continuous” into the search text box on the right (see Figure 37-1).
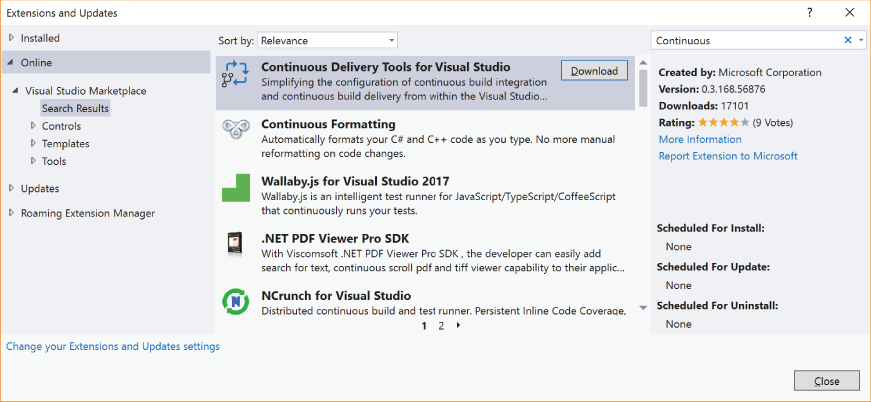
You should see the Continuous Delivery Tools for Visual Studio at or near the top of the results. Click on the Download button to start the installation process. Along with needing to accept the licensing conditions, you will need to restart Visual Studio for the installation to complete.
Setting Up Continuous Delivery
For each repository and branch that you want to participate in continuous delivery, you will need to set up a pipeline. For our example, we will be working with an ASP.NET Single Page Application project that has a single branch (master) and has been committed to a Git repository in Team Services. But the steps that are described in this section apply to any ASP.NET application, including ASP.NET Core.
To start, choose the Configure Continuous Delivery option from the Build menu. This launches the Configure Continuous Delivery dialog, as seen in Figure 37-2.

The top portion of the dialog is used to identify the repository and branch. The repository is provided automatically based on the current solution’s repository and can’t be changed. The branch is a dropdown list of all of the branches defined within that repository. The lower portion of the dialog allows you to define the Azure resource that is going to be used to manage the pipeline. The Subscription dropdown contains a list of all of the subscriptions associated with the user ID found in the top right of the dialog. Naturally, if you change that user ID, the list of subscriptions is likely to change as well. Below the subscription is a dropdown containing all of the currently defined continuous delivery services. By default, a new service is created with some default settings, but you can change those values by clicking on the Edit link, causing Figure 37-3 to be displayed.
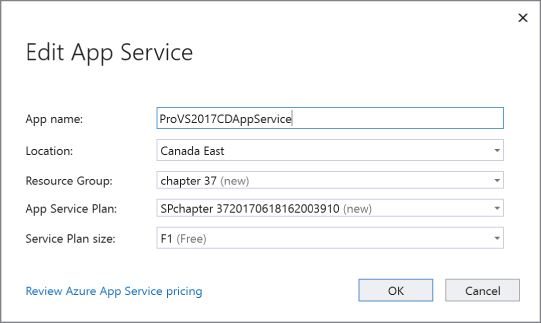
Here you can define the name of the service (useful for being able to know what functionality the service is related to as you manage it through the Azure portal), the location in which the service will be created, the resource group into which the service will be placed, the name of the app service plan, and the pricing tier that you will use for the service. The different tiers provide different build speeds, depending on the complexity of the projects being built.
When all of this information is configured to suit your needs, click on the OK button on the Configure Continuous Delivery dialog to start the creation of the pipeline. You will see output similar to what is shown in Figure 37-4 if your creation process is successful. The most common reason for failure, at least in my experience, is that the creation process doesn’t like it if your repository contains any spaces it in. So take that into consideration as you name your repository.

Heads Up Code Analysis
One of the main tenets of continuous integration and continuous delivery is to deliver information about the quality of the build and release pipeline to the appropriate people as quickly as possible. A second and even more important tenet is to take steps to ensure that the quality of the codebase is maintained with each commit. One of the tools that the Continuous Delivery Tools provides to assist with both of these is Heads Up Code Analysis.
You can find the Heads Up Code Analysis data on the Changes tab within the Team Explorer (see Figure 37-5).

You’ll notice that there is a Build & Code Analysis Results section. Here you will find information related to the most recent build or code analysis run. If there are build errors or warnings, you’ll see the information in the Errors and Warnings label. If the build is completely clean and you have configured code analysis to run automatically, then the warnings and messages associated with that analysis will appear. Alternatively, you can run the code analysis portion manually by clicking on the Refresh Analytics link. If you click on the View Issues link, you are taken to the Error List where detailed information about the items can be found.
The rules that are used in the code analysis process are defined separately from this page. You access the configuration details through the Analyze ➪ Configure Code Analysis menu. There you can set up the code analysis properties for either the current project or the entire solution. Figure 37-6 shows the form used for the entire solution.

Each of the projects in the solution appears on the form. Next to each project you can identify the rule set that is used when code analysis is performed. Figure 37-6 shows the rules that are available out of the box. But you can install additional rule sets through the Extensions and Updates dialog, or you can create your own custom rule sets built to fit the needs of your organization.
Automatic Build Notifications
One of the things that happened when you configured Continuous Delivery is that you defined a default build for your project. The build performs a compilation of all of the projects in your solution and is automatically triggered every time you commit your code to source control. Not only does the build compile your solution, but if you have associated your project with an Azure App Service, it will automatically deploy the compiled and tested application to Azure.
When the build is completed, again believing that getting information to you quickly is important, a popup message appears at the bottom of the Visual Studio IDE (see Figure 37-7).
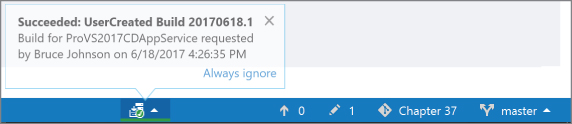
This popup contains the name of the build, who requested the build, and the ultimate state of the build (that is, whether it succeeded or failed). You’ll also notice the icon that appears in the status bar at the bottom. At the moment, there is a green checkmark. This indicates that the last build for this solution was successful. If the last build had failed, then a red “X” appears. The purpose is to let you know what the state of the code in source control is at that moment. This matters because the typical rhythm for a developer is to finish coding a feature, run the unit tests locally to make sure everything passes, get the latest version of the solution from source control (performing any merges that are required), run the tests again, and then commit their changes. If the current state of the build is red (otherwise known as “broken”), then you won’t be able to retrieve the latest version of the source code and successfully run your tests, and your code won’t compile either.
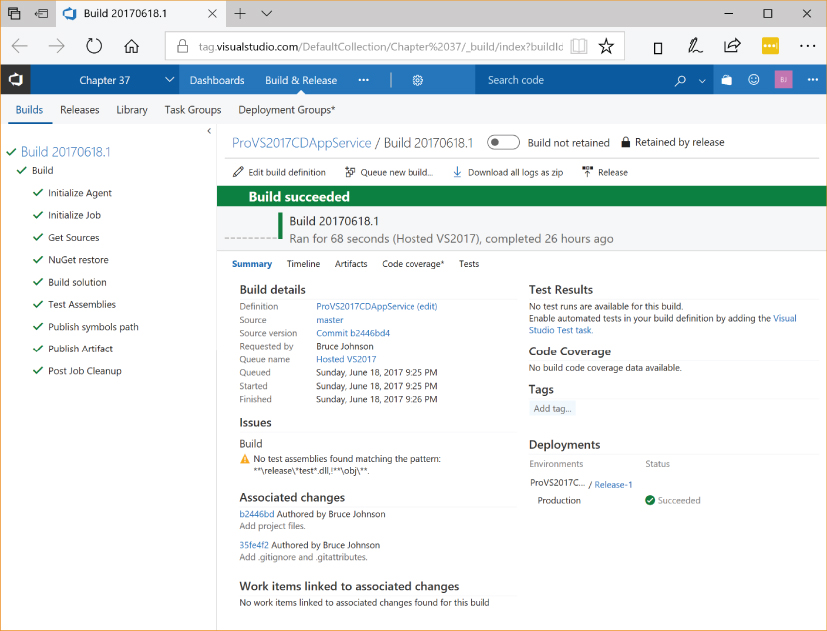
From that same icon, you have a couple of options available to you. You can configure continuous delivery (usually used only if you haven’t already configured it in the past) or you can go to the details of the last build. Choosing that second option takes you to the web page that contains the result of the build, as seen in Figure 37-8.
If you’re interested in viewing or modifying the build that is performed, it is accessible through a couple of paths, but, ultimately, you need to be on the Team Services web site. In Figure 37-8, there is an Edit Build Definition link that can be used, or if you are within Visual Studio, go to the Team Explorer window and get to the Builds tab (Figure 37-9).

At the bottom of the window, there is a list of defined builds for this repository. Right-click on the desired build and select the Edit Build Definition option. This launches the Team Services web site and takes you to the build definition (Figure 37-10).

SUMMARY
This chapter defined some of the more common terms related to continuous integration and delivery. As well, it showed you how to configure continuous delivery for your project and described the tools that are available to you to help keep you informed of the status of your project and the build and release pipeline without needing to leave Visual Studio 2017.