4
The Visual Studio Workspace
THE CODE EDITOR
As a developer you’re likely to spend a considerable portion of your time writing code, which means that knowing how to tweak the layout of your code and navigating it effectively are particularly important. The Windows Presentation Foundation (WPF)-based code editor provides numerous features, including navigating, formatting, using multiple monitors, creating tab groups, searching, and more.
The Code Editor Window Layout
When you open a code file for editing, you are working in the code editor window, as shown in Figure 4-1. The core of the code editor window is the code pane in which the code displays.
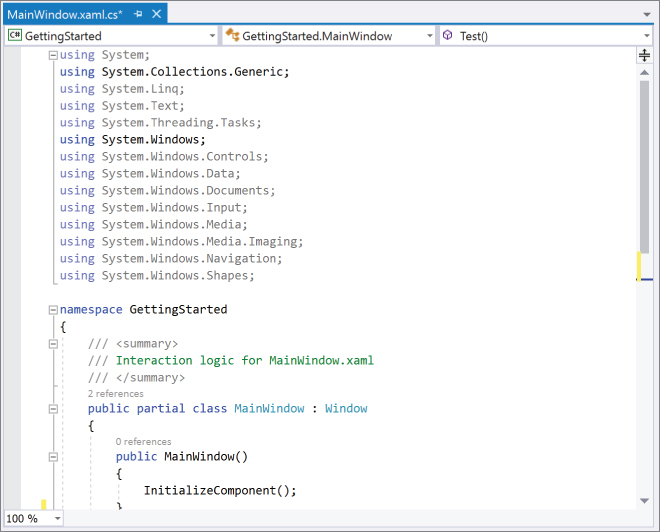
Above the code pane are three drop-down lists that can help you navigate the code file. Known as the Navigation Bar, it can be turned on or off through the Text Editor ➪ All Language ➪ General node of the Options dialog (Tools ➪ Options). Or you can turn it on and off for individual languages.
The first drop-down lists the projects in which the file can be found. This capability is present to support the shared file functionality that Visual Studio offers. The second drop-down contains the different classes defined in the code file, and the third one lists the members of the class selected in the second drop-down. These are listed in alphabetical order, making it easier to find a method or member definition within the file.
As you modify the code in the code editor window, lines of code that you’ve modified since the file has been opened are marked in the left margin — yellow for unsaved changes and green for those that have been saved.
Regions
Effective class design usually results in classes that serve a single purpose and are not overly complex or lengthy. However, there will be times when you have to implement so many interfaces that your code file will become unwieldy. In this case, you have a number of options, such as partitioning the code into multiple files or using regions to condense the code, thereby making it easier to navigate.
The introduction of partial classes (where the definition of a class can be split over two or more files) means that at design time you can place code into different physical files representing a single logical class. The advantage of using separate files is that you can effectively group all methods that are related; for example, methods that implement an interface. The problem with this strategy is that navigating the code then requires continual switching between code files.
An alternative is to use named code regions to condense sections of code that are not currently in use. In Figure 4-2 you can see that two regions are defined, called Constructor and Event Handlers. Clicking the minus sign next to #region condenses the region into a single line and clicking the plus sign expands it again.

Outlining
In addition to regions that you have defined, you have the ability to auto-outline your code, making it easy to collapse methods, comments, and class definitions. Auto-outlining is enabled by default, but if it’s not enabled you can enable it using the Edit ➪ Outlining ➪ Start Automatic Outlining menu item. Before you get freaked out, you won’t see this menu item if automatic outlining is enabled. Instead, you’ll see a Stop Outlining menu item.
Figure 4-3 shows four condensable regions. One is a defined region called Constructor; however, there are also three other automatic regions, outlining the class, the XML comments, and the constructor method (which has been collapsed). Automatic outlines can be condensed and expanded in the same way as regions you define manually.

The Edit ➪ Outlining menu provides a number of commands to help in toggling outlining, such as collapsing the entire file to just method/property definitions (Edit ➪ Outlining ➪ Collapse to Definitions) and expanding it to display all collapsed code again (Edit ➪ Outlining ➪ Toggle All Outlining). The other way to expand and condense regions is via the keyboard shortcut Ctrl+M, Ctrl+M. This shortcut toggles between the two layouts.
Code Formatting
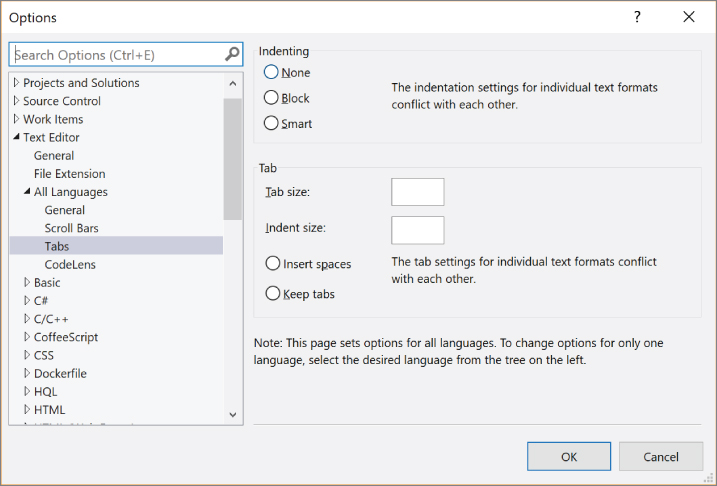
By default, Visual Studio 2017 assists you in writing readable code by automatically indenting and aligning. However, it is also configurable so that you can control how your code is arranged. Common to all languages is the ability to control what happens when you create a new line. In Figure 4-4 you can see that there is a Tabs node under the Text Editor ➪ All Languages node of the Options dialog. Setting values here defines the default value for all languages, which you can then overwrite for an individual language using the Basic ➪ Tabs node (for VB.NET), C# ➪ Tabs, or other language nodes.
By default, the indenting behavior for both C# and VB.NET is smart indenting, which will, among other things, automatically add indentation as you open and close enclosures. Smart indenting is not available for all languages, in which case block indenting is used.
Visual Studio’s Smart Indenting does a good job of automatically indenting code as it is written or pasted into the code editor, but occasionally you can come across code that has not been properly formatted, making it difficult to read. To have Visual Studio reformat the entire document and set the brace locations and line indentations, select Edit ➪ Advanced ➪ Format Document or press Ctrl+K, Ctrl+D. To reformat just the selected code block, select Edit ➪ Advanced ➪ Format Selection or press Ctrl+K, Ctrl+F.
When writing code, to indent an entire block of code one level without changing each line individually, simply select the block and press Tab. Each line has a tab inserted at its start. To unindent a block one level, select it and press Shift+Tab.
Navigating Forward/Backward
As you move within and between items, Visual Studio 2017 tracks where you have been, in much the same way that a web browser tracks the sites you have visited. Using the Navigate Forward and Navigate Backward items from the View menu, you can easily go back and forth between the various locations in the project that you have changed. The keyboard shortcut to navigate backward is Ctrl+−. To navigate forward again it is Ctrl+Shift+−.
Additional Code Editor Features
The Visual Studio code editor is rich with far more features than we can cover in depth here. However, here are a few additional features that you may find useful.
Reference Highlighting
Another great feature is reference highlighting, also known as Code Lens. All uses of the symbol (such as a method or property) under the cursor within its scope are highlighted (as shown in Figure 4-5). This makes it easy to spot where else this symbol is used within your code. You can easily navigate between the uses by Ctrl+Shift+Up/Down.

Code Zooming
You can use Ctrl+Mouse Wheel to zoom in and out of your code (effectively making the text larger or smaller). This feature can be especially useful when presenting to a group to enable the people at the back of the audience to see the code being demonstrated. The bottom-left corner of the code editor also has a drop-down enabling you to select from some predefined zoom levels.
Word Wrap
You can turn on word wrap in the code editor from the options. Go to Tools ➪ Options, expand the Text Editor node, select the All Languages subnode, and select the Word Wrap option. You can also choose to display a return arrow glyph where text has been wrapped by selecting the Show Visual Glyphs for Word Wrap option below the Word Wrap option.
You can turn this on for the current project by selecting Edit ➪ Advanced ➪ Word Wrap.
Line Numbers
To keep track of where you are in a code file, you may find it useful to turn on line numbers in the code editor (as shown in Figure 4-6). To turn line numbers on, go to Tools ➪ Options, expand the Text Editor node, select the All Languages subnode, and select the Line Numbers option.

Visual Studio 2017 includes a code editor feature named the Heads Up Display. In Figure 4-6, notice the small bit of text above the class declaration and the method signature (2 references and 0 references, respectively, along with information about how many uncommitted changes have been made, if this code has been checked into source control). This text indicates the number of times that the class or method is referenced elsewhere in the project.
If you click the text, a pop-up window displays (an example is shown in Figure 4-7) that includes some useful details about the references. This includes the file names and line numbers where the references are found.
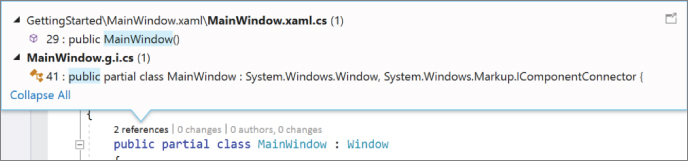
If you double-click one of the references, that file opens up in the editor window and the cursor is placed on the line that references the method or class. Just hovering your mouse over a reference causes a pop-up window to display; the window contains not just the line you’re hovering over, but also the two or three lines before and after it, which enables you to see a little more detail about the reference without navigating directly to the file.
Auto Brace Complete
Auto Brace Complete is a popular feature that automatically adds the closing parenthesis, quote, brace, and bracket for you as you type code into the editor. The completions themselves are language aware, so that, for example, comments in C++ will autocomplete, yet the same keystrokes typed into a C# editor will not.
Split View
Sometimes you want to view two different parts of the same code file at the same time. Split view enables you to do this by splitting the active code editor window into two horizontal panes separated by a splitter bar. These can then be scrolled separately to display different parts of the same file simultaneously (as shown in Figure 4-8).

To split a code editor window, select Split from the Window menu. Alternatively, drag the handle directly above the vertical scrollbar down to position the splitter bar.
Drag the splitter bar up and down to adjust the size of each pane. To remove the splitter simply double-click the splitter bar, or select Remove Split from the Window menu.
Tear Away (Floating) Code Windows
If you have multiple monitors, a great feature is the ability to “tear off” or float code editor windows (and tool windows) and move them outside the main Visual Studio IDE window (as shown in Figure 4-9), including onto another monitor. This allows you to make use of the extra screen real estate that having multiple monitors provides by enabling multiple code editor windows to be visible at the same time over separate monitors. It is also possible to place these floating windows onto a “raft” so that they can be moved together (as shown in Figure 4-10). To tear off a window, make sure it has the focus, and then select Float from the Window menu. Alternatively, right-click the title bar of the window and select Float from the drop-down menu, or simply click and drag the tab for that window (effectively tearing it away from its docked position) and position it where you want it to be located.
You may find halving the code editor window in Split view (discussed in the previous section) to view different parts of a file at the same time too much of a limited view, so you might want to use the floating code windows feature instead to open another code editor window for the same file, and place it, say, on a different screen (if you have a multiple monitor setup). The trick to doing this (because double-clicking the file again in the Solution Explorer simply activates the existing code editor window instance for that file) is to select New Window from the Window menu. This opens the file currently being viewed in another window, which you can then tear away and position as you please.
Duplicating Solution Explorer
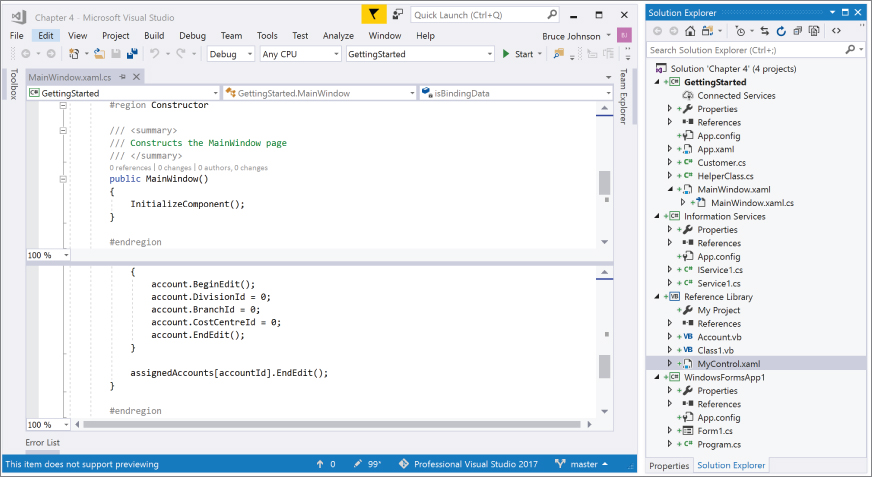
If you work in a multi-monitor environment, a limitation in early versions of Visual Studio was that only one copy of Solution Explorer was available. In Visual Studio 2017, this limitation does not exist. Right-click one of the elements in the Solution Explorer and select New Solution Explorer View. When clicked, a new floating Solution Explorer window is created. This window can be moved around, just like the windows previously described. Figure 4-11 illustrates the newly created Solution Explorer.

Creating Tab Groups
If you don’t have the privilege of having more than one monitor, it is still possible to view more than one code editor window at the same time. You do this by creating tab groups and tiling these groups to display at the same time. As their name would indicate, a tab group is a group of code editor window tabs, with each tab group appearing in a separate tile. Multiple tab groups can be created, limited only by the amount of screen real estate they occupy. You can choose to tile the tab groups vertically or horizontally; you cannot use a mix of the two.
To start this process, you drag a tab below or beside an existing one and dock it to achieve the same effect. This starts a new tab group and creates a tile for it (as shown in Figure 4-12).

You can drag tabs between tab groups or move them between tab groups using Window ➪ Move to Next Tab Group and Window ➪ Move to Previous Tab Group. These options are also available from the drop-down menu when right-clicking a tab.
To restore the user interface to having a single tab group again, move the tabs from the new tab groups back into the original one again and the tiling will be removed.
Advanced Functionality
To be a truly productive developer, it can help to know various advanced features available in the code editor that are hidden away but can save you a lot of time. Here are some of the most useful commands that aren’t immediately obvious within the code editor.
Commenting/Uncommenting a Code Block
Often you need to comment or uncomment a block of code, and you don’t want to have to add/remove the comment characters to/from the start of each line, especially when there are many lines in the block. Of course, in C# you could wrap the block of code between a /* and */ to comment it out, but this type of comment isn’t available in Visual Basic, and it can be problematic in C# when commenting out a block that already contains a comment using this style.
Visual Studio provides a means to comment/uncomment a block of code easily, by selecting the block and then selecting Edit ➪ Advanced ➪ Comment Selection to comment it out, or selecting Edit ➪ Advanced ➪ Uncomment Selection to uncomment it.
The easiest way to access these commands (you are likely to use these often) is via their shortcuts. Press Ctrl+K, Ctrl+C to comment a block of code, and Ctrl+K, Ctrl+U to uncomment it. The Text Editor toolbar is another simple means to access these commands.
Block Selection
Also known as box selection, column selection, rectangle selection, or vertical text selection, block selection is the ability to select text in a block (as shown in Figure 4-13) instead of the normal behavior of selecting lines of text (stream selection). To select a block of text, hold down the Alt key while selecting text with the mouse, or use Shift+Alt+Arrow with the keyboard. This feature can come in handy when, for example, you have code lined up and want to remove a vertical portion of that code (such as a prefix on variable declarations).
Multiline Editing
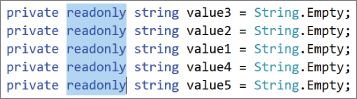
Multiline editing extends the abilities of block selection. With block selection, after selecting a vertical block of text you can only delete, cut, or copy the block. With multiline editing you can type after selecting a vertical block of text, which will replace the selected text with what’s being typed on each line, as shown in Figure 4-14. This can be handy for changing a group of variables from readonly to const, for example.

The Clipboard Ring
Visual Studio keeps track of the last 20 snippets of text that have been copied or cut to the clipboard. To paste text that was previously copied to the clipboard but overwritten, instead of the normal Ctrl+V when pasting, use Ctrl+Shift+V. Pressing V while holding down Ctrl+Shift cycles through the entries.
Full-Screen View
You can maximize the view for editing the code by selecting View ➪ Full Screen, or using the Shift+Alt+Enter shortcut. This effectively maximizes the code editor window, hiding the other tool windows and the toolbars. To return to the normal view, press Shift+Alt+Enter again, or click the Full-Screen toggle button that has been added to the end of the menu bar.
Go to Definition
To quickly navigate to the definition of the class, method, or member under the cursor, right-click and select Go to Definition, or simply press F12.
Find All References
You can find where a method or property is called by right-clicking its definition and selecting Find All References from the drop-down menu, or placing the cursor in the method definition and pressing Shift+F12. This activates the Find All References window (see Figure 4-15) and displays the locations throughout your solution where that method or property is referenced.

The Find All References window has significantly changed in Visual Studio 2017. Where the references used to be in a flat list, you now have the ability to see them in a hierarchy. And you can change the default of Project then Definition by selecting one of the choices in the Group By combo box at the top center of the window. Or you can create your own grouping by right-clicking the results and using the Grouping option in the context menu.
You can then double-click a reference in the results window to navigate to that result in the code editor window. Or, if you just need to see a glimpse of the context for the reference, you can hover over the reference and the code around the reference appears as a tooltip.
CODE NAVIGATION
Microsoft takes the view that Visual Studio is a productivity tool for developers rather than being only a place where code is edited. For this reason, there are a large number of features targeted at helping developers do common tasks faster. Visual Studio 2017 focuses on helping developers understand and discover code more effectively. This section goes over these features and how they might best be used.
Peek Definition
As you investigate code, there is frequently a need to quickly check on an invoked method. When you right-click the method and select Go to Definition from the context menu, the file containing the method opens and the method appears in the code editor. However, the file you were editing is no longer in focus. Although this is definitely not an insurmountable problem, it is an inconvenience.
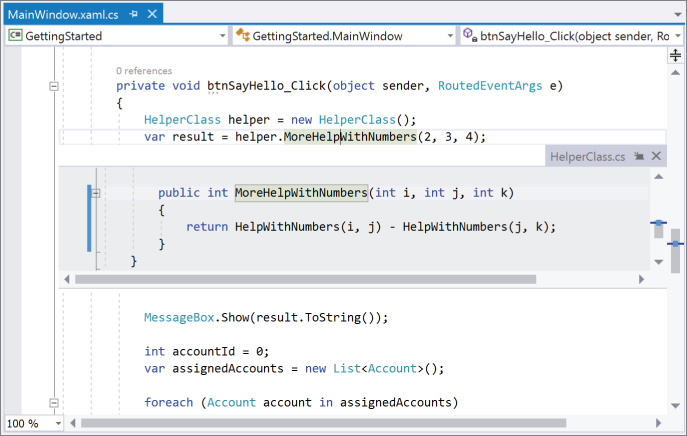
The Peek Definition command enables developers to view the definition of a method without leaving their current editing context. Right-click the method as before, but select the Peek Definition option from the context menu. As shown in Figure 4-16, the method definition is visible, and a blue bar on the left side indicates the location of the method within the visible code.
Aside from allowing you to view the code, Peek Definition enables you to edit the code while you peek at it. And, while you hover over a method in the peek window, you can right-click and select Peek Definition to drill down into that method. When you are more than one level deep, a collection of blue and white circles appears (see Figure 4-17). Clicking on the circles enables you to easily navigate backward and forward through the call hierarchy.

Finally, if you want to promote the peeked file to the main editor window, there is a Promote to Document icon just to the right of the file name on the Peek Window tab.
Enhanced Scrollbar
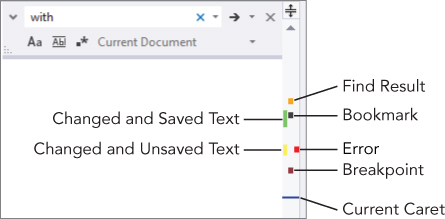
The enhanced scrollbar, with its visual cues that provide information about the file that you are editing, is a very popular productivity tool. The visual cues include the location of errors and warnings, breakpoints, bookmarks, and search results. Figure 4-18 illustrates some of the different markers on the enhanced scrollbar.
The scrollbar in Visual Studio 2017 includes the Map mode feature, which is turned off by default. To enable it, you go to the Text Editor ➪ All Languages ➪ Scroll Bars node in the Tools ➪ Options dialog box, as shown in Figure 4-19. This particular node controls Map mode for every language. However, Map mode can be turned on or off for each language by going into the Scroll Bars node within the specific language.
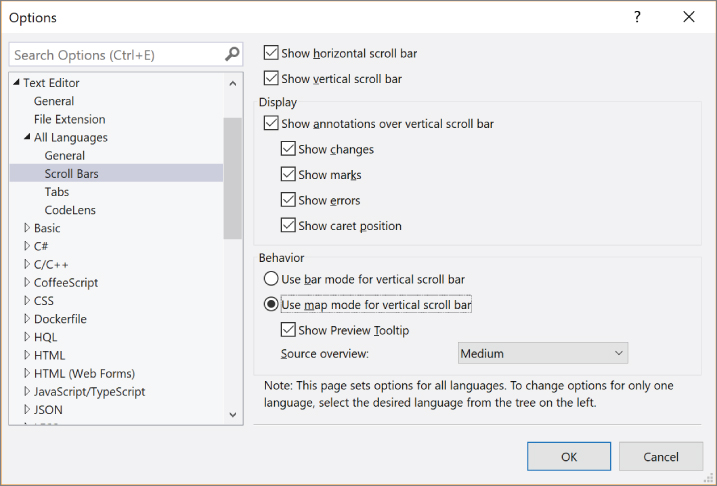
In the Behavior section, a radio button allows you to toggle between the Vertical Scrollbar mode and the Map mode. When Map mode is enabled, you can also configure the preview tooltip and specify the size of the source code map (which also works out to be how wide the scrollbar is). Figure 4-20 shows the toolbar with all of these functions enabled.

A subtle feature is that Map mode is used wherever the code editor scrollbar exists. This includes the scroll bar in the Peek Definition screen.
The source code map is intended to provide a high-level, visual representation of the code that is being edited. You are not supposed to be able to make out the code itself — only the shape of the code is discernible. The intent is for this shape to assist you as you navigate through the file.
You can also see a preview tip. As you move your mouse up and down along the scrollbar (not click-dragging the mouse, but just hovering), a tooltip window appears that shows a preview of the code at the point where your mouse is (see Figure 4-21).

The idea behind the preview feature is to enable you to quickly recognize the code you are looking for without needing to scroll through the entire code window. Experientially, it works well for determining if your mouse is hovering over the part of the code you want to edit next. It is not really useful (nor is it intended to be) if you are looking for a particular variable or function. There are better ways to navigate through the code file for that purpose.
The capability to click to scroll is inherent in the preview window. As you are hovering over the different parts of your code file, you can change the view of the entire code window by clicking; for example, instead of moving the scrollbar handle up and down, you can click the position in the file you want to move to.
Structure Visualizer
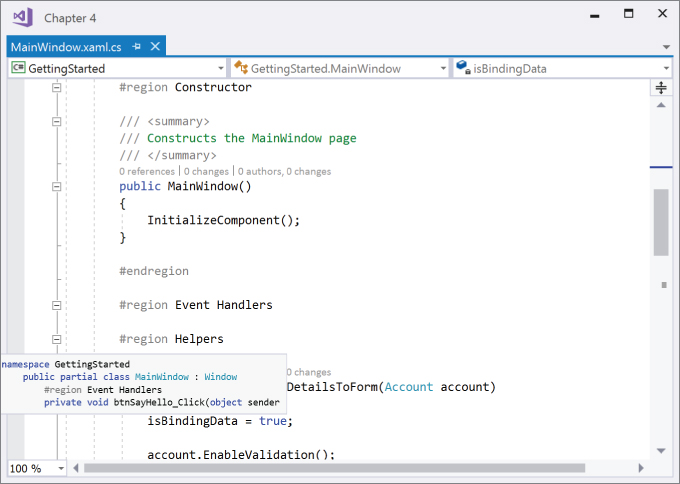
On the opposite side of the code editor is the Structure Visualizer. This was a favorite feature from the Productivity Power Tools (a set of extensions to Visual Studio designed to improve the productivity of developers), and it has now been added to Visual Studio 2017. As you can see in Figure 4-22, there are a couple of faint, dotted vertical lines to the left of the code and to the right of the region expanders. There is one line for each level of contextual hierarchy in the code. For instance, in this example, the leftmost line is the namespace, the second line is the class and the third line is the method. When you hover over the line, the definition for all of the elements in the hierarchy (include any regions) appears as a tool tip. The goal of this feature is to give you an at-a-glance look at exactly where the code falls within the namespace/class/method hierarchy.
Navigate To
The design of the interface for Navigate To is intended to keep you “in the flow,” that is, among other things, to avoid forcing your hands to leave the keyboard. When you strike the appropriate keyboard chord (Ctrl+, is the default, but if that doesn’t work the Edit ➪ Navigate menu option is available), a small window appears in the top-right corner of the editor window, as shown in Figure 4-23.

As you start to type, Visual Studio uses a semantic search to display a list of matches. (In other words, instead of a straight text search, Visual Studio uses its understanding of the classes and methods in your code project as a relevancy guide.) Based on previous telemetry, the first item is the one you most commonly looked for previously, so it is automatically selected and the corresponding file appears as a preview. If you select another file (either by using the cursor or the mouse), that file is displayed in the preview tab. The Escape key closes the navigation window and puts you back to your original position.
At the top of the NavigateTo dialog is a toolbar that allows you to perform some basic filtering on the results. For instance, you can restrict the displayed items to Files, Symbols, Members, or Types. As well, you can modify the scope of the search so that it is limited to the current document or includes not just the current solution but also external dependencies. There is also a gear icon that lets you modify some settings for the Navigate To functionality. For instance, you can make the window appear in the top center instead of the top right. And you can toggle whether the Preview window is used when you click on an item.
THE COMMAND WINDOW
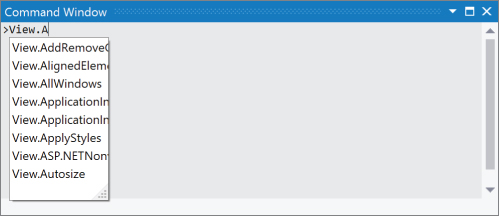
As you become more familiar with Visual Studio 2017, you will spend less time looking for functionality and more time using keyboard shortcuts to navigate and perform actions within the IDE. One of the tool windows that is often overlooked is the Command window, accessible via View ➪ Other Windows ➪ Command Window (Ctrl+Alt+A). From this window you can execute any existing Visual Studio command or macro, as well as any additional macros you may have recorded or written. Figure 4-24 illustrates the use of IntelliSense to show the list of commands that can be executed from the Command window. This list includes all macros defined within the current solution.
A full list of the Visual Studio commands is available via the Environment ➪ Keyboard node of the Options dialog (Tools ➪ Options). The commands all have a similar syntax based on the area of the IDE that they are derived from. For example, you can open the debugging output window (Debug ➪ Windows ➪ Output) by typing Debug.Output into the Command window.
The commands fall into three rough groups. Many commands are shortcuts to either tool windows (which are made visible if they aren’t already open) or dialogs. For example, File.NewFile opens the new file dialog. Other commands query information about the current solution or the debugger. Using Debug.ListThreads lists the current threads, in contrast to Debug.Threads, which opens the Threads tool window. The third type includes those commands that perform an action without displaying a dialog. This would include most macros and a number of commands that accept arguments. (A full list of these, including the arguments they accept, is available within the MSDN documentation.) There is some overlap between these groups: For example, the Edit.Find command can be executed with or without arguments. If this command is executed without arguments, the Find and Replace dialog displays. Alternatively, the following command finds all instances of the string MyVariable in the current document (/d) and places a marker in the code window border against the relevant lines (/m):
>Edit.Find MyVariable /m /d
Although there is IntelliSense within the Command window, you may find typing a frequently used command somewhat painful. Visual Studio 2017 has the capability to assign an alias to a particular command. For example, the alias command can be used to assign an alias, e?, to the Find command used previously:
>alias e? Edit.Find MyVariable /m /d
With this alias defined you can easily perform this command from anywhere within the IDE: Press Ctrl+Alt+A to give the Command window focus, and then type e? to perform the find-and-mark command.
You will have imported a number of default aliases belonging to the environment settings when you began working with Visual Studio 2017. You can list these using the alias command with no arguments. Alternatively, if you want to find out what command a specific alias references, you can execute the command with the name of the alias. For example, querying the previously defined alias, e?, would look like the following:
>alias e?
alias e? Edit.Find SumVals /m /doc
Two additional switches can be used with the alias command. The /delete switch, along with an alias name, removes a previously defined alias. If you want to remove all aliases you may have defined and revert any changes to a predefined alias, you can use the /reset switch.
THE IMMEDIATE WINDOW
Quite often when you write code or debug your application, you want to evaluate a simple expression either to test a bit of functionality or to remind yourself of how something works. This is where the Immediate window comes in handy. This window enables you to run expressions as you type them. Figure 4-25 shows a number of statements — from basic assignment and print operations to more advanced object creation and manipulation.
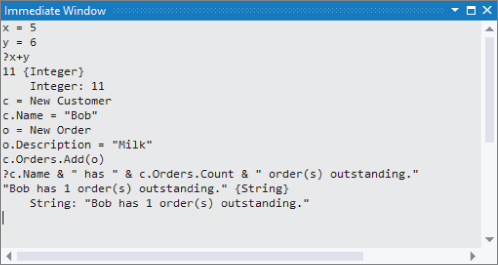
The Immediate window supports a limited form of IntelliSense, and you can use the arrow keys to track back through the history of previous commands executed. Variable values can be displayed by means of the Debug.Print statement. Alternatively, you can use its ? alias. Neither of these is necessary in C#; simply type the variable’s name into the window, and press Enter to print its value.
When you execute a command in the Immediate window while in Design mode, Visual Studio will build the solution before executing the command. If your solution doesn’t compile, the expression cannot be evaluated until the compilation errors are resolved. If the command execute code has an active breakpoint, the command will break there. This can be useful if you work on a particular method that you want to test without running the entire application.
You can access the Immediate window via the Debug ➪ Windows ➪ Immediate menu or the Ctrl+Alt+I keyboard chord, but if you work between the Command and Immediate windows, you may want to use the predefined aliases cmd and immed, respectively.
THE CLASS VIEW
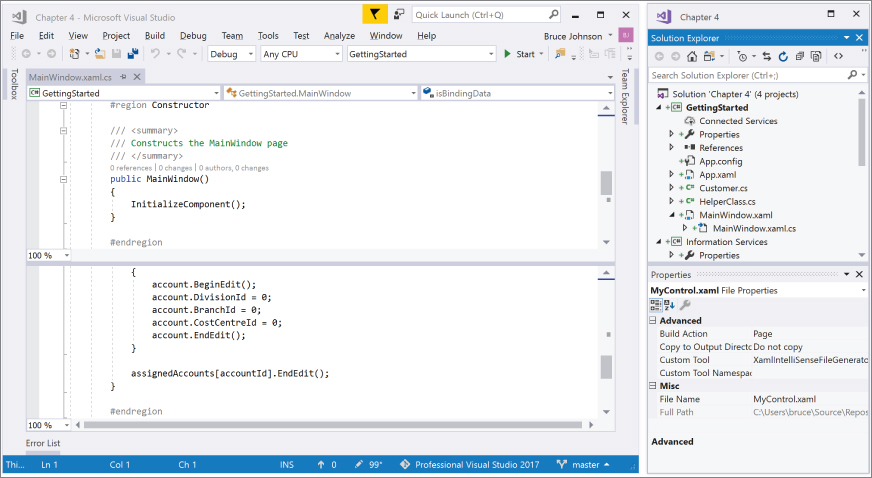
Although the Solution Explorer is probably the most useful tool window for navigating your solution, it can sometimes be difficult to locate particular classes and methods. The Class view tool window provides you with an alternative view of your solution that lists namespaces, classes, and methods so that you can easily navigate to them. Figure 4-26 shows a simple Windows application that contains a single form (MainWindow), which is selected in the class hierarchy. Note that there are two GettingStarted nodes. The first is the name of the project (not the assembly as you might expect), and the second is the namespace that MainWindow belongs to. If you were to expand the Project References node you would see a list of assemblies that this project references. Drilling further into each of these would yield a list of namespaces, followed by the classes contained in the assembly.

In the lower portion of Figure 4-26, you can see the list of members that are available for the class MainWindow. Using the right-click shortcut menu, you can filter this list based on accessibility, sort and group the list, or use it to navigate to the selected member. For example, clicking Go to Definition on InitializeComponent() would take you to the MainWindow.xaml.cs file.
The Class view is useful for navigating to generated members, which are usually in a file hidden in the default Solution Explorer view (such as the designer file in the previous example). It can also be a useful way to navigate to classes that have been added to an existing file — this would result in multiple classes in the same file, which is not a recommended practice. Because the file does not have a name that matches the class name, it becomes hard to navigate to that class using the Solution Explorer; hence the Class view is a good alternative.
THE ERROR LIST
The Error List window displays compile errors, warnings, and messages for your solution, as shown in Figure 4-27. You can open the Error List window by selecting View ➪ Error List or by using the keyboard shortcut Ctrl+, Ctrl+E. Errors appear in the list as you edit code and when you compile the project. Double-clicking an error in the list opens the file and takes you to the line of code that is in error.

You can filter the entries in the list by toggling the buttons above the list to select the types of errors (Errors, Warnings, and Messages) you want to display. As well, you can filter the list by the process that generated the error or warning. More specifically, some errors are generated by Intellisense, while others are generated when you build the project. You can configure the window to show errors from one source or the other or both.
THE OBJECT BROWSER
Another way to view the classes that make up your application is via the Object Browser. Unlike most other tool windows, which appear docked to a side of Visual Studio 2017 by default, the Object Browser appears in the editor space. To view the Object Browser window, select View ➪ Object Browser, or use the keyboard shortcut Ctrl+Alt+J (or F2, depending on your keyboard settings). As you can see in Figure 4-28, at the top of the Object Browser window is a drop-down box that defines the object browsing scope. This includes a set of predefined values, such as All Components, different versions of the .NET Framework, and My Solution, as well as a Custom Component Set. Here, My Solution is selected and a search string of started has been entered. The contents of the main window are then all the namespaces, classes, and members that match the search string.

In the top right portion of Figure 4-28, you can see the list of members for the selected class (MainWindow), and in the lower window the full class definition, which includes its base class and namespace information. One of the options in the Browse drop-down is a Custom Component Set. To define what assemblies are included in this set, you can either click the ellipsis next to the drop-down or select Edit Custom Component Set from the drop-down itself.
SUMMARY
In this chapter you have seen a number of tool windows that can help you not only write code but also prototype and try it out. Making effective use of these windows can dramatically reduce the number of times you need to run your application to test the code you are writing. This, in turn, can improve your overall productivity and eliminate idle time spent waiting for your application to run.