To design is to communicate clearly by whatever means you can control or master. | ||
| --Milton Glaser | ||
Complexity is the problem. Ease of use is the solution. Productivity is the result. | ||
| --Unknown | ||
In NAV 2015, Reports and Queries are two ways to extract and output data for the purpose of presentation to a user (Reports can also modify data). Each of these objects uses tools and processes that are NAV based for the data extraction (XMLports, which also can extract and modify data, will be covered in a later chapter). In this chapter, we will focus on understanding the strengths of each of these tools and when and how they might be used. We will cover the NAV side of both Queries and Reports in detail to describe how to obtain the data we need to present to our users. We will cover output formatting and consumption of that data in less detail. There are currently no wizards available for either Query building or Report building; therefore, all the work must be done step by step, using programming tools and our skills as designers/developers. The topics we will cover include the following:
- Queries and Reports
- Report components – overview
- Report data flow
- Report components – detail
- Creating and modifying Reports
Reports have always been available in NAV as a data retrieval tool. Reports have been used to process and/or manipulate the data (through the Insert, Modify, or Delete functions) with the option of presenting the data in a formatted, printable format. Prior to NAV 2013, data selection could only be done using C/AL code or DataItem properties to filter individual tables as datasets (retrieved from the database with simple T-SQL statements generated by the C/AL compiler), and to perform loops to find the data required for the purpose.
The Query object, new in NAV 2013, was created with performance in mind. Instead of multiple calls to SQL to retrieve multiple datasets to then be manipulated in C/AL, Queries allow us to utilize familiar NAV tools to create advanced T-SQL queries.
A NAV developer can utilize the new Query object as a source of data both in NAV and externally. Some external uses include the following:
- As a web service that is cloud compatible
- As a web service source for XML or Odata. Odata is different from XML in that it contains the field definitions and styles along with the data itself
- Feeding data to external reporting tools such as Excel, SharePoint, and SSRS
Internally, NAV Queries can be used as follows:
- A direct data source for Charts
- Providers of data to which Cues (displayed in Role Centers) are bound. See the Help article titled Walkthrough: Creating a Cue Based on a Normal Field and a Query
- As a dataset variable in C/AL to be accessed by other object types (Reports, Pages, Codeunits, and so on). See http://msdn.microsoft.com/en-us/library/hh167210(v=nav.70).aspx for guidance on using the READ function to consume data from a Query object.
Query objects are more limited than the stored procedures of SQL. Queries are more similar to SQL View. Some compromises in the design of the Query functionality were made for better performance. Data manipulation is not supported in Queries. Variables, subqueries, and dynamic elements (such as building a query based on selective criteria) are not allowed within a Query object.
The closest SQL Server objects that Queries resemble are SQL Views. One of the new features that allows for NAV to generate advanced T-SQL statements is the use of SQL Joins. These include the following Join methods:
- Inner: The query compares each row of table A with each row of table B to find all the pairs of rows that satisfy the Join criteria
- Full Outer: It does not require each record in the two Joined tables to have a matching record, so that all records from both table A and table B will appear at least once
- Left Outer Join: Every record from table A will appear at least once, even if a matching record from table B is not found
- Right Outer Join: Every record from table B will appear at least once, even if a matching record from Table A is not found
- Cross Join: It returns the Cartesian product of the sets of rows from tables A and B (the Cartesian product is a set made up of rows that include the columns of each row in table A along with the columns of each row in table B for a number of rows; in other words, it includes the columns of the rows in table A plus those in table B)
Sometimes, it is necessary to quickly retrieve detailed information from one or more ledgers that may contain hundreds of thousands to many millions of records. The Query object is the perfect tool for such a data selection as it is totally scalable and can retrieve the selected fields from multiple tables at once. The following example (using Cronus data) will show the aggregated quantity per bin of the lot-tracked items in stock. This query could be presented to a user by means of either a report or a page.
First, it is necessary to know what inventory is in stock and contains a lot number. This is accomplished using the Item Ledger Entry table. However, the Item Ledger Entry record does not contain any bin information. This information is stored in the Warehouse Ledger Entry table. The Location Code, Item No., and Lot No. are used to match the Item Ledger Entry and Warehouse Ledger Entry records to make sure the correct items are selected. In order to determine which bins are designated as pick bins, the Bin Type records that are marked as Pick = True need to be matched with the bins in Warehouse Ledger Entry. Lastly, Quantity of each Warehouse Entry record needs to be summed according to Location Code, Zone Code, Bin Code, Item No., and Lot No. in order to show the total number of items available in each bin.
The first step is to define the primary DataItem in the Data Source column. The first DataItem is the Item Ledger Entry table. We can either type in the table name or the table number (32). Query may select from multiple tables (as we do in this example). All DataItems except the first must be indented. Each successively indented DataItem must have a link defined to a lesser-indented DataItem (because Union joins are not supported).
After defining the first DataItem, we focus on the first blank line, and Type will default to Column. Column is a field from the DataItem table that will be output as an available field from the Query dataset. The other Type option is Filter, which allows us to use a source column as a filter and does not output this column in the dataset. Use the Lookup arrow or the Field menu to add the two following fields under Item Ledger Entry: Item No. and Lot No..

The next DataItem that we need is the Warehouse Entry table. We must join it to the Item Ledger Entry by filling in the DataItemLink property. Link the Location Code, Item No., and Lot No. fields between the two tables, as shown in the following image:

The following steps will define the rest of the DataItems, Columns, and Filters for this query.
- Select Entry No., Location Code, Zone Code, Bin Code, and Quantity as Columns under Warehouse Entry DataItem.
- Add the
Bintable as the nextDataItem. - Set
DataItemLinkbetweenBinandWarehouse Entryas theBintableCodefield linked to theBin Codefield for the Warehouse Entry table. - Add the Bin Type table as the last
DataItemfor this query. Create aDataItemLink between theBin TypetableCode fieldand theBintableBin Type Codefield. - Set the
DataItemFilterasPick = CONST(Yes)to only show the quantities for bins that are enabled for picking. - For the dataset returned by Query, we only want the total quantity per combination of
Location,Zone,Bin,Item, andLot. ForColumn - QuantityinWarehouse Entry DataItem, set theMethod Typecolumn toTotals. The Method will default toSum, and the columns aboveQuantitywill be marked with Group By checked. This shows the grouping criteria for the aggregation of theQuantityfield:

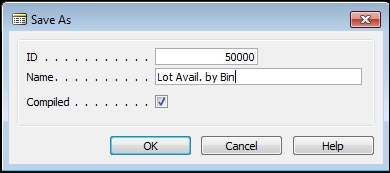
Once DataItems and Columns have been selected, Query can be compiled and saved in the same manner as Tables and Pages are compiled and saved. Number and name the Query object as shown following. Query can be tested simply by highlighting it in Object Designer and clicking on Run:
This query can be utilized internally in NAV 2015 as an indirect data source in a Page or a Report object. Although DataItems in Pages and Reports can only be database tables, we can define Query as a variable and then, use the Query dataset result to populate a temporary Sourcetable. In a page, we define the SourceTableTemporary property to Yes and then, load the table via the C/AL code located in the OnOpenPage trigger, or in a report that we might utilize as a virtual table, such as the Integer table, to step through the Query result.
In our example, we use the Warehouse Entry table to define our temporary table because it contains all the fields of the Query dataset. In the Page Properties, we set the SourceTableTemporary to Yes (if we neglect marking this table as temporary, we are quite likely to corrupt the Warehouse Entry table). In the OnOpenPage trigger, the Query object (LotAvail) is filtered and opened. As long as the Query object has a dataset line available for output, the Query column values can be placed in the temporary record variable and be available for display, as shown in the following image. Because this code is located in the OnOpenPage trigger, the temporary table is empty when this code is executed. If the code were invoked from another trigger, the statement Rec.DELETEALL would be needed at the beginning in order to clear out any previously loaded data from the table:
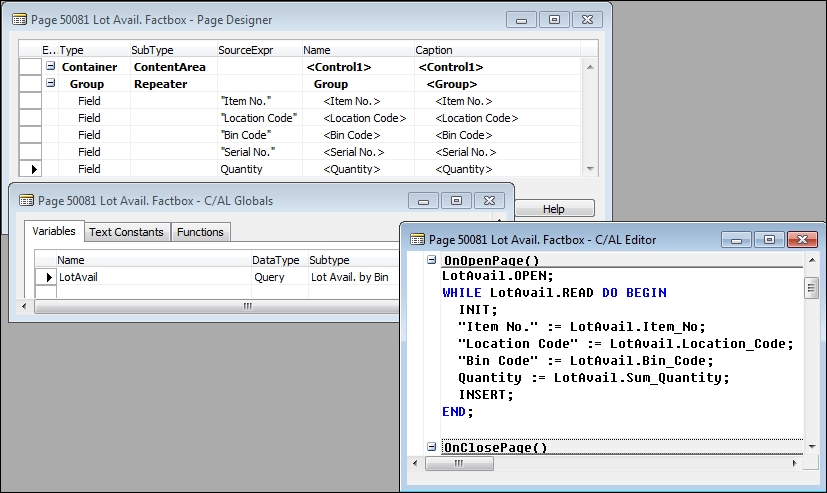
As the Query dataset is read, the temporary record dataset will be displayed on the page as follows:

When Query is used to supply data to Report, Integer DataItem is defined to control stepping through the Query results. Before the report read loop begins, Query is filtered and invoked so that it begins processing. As long as the Query object continues to deliver records, Integer DataItem will continue looping. At the end of the Query output, the report will proceed to its OnPostDataItem trigger processing, just as though it had completed processing a table rather than a Query-created dataset. This approach is a faster alternative to a design that would use several FlowFields, particularly if those FlowFields were only used in one or two periodic reports.
A similar approach to using a Query object to supply data to a report is described in Mark Brummel's Blog Tip #45 at https://markbrummel.wordpress.com/2015/03/24/tip-45-nav2015-report-temporary-property/
There are several Query properties that we should review.
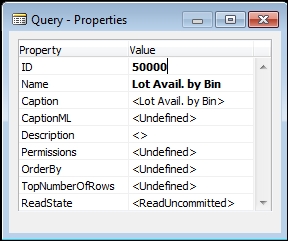
The properties of a Query object can be accessed by highlighting the first empty line and clicking on the Properties icon (or clicking Shift + F4 or View | Properties). The Properties of the Query that we created earlier look like the following:
We'll review three of these properties:
- OrderBy: Provides the capability to define a sort, data column by column, and ascending or descending, giving the same result as if a key were defined for the Query result, but without the requirement for a key.
- TopNumberOfRows: Allows the specification of the number of data rows that will be presented by the Query object. A blank or 0 value shows all rows. Specifying a limit can make the Query object execution complete much faster. This property can also be set dynamically from the C/AL code.
- ReadState: Controls the state (committed or not) of data that is included and the type of lock that is placed on the data read.
Query Line can be one of three types: DataItem, Column, and Filter. Each has its own property set. The Query DataItem properties can be accessed by highlighting a DataItem line and clicking on the Properties icon (or clicking Shift + F4 or View | Properties).

Again, we'll review a selected subset of these properties.
- Indentation: Indicates the relative position of this line within the Query object's data hierarchy. The position in the hierarchy combined with the purpose of the line (data, lookup, or total) determines the sequence of processing within the Query object.
- DataItemLinkType: Can only be used for the subordinate DataItem relative to its parent DataItem; in other words, it only applies to a Query object that has multiple DataItems. There are three value options:
- Use Default Values if No Match: Includes the parent DataItem row, even when there is no matching row in the subordinate DataItem
- Exclude Row if No Match: Skips the parent DataItem row if there is no matching row in the subordinate DataItem
- SQL Advanced Options: Enables another property, the SQLJoinType property
- SQLJoinType: Allows the specification of one of the five different SQL Join Types (Inner, Left Outer, Right Outer, Full Outer, or Cross Join). More information is available in the Help sections titled SQLJoinType Property and SQL Advanced Options for Data Item Link Types.
- DataItemTableFilter: Provides the ability to define filters to be applied to the DataItem.
The following image shows a Column Property screen showing the Quantity Column for our simple Query object (the MethodType and Method properties are used here):
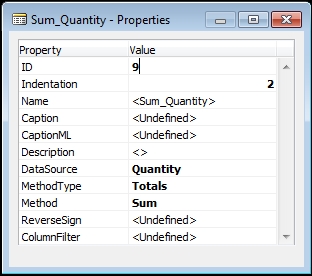
The properties specific to Query Column controls are as follows:
- MethodType: Controls the interpretation of the following Method property. This can be
Undefined/None,Date, orTotals. - Method: Is dependent on the value of the MethodType property:
- If MethodType =
Date, then Method assumes that Column accesses a date value. The value of Method can beDay,Month, orYearand the Query result for Column will be the extracted day, month, or year from the source date data. - If MethodType = Totals, then Method can be Sum, Count, Avg, Min, or Max. The result in Column will be based on the appropriate computation. See the Help section for Method Property for more information
- If MethodType =
- ReverseSign: Reverses the sign of the Column value for numeric data
- ColumnFilter: Allows the application of a filter to limit the rows in the Query result. Filtering here is similar to, but more complicated than, the filtering rules that apply to DataItemTableFilter. Static ColumnFilters can be dynamically overridden and can also be combined with DataItemTableFilters. See the Help section for ColumnFilter Property for more detailed information.