
Because our NAV report layouts will all be developed in SSRB or Visual Studio, our familiarity with NAV C/SIDE will only get us part way to having NAV report development expertise. We've covered most of the basics for the C/SIDE part of NAV report development. Now, we need to dig into the RDLC part. If you are already an SSRB or Visual Studio reporting expert, you will not spend much time on this part of the book. If you know little or nothing about either of these tools, you will need to experiment and practice.
One of the most important learning tools available is experimentation. Report development is one area where experimentation will be extremely valuable. We need to know which report layouts, control settings, and field formats work well and which do not. The best way to find out is by experimentation.
Create a variety of test reports, beginning with the very simple and getting progressively more complex. Document what you learn as you make discoveries. You will end up with your own personal Report Development Help documentation. Once we've created a number of simple reports from scratch, we should modify the test copies of some of the standard reports that are part of the NAV system.
We must always make sure that we are working on test copies, not the originals!
Some reports will be relatively easy to understand, others that are very complex will be difficult to understand. The more we test, the better we will be able to determine which standard NAV report designs can be borrowed for our work and where we will be better off starting from scratch. Of course, we should always check to see whether there is a Pattern that is applicable to the situation on which we are working.
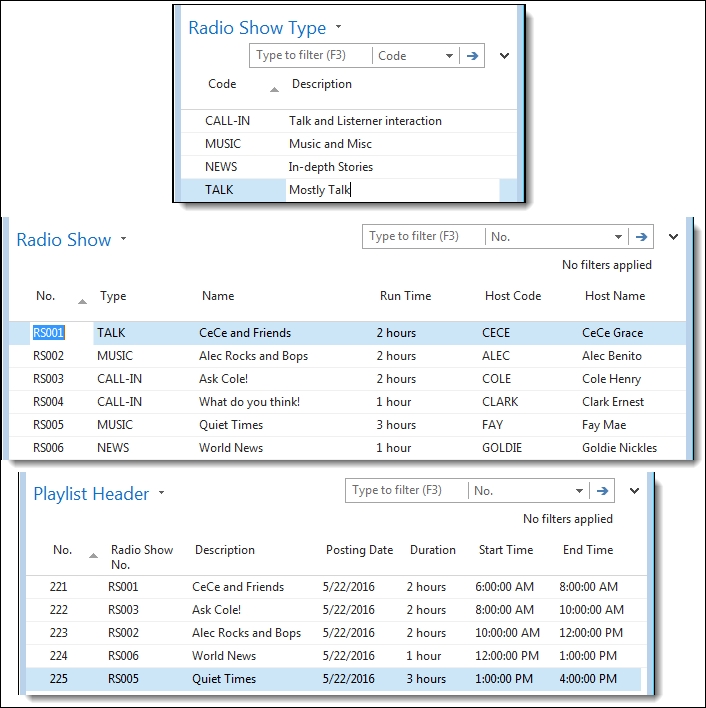
Our goal is to create a report for our WDTU data that will give us a list of all the scheduled radio show instances organized within Radio Show organized by Radio Show Type, as shown in the following screenshot:

The easy way to create the preceding report data structure definition is simply type the letter D in the Data Type column, tab to the Data Source column, enter the target table number (in this case 50001, then 50000, and then 50002) in the Data Source column, drop to the next line, and do it again. Then, save the new report skeleton as Report 50001, Shows by Type.
Before we go any further, let's make sure that we've got some test data in our tables. To enter data, we can either use the pages that we built earlier or, if those aren't done yet, we can just Run the tables and enter some sample data. The specifics of our test data aren't critical.
We simply need a reasonable distribution of data so that our report test will be meaningful. The following is an example minimal set of data:
Since the C/SIDE part of our report design is relatively simple, we can do it as part of our Phase 1 effort. It's simple because as we aren't building any processing logic, we don't have any complex relationships to address. We just want to create a nice, neat, nested list of data.
Our next step is to define the data fields that we want available for processing and output by SSRB. By clicking on the Include Caption column, we can cause the Caption value for each field to be available for use in SSRB. At this point, we should do that for all the data fields. If some are not needed in our layout design, we can later return to this screen and remove the check marks, where unnecessary. Please note that the Name column value will end up as the SSRB dataset field name; to make sure that it is easy to understand, describe what the data is and its source.
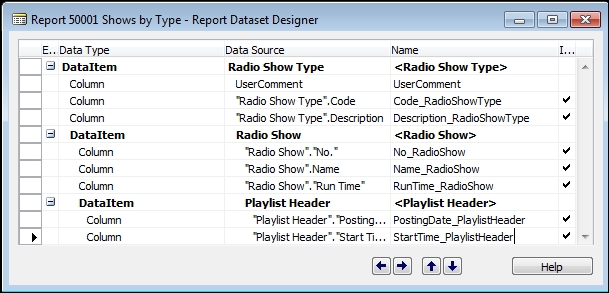
Each of the subordinate nested DataItems must be properly linked to its parent DataItem. Playlist Header DataItem is joined to Radio Show DataItem by the Playlist Header Radio Show No. field and the Radio Show "No." field. Radio Show DataItem is joined to Radio Show Type DataItem by the Radio Show "Type" field and the Radio Show Type "Code" field. The Radio Show portion of the dataset returned is limited by setting PrintOnlyIfDetail to Yes. This will skip the Radio Show record so that it will not be sent to SSRB (if no Playlist Header records are associated with this Radio Show).

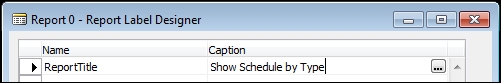
The other data that we can pass from C/SIDE RD to SSRB are the labels. Labels will be used later as captions in the report and are enabled for multilanguage support. Let's create a title label to hand over the fence to SQL Server Report Builder. Go to the View menu, choose Labels to open Report Label Designer. Enter the following label definition:
Now that we have our C/SIDE dataset definition completed, we should save and compile our work before doing anything else. Then, before we begin our SSRB work, it's a good idea to check that we don't have any hidden errors that will get in our way later. The easiest way to do that is just to Run what we have now. What we expect to see is a basic Request Page display allowing us to run an report with no layout defined.
As mentioned earlier, there are several choices of tools to use for NAV report layout development. The specific screen appearance depends somewhat on which tool is being used.
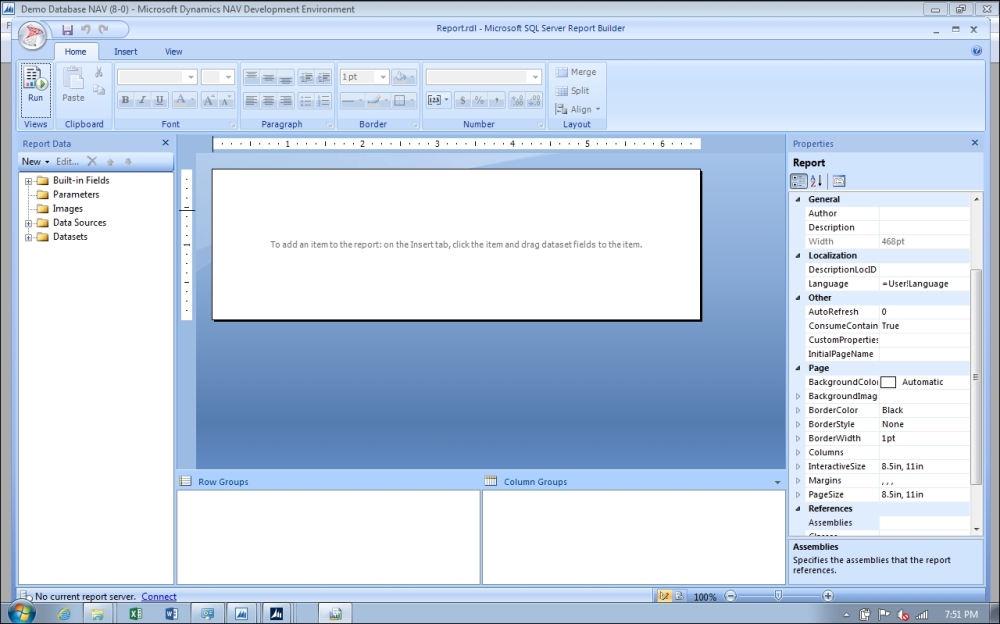
To begin our report development work in SQL Server Report Builder, we must have our C/SIDE dataset definition open in the Design mode. Then, go to View | Layout to open SQL Server Report Builder. If we have previously done SSRB development work on this report and saved it, that work will be displayed in SSRB ready for our next effort. In this case, since we are just starting, we will see the following:
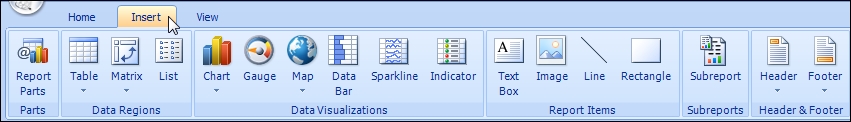
At the top of the screen is a tab labeled Insert. When we click on this tab, the ribbon shown in the next image will be displayed:
Note
Before we start on our sample report SSRB work here, study some of the information on report design in NAV Developer and IT Pro Help. In particular, you should review Walkthrough: Designing a Customer List Report and Walkthrough: Designing a Report from Multiple Tables. These walkthrough scripts will provide additional helpful information.
Since we're going to have a page header, let's start by adding that to our layout. Right-click on the Header icon, and then, click on Add Header. Note that if we want Report Header to appear on each page, we must use the SetData and GetData functions in association with the hidden text boxes (see the Help article titled How to Print Report Header Information on Multiple Pages).

Next, we will add some fields to Page Header. First, we will expand two of the categories in the Report Data panel, which is on the left side of our layout screen. The two categories that we want to expand are Parameters, which contains the Captions that we checked plus any defined Labels, and DataSets, which contains the data elements passed from our C/SIDE RD.

When we expand the DataSet result, we can see the importance of our data field Names being self-documenting. Having done so makes it much easier to remember what we defined in our DataSet and with which DataItems they are associated. This habit will be particularly important when we have multiple fields with the same name from different DataItems (such as Code or Description or Amount).
DataSet represents a record format in which all defined fields are present for all DataItems. This is a classic "flat file" format where the hierarchical data structure has been "flattened" out to make it easier to pass from one environment (NAV) to another (in this case, SQL Server Report Builder).
Now, we will add the report title that we defined as a label earlier in C/SIDE RD. Drag the Report Title field over to the Page Header workspace and position it where we want it to be. Now, expand the Built-in Fields Section in the Report Data panel. We will add some of these fields, such as User ID, Execution Time, and Page Number to our Page Header. We will position these fields wherever we think appropriate.
At this point in time, it would be a good idea to save our work and test to see what we have so far:
- Click on the top-left round graphic icon or the disc icon (or Ctrl + S) to save the design as RDLC.
- Click on the round graphic icon and then the Exit Report Builder button or the X box at the top-left of the screen (or Alt + F4) to return to C/SIDE RD.
- Exit Report Dataset Designer.
- Respond Yes to the The layout of report id 50001 has changed…Do you want to load the changes? Question.
- Then, we'll see a familiar window asking us Do you want to save Report 50001 Shows by Type? Save and compile the report.
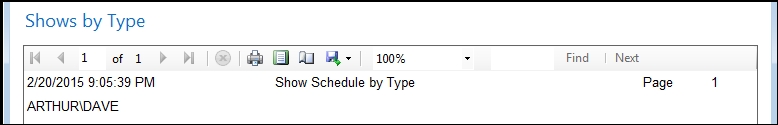
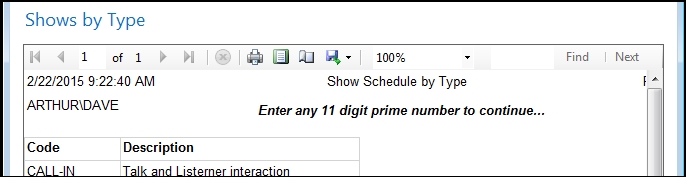
Now, Run the report. The Preview output should look something like the following:

Not particularly impressive, but not bad if this is our first try at creating a NAV 2015 report (By the way, the User name of ARTHURDAVE in the lower right corner of the image is because the authors are running tests on a computer named Arthur with a login of Dave.).
The wrapped report fields show us that we need to make those text boxes wider. This would be a good point to do some experimenting with positioning or adding other heading information such as "Page" in front of the page number. When we highlight a field, the properties of that field are displayed and are available for modification, in the Properties window. A few simple changes and our Report Heading could look like the following:
We could even experiment with various properties of the heading fields, choosing different fonts, the boldface, different colors, etc. Because we only have a small number of simple fields to display (and could recreate our report if we have to do so), this is a good time to learn more about some of the report appearance capabilities that SSRB provides.
Finally, we are ready to layout the data display portion of our Radio Shows by Type report. The first step of this phase is to layout the fields of our controlling DataItem data in such a way that we can properly group the data of the subordinate DataItems.
Once again, Design the report and View | Layout so that the SSRB report layout screen is displayed with the Insert ribbon visible. We are now done with Page Heading, and from here on, all our work will be done in the body of the report design surface.
Click on the List icon in the Insert ribbon and drop a List control into the body of the report design surface. Position the control at the top left of the layout body. Since we're going to define six layout lines to hold the necessary data and header controls, we may want to expand the List control and work area (although this can be done later, as needed).
- Click in the List control so that a shaded area appears on the top and the left of the control.
- Right-click in the shaded area and select Tablix Properties.
- Right-click on the dropdown arrow in the Dataset Name box to set the Dataset name value to DataSet_Result. This causes the List control to reference our incoming NAV data.
- Click OK to save the new Tablix property setting.
- Right-click again in the List control's shaded area and select Row Group and then Group Properties:

- In the Group Properties screen, select the General tab, in the Group expressions area, click on Add, and then in Group on:, select [Code-RadioShowType], because we want our data output grouped by the Type of Radio Show:

- Click OK to return to the report layout design surface. Click on the Table control icon, choose Insert Table, and click in the List control to place the new Table. This will be the container for our Radio Show Type DataItem fields.
The empty control will start with two rows and three columns. Since we're only going to display two data fields (Code and Description), we only need two columns. Highlight the rightmost column (click in the body so that a shaded area appears on the left and the top of the control, then click in the shaded area above the column), right-click (in this shaded area), and chose the Delete Columns option.
Because this section of our report acts as a heading to subordinate sections, we will delete the Data row from the Table control and replace it with a second Header row. Once again, click in the shaded area to highlight the Data row, select the Delete Rows option, respond OK to the confirmation message, highlight the Header row, and insert a second Header row. We now have two rows and two columns of Text boxes (cells) ready for our data.
From the Parameters data list in the Report Data panel, grab the Code_RadioShowTypeCaption and drop it into the top left table cell. Drag the Description_RadioShowTypeCaption and drop it into the top right table cell. Stretch out the cells so the data is likely to fit without wrapping.
Our next step is to place some data fields in the Table control. Click in the lower left cell of the Table control. A field list icon will be displayed. Click on the icon, and we will see all the fields in Dataset_Result.
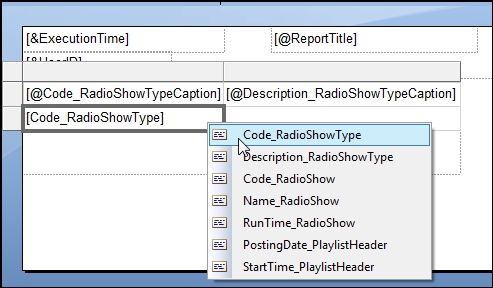
Select Code_RadioShowType for the bottom left cell and Description_RadioShowType for the bottom right cell.
We are at another good point to save and check our work. If you are one of those people who like to do as much as possible from the keyboard, use Ctrl + S (to save RDLC), Alt + F4 (to exit SSRB), Esc (to exit C/SIDE RD), Enter (to load the changed RDLC), Enter (to save and compile), and then Alt + R to Run the report. You'll probably have to use your mouse to respond to Request Page.
Don't worry about the vertical and horizontal layout of our output. We can fix the layout later. We should get as many instances of the Radio Show type printed from our test data as we have Types of entries selected from the Playlist Header table (based on any filters that we applied).
Assuming that our output looks pretty much as we expected (a simple list of Show Types with column headings), we can move on to the next layer of definition. This time we will define how the Radio Show data fields will be shown, including the fact that this set of data is grouped as subordinate to the Type field.
Insert another Table control in to the report design surface inside the list control. Position this control below the last Table control in a position that will show its relation to the Type data records. Usually, this will involve indenting.
Click on the control to cause the shaded outer area to display. Highlight the Header row and delete it. Highlight the Data row, right-click on it, and choose Insert Row – Inside Group (Above or Below doesn't matter this time). Now, to confirm that our List control is associated with the DataSet Result, do the following:
- Right-click in the List control, so that a shaded area appears to the top and the left of the control.
- Right-click in the shaded area and select Tablix Properties.
- The Dataset name box should contain the value DataSet_Result.
- Click OK to save the Tablix property setting.
In the bottom row of our second Table control, cause the field list icon to display, and then choose a field for each of the three cells (No., Show_Description, and Run_Time). In the top row, we could choose Parameter captions as we did earlier, but perhaps, we want captions that are different to those that came across from C/SIDE RD. We could have used Labels here if we had defined them in C/SIDE RD. Or, we can just do the simple thing, type in the column headings we want (Show No., Name, and Run Time), overwriting the default headings (doing this will not yield multilanguage compliant captions). Highlight the middle column (Name) and stretch it out so that a long name will display on one line rather than wrapping. Now, once again, it's time to save and test.
Our third (and final) set of data for this report will hold data from Playlist Header DataItem. Right-click in the grey area of the top row of the second Table control. Select Row Group | Group Properties. In the Group Properties screen, select the General tab, in the Group expressions area, click on Add, and then in Group on:, select [Code-RadioShow], because we want the next set of data output grouped by Radio Show Code. When we return to the layout screen, we will see that the grey area next to the rows for this table will have changed from the data icon to a group brace icon that includes both of what were previously marked as data rows.
Right-click on the grey area for the bottom row, and choose Insert Row | Inside Group – Below. Repeat so that there are now two empty rows at the bottom of the second table area. Fill the rightmost two columns of these two rows. In the top of these two rows, insert captions from the Parameters list for PostingDate and StartTime. In the bottom row, use the field lists to insert data elements for PostingDate and StartTime. The final layout should look similar to the following:

Finally, we save our RDLC code (Ctrl + S), exit SSRB (Alt + F4), exit CSIDE RD (Esc, Enter), and save and compile (Enter). Let's Run our report and see what we've got. While this report is not beautiful, it is serviceable, particularly for the first try. One improvement that we should make before we show it to very many people is to make its formatting more attractive.
A couple of very simple changes would be to make the heading rows bold (to stand out) and format the date and time fields, so they would show properly (not showing as SQL DateTime fields). Some easy ways to do this in the layout screen is as follows:
- Click in a table so that the grey outline displays. Highlight the heading row. Click on the bold icon in the top ribbon. The text for the row should now show bolded.
- Right-click in the cell for the date field. Choose Textbox Properties. From the list of property categories, choose Number and then Date and the preferred Date format. Do essentially the same thing for the time field.
After some minor formatting, the result should look similar to the following image:

The basic process that we must follow to modify an existing report is the same whether the report is one of the standard reports that comes with NAV 2015 or a custom report that we are enhancing in some way. An important discipline to follow in all cases where we are modifying a report that has been in production is NOT to work on the original, but on a copy. In fact, if this is a standard report that we are customizing, we should leave the original copy alone and do all our work on a copy. Not only is this safer because we will eliminate the possibility of creating problems in the original version, but it will make upgrading easier later on. Even when working on a new custom report, it is good practice to save intermediate copies with another object number for backup. This allows for returning to a previous working step should the next development step not go as planned.
While it is certainly possible in NAV 2015 to add a new layout to an existing dataset without disturbing the original material, the potential for a mistake creating a production problem is such that best practice dictates working on a copy, and not the original.
Just like report construction, report modification requires the use of two toolsets. Any modification that is done to the processing logic or the definition of the data available for report output must be done using C/SIDE Report Designer. Modification to the layout of a report can be done using SQL Server Report Builder (SSRB – just like we've been doing), or using Visual Studio Report Designer (VS RD) or, when a Word layout is available, using Microsoft Word 2013. Each report can have either or both an RDLC and a Word layout, but for those reports unlikely to need modification by a nonprogrammer, a Word layout would not be very useful.
All NAV 2015 report layouts can be modified by a developer using SSRB or VS RD because all standard reports are developed with RDLC layouts. A small number of standard reports also have Word layouts available in the initial distribution of NAV 2015. These are Reports 1304, 1305, 1306, and 1307. It is quite likely that future releases of NAV will have additional report layouts available in the Word format. In the meantime, if we want other reports, standard or custom, to have the Word layout options available, we will have to create them ourselves. The primary advantage of having Word layout options for reports is to allow modifications of the layouts by a trained user/developer using only Word. Because the modifications must still conform to good (and correct) report layout practices, appropriate training, careful work, and considerable common sense are needed to make such modifications, even though the tool is Microsoft Word.
If we decided that we want to have a Word version of the layout for our report 50001 – Shows by Type, the process would be along the following lines. First, we would create a Word layout in the form of a Word document. We can either start in Word and then import the resulting template document into our report, or start in C/SIDE Report Designer and then create a blank Word document where we will build our Word format. This is done by opening Report Designer as before and then clicking on Tools | Word Layout | New. This will immediately create an empty Word layout inside our report object.

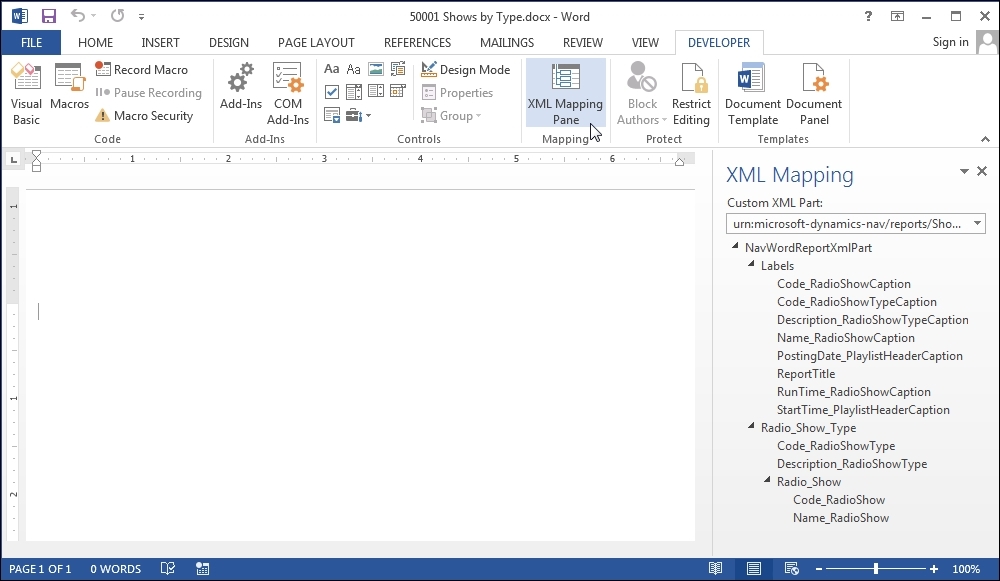
The next step is to export this Word layout so that we can work on it in Word 2013. Exporting is done in the same place as creating the new layout, this time by clicking on Tools | Word Layout | Export. After saving the exported Word document, we proceed to Word and open it. We must have the Developer tab enabled on the Word command ribbon. After opening the Word layout document, click on the Developer tab and then the XML Mapping Pane icon. As we might expect, this will open up the XML Mapping, which will show the XML data structure available from the report.
When we expand the XML groups, we can see the same type of data list that we saw earlier in SQL Server Report Builder (or would have seen had we used Visual Studio Report Designer). From this point, we can use standard Word capabilities combined with our report Caption, Label, and DataSet fields to create a report layout.
Additional information on report layout capabilities and management are available in both the system Help and online in YouTube videos. Refer to the Help article on Designing Report Layouts (accessed from the Microsoft Dynamics NAV Development Environment). For applicable YouTube videos, search using combinations of keywords such as "How do I?," NAV, Word, Report, etc. An add-on tool for creating NAV Report Word layouts, Jet Express for Word, is also available.
When our work on the report layout is complete, we save the Word document in the normal fashion. At this point, we return to C/SIDE RD and click on Tools | Word Layout | Import to import the Word layout template that we have just created/modified. The new layout can be tested from Role Tailored Client. First, we have to add the layout to the list of available Custom Report Layouts. From Role Tailored Client, we use the Search box in the upper-right corner, search for Layout, and select Custom Report Layouts. The following screen will be displayed:

Following the guidance provided in the Help article titled Managing Report Layouts (accessed from Microsoft Dynamics NAV Client), we can maintain a list of available custom report layouts and add our new layout to the list.
Finally, we can do our testing by choosing a report layout and running the report from the Report Layout Selection screen. This screen is also accessed by searching for Layout and selecting Report Layout Selection. We can choose either a standard (built-in) layout (RDLC or Word) or Custom Layout. The choices stored in the NAV database and can be specific to individual companies and database tenants. This screen as well as the Custom Report Layouts screen can be accessed through RTC so that users with appropriate permissions can maintain and assign applicable report layouts:

When NAV outputs a report (to screen, to hardcopy, or to PDF), NAV will render using the printer driver for the currently assigned printer. If we change the target printer for a report, the output results may change depending on the attributes of the drivers.
When we preview a report, by default, it will be displayed in an interactive preview mode. This mode will allow us to access all of the dynamic functions designed into the report, functions such as sorting and toggling for expand/collapse display, and drilling into the report. However, it may not look like the hardcopy that we get if we print it. If we click on the Print Layout button (circled in the following screenshot), then the printer layout version of the report will be displayed:

In most cases, the display on screen in the Preview – Print Layout mode will accurately represent how the report will appear when actually printed. In some cases though, NAV's output generation on screen differs considerably from the hardcopy version. This appears to occur most likely when the selected printer is some type of special-purpose printer (for example, a barcode label printer).
Inheritance operates for data displayed through report controls just as it does for page controls, but it is obviously limited to print-applicable properties. Properties, such as decimal formatting, are inherited, but as we saw with our date and time fields, not all formatting is inherited. Remember that if the property is explicitly defined in the table, it cannot be less restrictively defined elsewhere. This is one of the reasons why it's so important to focus on table design as the foundation of the system.
NAV 2015 reports can have interactive features enabled. Of course, these features are only available when the report is displayed in the preview mode; once the report is "printed" whether to a PDF, Word, Excel, or an output device, the interactive capabilities are no longer present.
Among the useful interactive reporting features are interactive sorting and data expand/collapse. Two standard reports that are examples of the interactive sort feature are Customer – Top 10 List (Report 111) and Customer – Summary Aging (Report 105). We'll take a look at Report 111 to see how NAV does it.
Since we're going to open Report in Designer, there is a possibility that through an unlucky combination of keystrokes, we could accidentally change this production report; therefore, the first thing that we want to do is make a copy for our inspection. Open Report 111 in C/Side Report Designer and then Save As Report object 50111 with a different name, such as Customer – Top 10 List Test. Once this is done, we can safely do almost anything that we want to Report 50111 because we can simply delete the object when we are done with it.
First, let's Run Report 50111 (or 111, they will look the same). At the top of four of the report columns, we will see an up/down arrowhead icon representing an interactive sort control as highlighted in the following image:

Now, open test report 50111 in C/SIDE RD and then View | Layout for SSRB review. Highlight the BalanceLCY_CustomerCaption textbox, as shown in the following image. Show the properties; choose the Interactive Sorting tab. As we can see here, interactive sort options are set for this column, to sort the details by the value of BalanceLCY_Customer. If we look at the properties of the other three columns that have interactive sorting enabled, we see similar setups:

As an experiment, we'll add a toggle to the rightmost column of our test report 50111 to make it visible or not visible at the user's option. In most cases, this feature would not be controlled by the user but by a parameter such as one tied to the user's login. We can set the Visibility ToggleItem property to the variable that we want to use as a toggle for the visibility control of the data that will be visible/hidden. This time we choose the Customer No. column and set the Balance column to initially be visible when the report is first run.
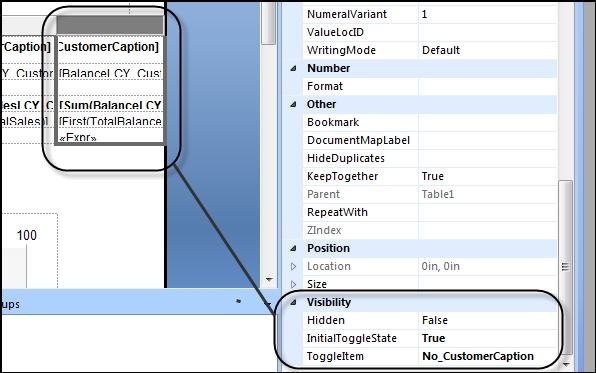
Save RDLC, exit SSRB, exit C/SIDE RD, save, compile, and Run the modified report. We will see an image like the top image in the following figure. If we click on the plus sign icon located above the No. column caption, plus will change to minus, and the rightmost column will be hidden, as shown in the partial image on the bottom of the following figure. If we click on minus, the Balance (LCY) column will again be visible:

Request Page is a page that is executed at the beginning of a report. Its presence or absence is under developer control. Request Page looks similar to the following screenshot based on one of the standard system reports, the Customer – Order Detail report, Report 108:

There are three FastTabs in this page. The Customer and Sales Order Line FastTabs are tied to the data tables associated with this report. These FastTabs allow the user to define both data filters and Flow Filters to control the report processing. The Options FastTab exists because the software developer wanted to allow some additional user options for this report.
Because we have defined the default sort sequences (DataItemTableView), except for the first DataItem, and we have not defined any Requested Filters (ReqFilterFields), the default Request Page for our report has only one DataItem FastTab. Because we have not defined any processing options that would require user input before the report is generated, we have no Options FastTab.
Our goal now is to allow the user to optionally input text to be printed at the top of the report. This could be a secondary report heading, instructions on interpreting the report, or some other communications to the report reader.
- Open Report 50001 in C/SIDE Report Designer.
- Access the C/AL Globals screen via View | C/AL Globals.
- Add a global variable named UserComment with DataType of Text. We will not define Length; this will allow the user to enter a comment of any length.

- Add this variable as a data Column to be passed to SSRB. The Column must be subordinate to a DataItem. We do not need a caption, as we will not label this field in the report layout.

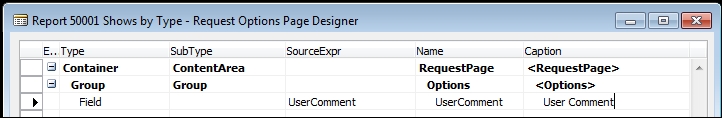
- Access Request Options Page Designer via View | Request Page.
- Enter three lines – a Container, Group, and Field with SourceExpr of UserComment.
- Exit Page Designer.
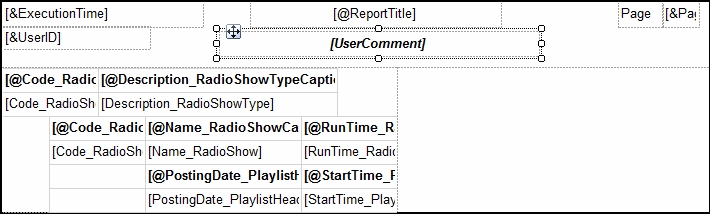
- Access SQL Server Report Builder via View | Layout.
- Add Text Box to the Layout design surface just below the Report Title, stretching the box out as far as the report layout allows.
- Expand DataSet_Result in the Report Data panel.
- Drag the User Comment field to the new text box.
- Save RDLC, exit SSRB, save, compile, and exit C/SIDE RD.
- Run Report 50001.
In the Request page, users can enter their comments, as shown in the following screenshot:
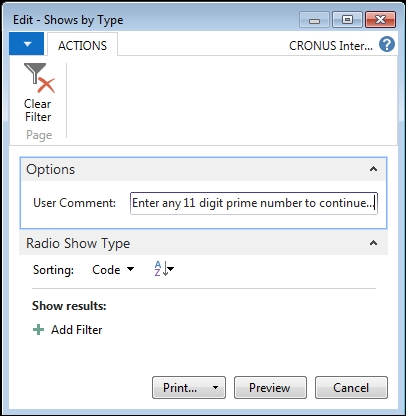
The report heading then shows the comment in whatever font, color, or other display attribute that the developer defined.
Because we did not specify the maximum length on our UserComment field, we can type in as much information as we want. Try it – type in a whole paragraph for a test.
One of the report properties that we reviewed earlier was ProcessingOnly. If this property is set to Yes, then the report object will not output a dataset for display or printing, but will simply do the processing of the data that we program it to do. The beauty of this capability is that we can use the built-in processing loop of the NAV report object along with its sorting and filtering capabilities to create a variety of data updating routines with a minimum of programming. The use of report objects also gives us access to the Request Page to allow user input and guidance for the run. We could create the same functionality by using codeunit objects and by programming all of the loops, the filtering, the user-interface Request Page, and so on ourselves. However, with ProcessingOnly Report, NAV gives us a lot of help and makes it possible to create some powerful routines with minimal effort.
At the beginning of the run of a ProcessingOnly report, there is very little user interface variation compared to a "normal" printing report. The ProcessingOnly Request Page looks much as it would for a printing report, except that the Print and Preview choices are not available. Everything else looks the same. Of course, we have the big difference of no visible output at the end of processing.
Just as we discussed in the chapter on pages, when we want to create a new report of a certain type that we haven't done recently (or at all), it's a good idea to find another report that is similar in all important aspects, and study it. We should also check whether there is a NAV Pattern defined for an applicable category of report. At the minimum, in both of these investigations, we will learn how the developers of NAV solved a data flow or totaling or filtering challenge. In the best case scenario, we will find a model that we can follow closely, respectfully plagiarizing (copying) a working solution, thus saving ourselves much time and effort.
Often, it is useful to look at two or three of the standard NAV reports for similar functions to see how they are constructed. There is no sense in reinventing the design for a report of a particular type, when someone else has already invented a version of it. Not only this, but they have also provided us with the plans and given us the ability to examine the C/AL code as well as the complete structure of the existing report object.
When it comes to modifying a system such as NAV, plagiarism is a very effective research and design tool. In the case of reports, our search for a model may be based on any of the several key elements. We might be looking for a particular data flow approach and find that the NAV developers used the Integer table for some DataItems (as many reports do).
We may need a way to provide some creative filtering similar to what is done in an area of the standard product. We might want to provide user options to print either details or a couple of different levels of totaling, with a layout that looks good no matter which choice the user makes. We might be dealing with all three of these design needs in the same report. In such a scenario, it is likely that we will be using multiple NAV reports as our models, one for this feature, another for that feature, and so forth.
If we have a complicated, application-specific report to create, we may not be able to directly model our report on a model that already exists. However, often, we can still find ideas in standard reports that we can apply to our new design. We will almost always be better off using a model rather than inventing a totally new approach.
If our design concept is too big a leap from what has been done previously, we should consider what we might change so that we can build on the strengths of C/AL and existing NAV routines. Creating entirely new approaches may be very satisfying (when it works), but too often, the extra costs exceed the incremental benefits.
For more NAV reporting information and ideas, please refer to Claus Lundstrom's blog: http://www.mibuso.com/blogs/clausl.