We will generate a dataset containing random gaussian numbers for three variables, and we will plot them into the same plot using the plot3d package.
- Import the plot3D library:
library(plot3D)
- Generate a dataset containing random Gaussian numbers for three variables:
x = rnorm(100)
y = rnorm(100)
z = x + y + rnorm(100,0,0.3)
idrow = 1:100
- Plot the variable in the same plot:
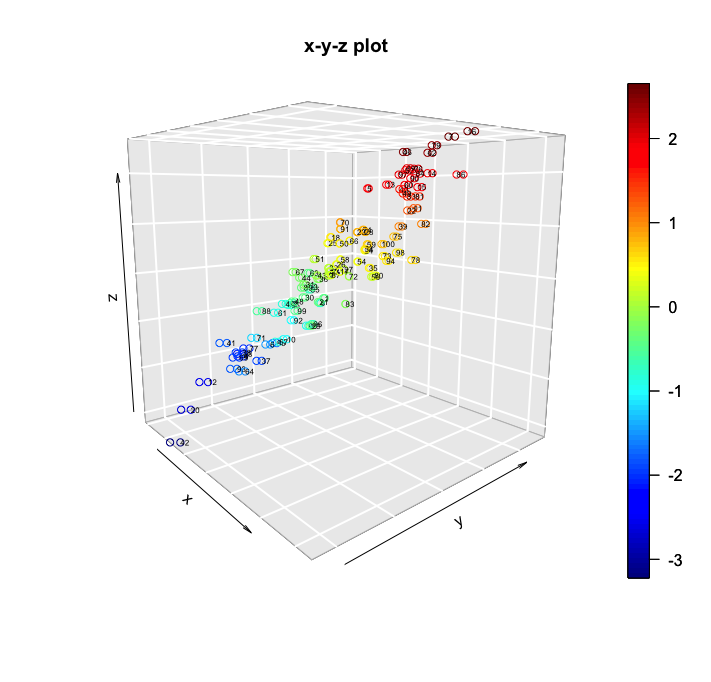
scatter3D(x, y, z, bty = "g", colkey = TRUE, main ="x-y-z plot",phi = 10,theta=50)
text3D(x, y, z, labels = idrow, add = TRUE, colkey = FALSE, cex = 0.5)
The following screenshot is the resulting 3D plot: