239
Chapter 15
Law for Estimation:
Triangular Distribution
Triangular distribution is one of the simplest known distributions. It can be con-
structed even with minimum or subjective data. e triangular distribution is
marked by its sharp limits. Inside the area defined by the limits, the triangle offers
a peak that can assume any position with the limits.
ese limits are Limits of Probability. Once the limits are known, filling the
distribution is easy.
The scientific imagination always restrains itself within the lim-
its of probability.
Thomas Huxley
It is also an approximate distribution: e comfort of approximation is matched
by convenience of usage and freedom. is freedom offered by the triangular distri-
bution makes it a favorite choice during business decision making and simulation.
Approximation is the hallmark of genius.

240 ◾ Simple Statistical Methods for Software Engineering
It is the mark of an educated mind to rest satisfied with the
degree of precision which the nature of the subject admits and
not to seek exactness where only an approximation is possible.
Aristotle
ree points that define a triangle have the power to guide. ey seem to stem
from a cosmic design of reality (see Box 15.1).
e earliest record of triangular distributions seems to be in 1755 (about one
century after the discovery of the related and slightly more sophisticated beta distri-
bution). Recently, the triangular distribution has been used as a proxy for the beta
distribution. However, the triangular distribution is simpler and more effective [1].
Bell Curve Morphs into a Triangle
We can consider the normal distribution to have a principal body with tail adjuncts.
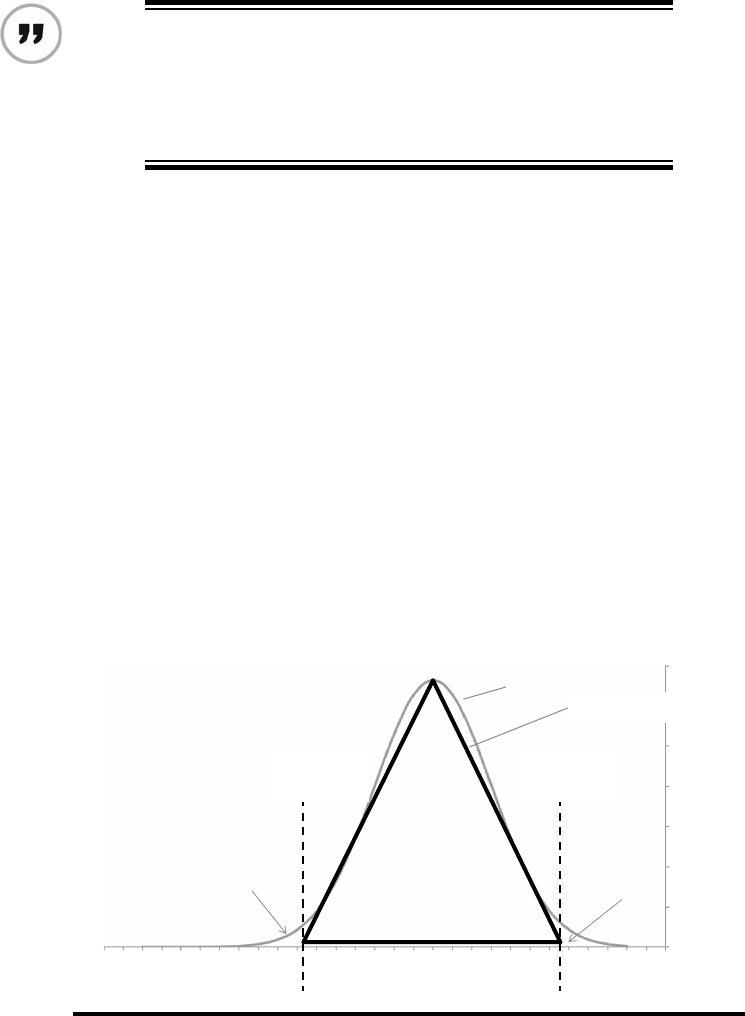
e truncation points divide these two ingredients, as shown in Figure 15.1. e
triangle is a good proxy to the curved but truncated principal body.
e above illustration presents the advantages of the triangular proxy; it has
focus and simplicity. e tails are discarded, and curvature is replaced by linear
construction. In project management, the tails represent risk and the body relates
to primary delivery. In risk management, we pursue distribution with tails having
0.14
0.10
0.08
0.06
0.04
0.02
0
2423222120191817161514131211109876543210–1–2–3–4–5
0.12
Normal distribution
Triangular distribution
Right tail
Left tail
Truncation
point
Truncation
point
Figure 15.1 Normal distribution as triangle.

Law for Estimation ◾ 241
appropriate characteristics to suit the given problem, such as the exponential and
Pareto for long tails and Gumbel and Weibull for constrained tails. In delivery
management, the triangle stands for the core output, with risks being relegated
to the next layer of abstraction and kept invisible, for the present, to the manager.
Mental Model for Estimation
e triangular distribution is both bounded and peaked. Hence, it carries the
advantages of being bounded like the uniform distribution and has the additional
advantage of having a strong central tendency. e triangular distribution is a sim-
plified model of process results and a pragmatic substitute for normal and other
distributions. e project management variables of time, cost, and performance
can be elegantly modeled using the triangular distribution.
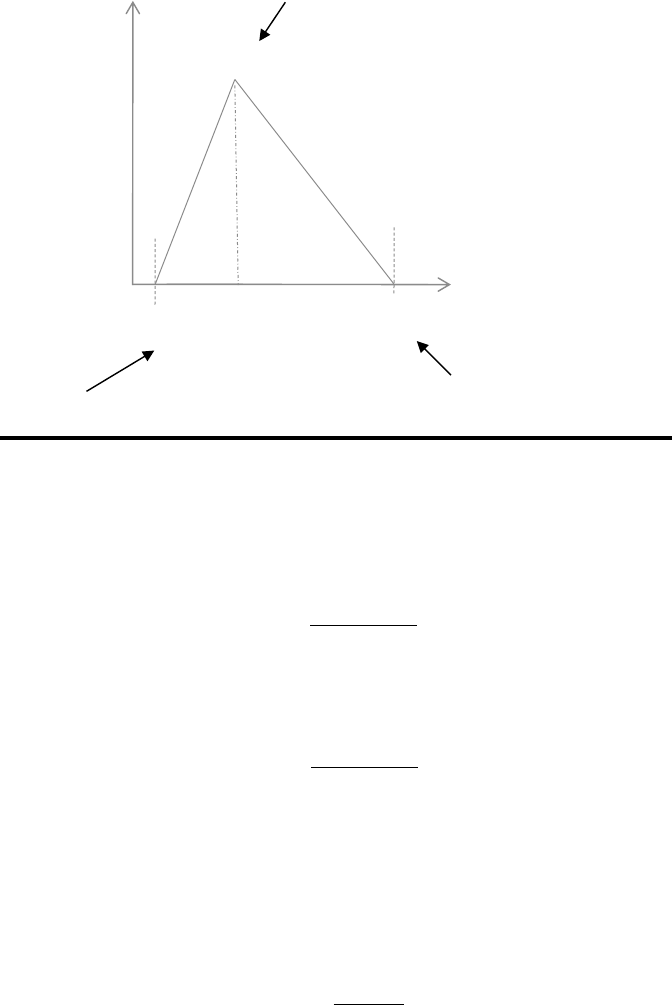
A plot of the triangle may be seen in Figure 15.2. e bottom edges a and b
represent optimistic and pessimistic values. e middle edge c represents the most
likely value. is is the estimation triangle extensively used in management.
Box 15.1 Three PoinTs for Guidance
It is good to know that as a general navigation concept, guidance is available
from three points of reference. If you have three, you get your bearing. Here
is a related quote:
Sailors and seafarers find their bearings at sea by means of
natural points of reference located along the coast. These
points, for example church spires, hills, water-towers or
lighthouses that generally stand out from the rest of the
coastline, are called amers [seamarks or landmarks]. All
you have to do is identify three such landmarks in comple-
mentary directions so as to be able to construct a triangle
which inevitably contains your ship. This triangle drawn on
the navigation map is called the “triangle of uncertainty.”
Cécile Le Prado
Likewise, in software development, project three-point estimates provide
great guidance. Managers can navigate through the project life cycle with
this help.

242 ◾ Simple Statistical Methods for Software Engineering
e probability density function (PDF) is split between simple equations to the
two straight lines to the peak from the two base points. e equation to the first
line, from the left base point to the peak, is given as follows:
y x
x a
b a c a
( )
( )
( )( )
=
−
− −
2
(15.1)
e equation to the second line, from the peak to the second base point, is given
as follows:
y x
b x
b a b c
( )
( )
( )( )
=
−
− −
2
(15.2)
Mean
e model statistics are derived from elementary geometrical properties of a tri-
angle. Arithmetic mean is according to the following equation:
Mean =
+ +a b c
3
(15.3)
a bc
x variable
Probability
Most likely
PessimisticOptimistic
In expert estimation
past experience is
probed to find the
limits. e results can
be represented by a
triangular model.
Peak
Figure 15.2 Triangular estimation—a widely used mental model.

Law for Estimation ◾ 243
Here is an example of the equation application. Let us take the case of a project
manager trying to give input to a simulator. Let us say he is required to define a
PDF for productivity. From his own experience, he recalls that function point (FP)/
person-month had varied from 15 to 30. He has also obtained a recent bench-
mark report claiming that the mean value of productivity is 20 FP/person-month.
Following the Bayesian spirit, we can combine both these data, first a historic
probability and then a recent piece of evidence. Substituting these three values in
Equation 15.3, we derive the following:
a = 15
b = 30
Mean = 20
erefore, c = (20 × 3) − 15 − 30 = 15
is is a right-angled triangle skewed to the right, as shown in Figure 15.3.
is model can now be used in Monte Carlo simulation as an input.
Median
If we are lucky enough to obtain the median value for a skewed result, then we can
apply the formulas in Equations 15.4 and 15.5, as follows:
Median when /= +
− −
≥ +a
b a c a
c a b
( )( )
( )
2
2
(15.4)
FP/PM
15 30
a
b
Mean
erefore, c
=
=
=
=
=
15 History
30 History
20 (recent benchmark)
(20 × 3) – 15 – 30
15
3
a + b + c
Mean =
Mean
c
Productivity model for
Monte Carlo simulation
Figure 15.3 Productivity model.
..................Content has been hidden....................
You can't read the all page of ebook, please click here login for view all page.
