
51
C H A P T E R 4
Analog-to-Digital Signal
Conversion
e process of analog-to-digital signal conversion consists of converting a continuous time and
amplitude signal into discrete time and amplitude values. Sampling and quantization constitute
the steps needed to achieve analog-to-digital signal conversion. To minimize any loss of infor-
mation that may occur as a result of this conversion, it is important to understand the underlying
principles behind sampling and quantization.
4.1 SAMPLING
Sampling is the process of generating discrete time samples from an analog signal. First, it is
helpful to see the relationship between analog and digital frequencies. Let us consider an analog
sinusoidal signal x.t/ D A cos.!t C /. Sampling this signal at t D nT
s
, with the sampling time
interval of T
s
, generates the discrete time signal
xŒn
D
A
cos
.
!nT
s
C
/
D A cos
.
n C
/
; n D 0; 1; 2; : : : ; (4.1)
where D !T
s
D
2f
f
s
denotes digital frequency with units expressed in radians (as compared
to analog frequency ! with units expressed in radians/s).
e difference between analog and digital frequencies is more evident by observing that
the same discrete time signal is obtained for different continuous time signals if the product
!T
s
remains the same. An example is shown in Figure 4.1. Likewise, different discrete time
signals are obtained for the same analog or continuous time signal when the sampling frequency
is changed (see Figure 4.2). In other words, both the frequency of an analog signal and the
sampling frequency define the frequency of the corresponding digital signal.
It helps to understand the constraints associated with the above sampling process by ex-
amining signals in frequency domain. e Fourier transform pairs in analog and digital domains
are given by

52 4. ANALOG-TO-DIGITAL SIGNAL CONVERSION
1
0.5
0
-0.5
-1
1 0 5 10 15 20
0 5 10 15 20
21.5
1
0.5
0
-0.5
-1
1
0.5
0
-0.5
-1
1
0.5
0
-0.5
-1
1 21.5
Ts = 0.05s
Ts = 0.025s
x(t) = cos(2*pi*t)
x(t) = cos(4*pi*t)
Figure 4.1: Different sampling of two different analog signals leading to the same digital signal.
Fourier transform pair for
analog signals
8
ˆ
ˆ
ˆ
ˆ
<
ˆ
ˆ
ˆ
ˆ
:
X.j!/ D
1
R
1
x.t /e
j!t
dt
x.t / D
1
2
1
Z
1
X.j!/e
j!t
d!:
(4.2)
Fourier transform pair for
discrete signals
8
ˆ
ˆ
ˆ
ˆ
ˆ
<
ˆ
ˆ
ˆ
ˆ
ˆ
:
X
e
j
D
1
X
nD1
xŒne
j n
; D !T
s
xŒn D
1
2
Z
X
e
j
e
j n
d:
(4.3)
As illustrated in Figure 4.3, when an analog signal with a maximum frequency of f
max
(or bandwidth of W ) is sampled at a rate of T
s
D
1
f
s
, its corresponding frequency response is
repeated every 2 radians, or f
s
. In other words, Fourier transform in digital domain becomes
a periodic version of Fourier transform in analog domain. at is why, for discrete signals, one
is only interested in the frequency range 0 f
s
=2.
erefore, in order to avoid any aliasing or distortion of the frequency content of the
discrete signal, and hence to be able to recover or reconstruct the frequency content of the
original analog signal, the sampling frequency must obey this rate f
s
2f
max
. is is known as

4.1. SAMPLING 53
1
0.5
0
-0.5
-1
1 0 5 10 15 20
0 5 10 15 20
21.5
1
0.5
0
-0.5
-1
1
0.5
0
-0.5
-1
1
0.5
0
-0.5
-1
1 21.5
Ts = 0.05s
Ts = 0.025s
x(t) = cos(2*pi*t)
x(t) = cos(2*pi*t)
Figure 4.2: Different sampling of the same analog signal leading to two different digital signals.
Analog Waveform Discrete Signal
Spectrum Spectrum
x(t) y(t)
X( f ) Y( f )
t
1
t tt
4
t
3
t
2
t
1
t
4
t
3
t
2
-W W f
-W W ff
s
= 1/T
s
Figure 4.3: (a) Fourier transform of a continuous-time signal and (b) its discrete time version.
the Nyquist rate; that is, the sampling frequency should be at least twice the highest frequency
in the signal. Normally, before any digital manipulation, a frontend antialiasing analog lowpass
filter is used to limit the highest frequency of the analog signal.
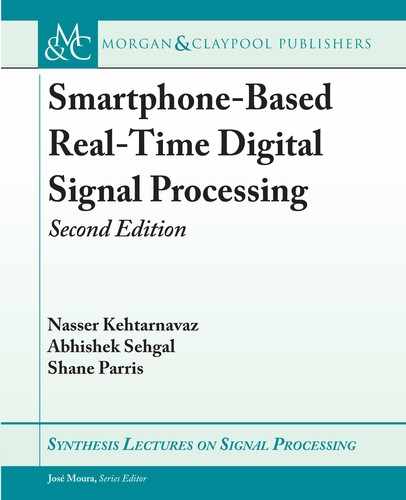
Figure 4.4 shows the Fourier transform of a sampled sinusoid with a frequency of f
o
. As
can be seen, there is only one frequency component at f
o
. e aliasing problem can be further
illustrated by considering an under-sampled sinusoid as depicted in Figure 4.5. In this figure, a
1 kHz sinusoid is sampled at f
s
D 0:8 kHz, which is less than the Nyquist rate. e dashed-
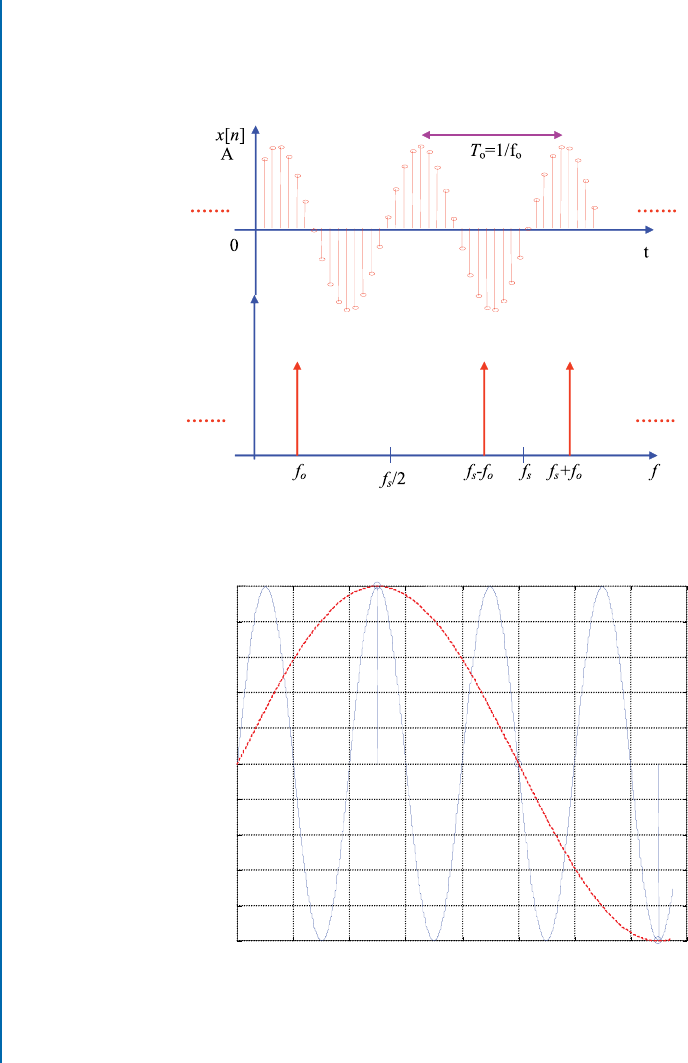
54 4. ANALOG-TO-DIGITAL SIGNAL CONVERSION
line signal is a 200 Hz sinusoid passing through the same sample points. us, at this sampling
frequency, the output of an A/D converter would be the same if either of the sinusoids were the
input signal. On the other hand, over-sampling a signal provides a richer description than that
of the same signal sampled at the Nyquist rate.
X( f )
Figure 4.4: Fourier transform of a sampled sinusoidal signal.
Amplitude
1
0.8
0.6
0.4
0.2
0
-0.2
-0.4
-0.6
-0.8
-1
Time
0 0.5 1 1.5 2 2.5
× 10
-3
3 43.5
Figure 4.5: Ambiguity caused by aliasing.
..................Content has been hidden....................
You can't read the all page of ebook, please click here login for view all page.