Assessment of Electricity Storage Systems
F. Rahman1,2; M.A. Baseer3,4; S. Rehman5 1 Center for Refining & Petrochemicals, Research Institute, King Fahd University of Petroleum & Minerals, Dhahran, Saudi Arabia
2 Center of Research Excellence in Renewable Energy, King Fahd University of Petroleum & Minerals, Dhahran, Saudi Arabia
3 Mechanical and Aeronautical Engineering Department, University of Pretoria, Pretoria, South Africa
4 Jubail Industrial College, Jubail, Saudi Arabia
5 Center for Engineering Research, Research Institute, King Fahd University of Petroleum and Minerals, Dhahran, Saudi Arabia
Abstract
The objective of this study was to assess currently available advanced electricity storage systems (ESSs) that are efficient and cost-effective to be able to store electricity generated from intermittent renewable sources such as solar photovoltaics and wind.
Weather conditions, electricity demand patterns, and available raw materials were studied to select suitable ESS for Saudi Arabia. It was found that temperatures in Saudi Arabia vary between − 9 and 51 °C, and most of the ESS are sensitive to operating temperatures. A thorough assessment of available technologies pertaining to the advanced ESS for storing electricity generated from renewable energy sources was carried out. The technology assessment was based on key ESS performance parameters such as energy efficiency, energy density, battery life, depth of discharge, charge/discharge rate, commercial maturity, and so on. Cost data in terms of capital cost, per-cycle cost, and maintenance cost were presented.
Acknowledgments
The authors are grateful to the Center of Research Excellence in Renewable Energy (CoRE-RE) at King Fahd University of Petroleum & Minerals, Dhahran, established by the Ministry of Higher Education, Saudi Arabia, for providing the financial grant under Project No. CoRE-RE03.
4.1 Introduction
The development of efficient and environmentally safe energy generation is an important and urgent issue to reduce global warming and potentially serious damage due to various pollutants in the atmosphere. Electrical energy that can be generated from renewable sources, such as solar or wind, offers enormous potential for meeting future energy demands, which are expected to be double that of current consumption in the next 50 years. However, the use of electricity generated from these intermittent, renewable sources requires efficient advanced electricity storage systems (ESSs).
Electrical energy storage refers to a process of converting electrical energy from a power network into a form that can be stored for converting back to electrical energy when needed. Such a process enables electricity to be produced at times of either low demand or low generation cost, or from intermittent renewable energy sources (RESs), and to be used at times of high demand, high generation cost, or when no other generation means is available.
Due to the exponentially growing population and limited means of fossil fuel, new and renewable sources of energy are being promoted to meet demands both in grid-connected and in off-grid areas. These sources include mainly solar photovoltaic (PV) and wind power.
Therefore, solar and wind resources are being exploited on a large scale, and the available technology is also commercially developed and accessible. Solar PV is a very good source of electricity generation in this part of the world, that is, the Middle East in general and Saudi Arabia in particular. The only barriers are its storage, relatively high cost, low efficiency, and the local environmental problem of high temperature and suspended dust particles, which puts it at a further disadvantage.
The study was initiated by conducting online literature searches for the period 1990-2014, using electronic databases. The literature was reviewed, and relevant materials have been collected for further evaluation and analysis. Numerous types of storage systems are available, or are becoming available, to meet these needs. It is important to identify a suitable match between requirements and the performance of various types of technologies. The overall goal of this study is to address this match by examining both performance characteristics and cost of ESS that are suitable for storing electricity generated from RESs.
4.2 Why ESS
Electricity is generated by thermal/nuclear power plants and is consumed instantaneously. Unlike other energy generation systems like oil, natural gas, or coal, the power grid or the generation plants essentially have no storage or “surge” capacity to smooth out peaks and valleys in demand or to provide reserve capacity during sudden spikes in demand.
Nuclear power plants, oil-fired steam power plants, gas turbines, as well as hydroelectric plants have turbine generators that operate continuously and hence deliver firm, continuous, and dispatchable power required by consumers. With such a steady base load supply, power plants can meet demand shifts and daily cycles either by adding peaking generators or utilizing the available spinning reserve. Thus, the balancing of power supply and demand, required for the operation of a safe and reliable grid, is now done on line in real time.
Power generated by solar PVs or wind is inherently intermittent. The sun generates power approximately 10-12 h a day, and in the rainy season, clouds can cover the sun intermittently. The wind is also highly fluctuating, both in terms of direction and magnitude over 24 h of the day, and the day of the year. ESS are the critical technology needed by renewable power if it is to become a major source of base load dispatchable power to replace conventional thermal/nuclear power plants. For stable and smooth power supply, large-scale ESS are essential and needed to convert the intermittent and fluctuating renewable power that is generated into dispatchable power. Without sufficient ESS, accessible online, solar/wind power cannot serve as a stable base load supplier (Lee and Gushee, 2008).
According to Dr. Imre Gyuk, energy storage program manager at the U.S. Department of Energy, energy storage can (Gyuk, 2009)
• Provide spinning reserve and energy management to accommodate renewable resources
• Provide power quality and digital reliability
• Provide voltage and frequency regulation and smooth renewable contributions
• Allow better asset utilization of generation and transmission
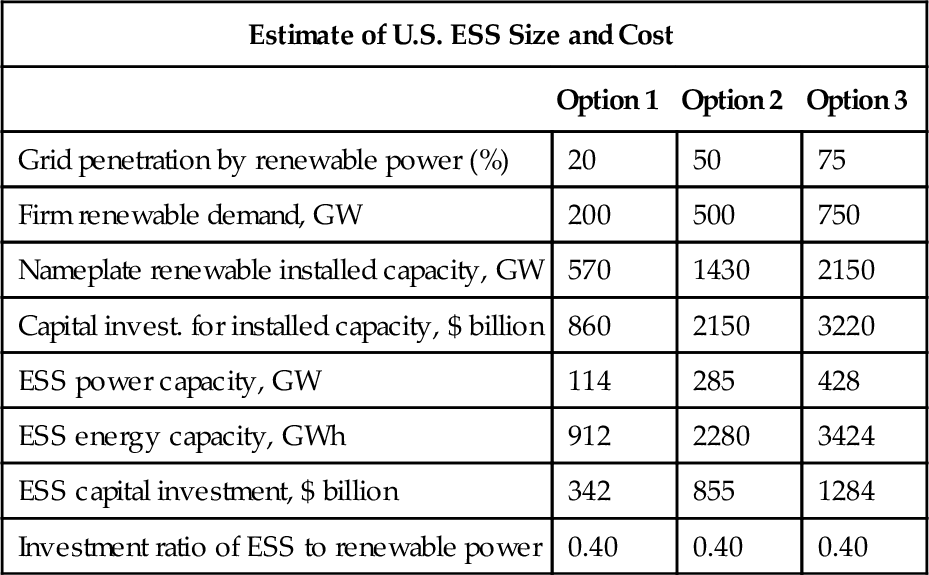
ESS has several applications in the electrical power system, as shown in Figure 4.1. They are divided into three main categories:

• Power quality: In these applications, ESS is only applied for seconds or less, as needed, to ensure continuity of quality power.
• Bridging power: In these applications, ESS is used for seconds to minutes to ensure continuity of service when switching from one source of energy generation to another.
• Energy management: In these applications, ESS is used to decouple the timing of generation and consumption of electric energy. A typical application is utilization of solar PV/wind power, which involves the charging of ESS when energy is available and utilization as needed. This would also enable consumers to be grid-independent for many hours.
These applications require energy discharges from a fraction of a second in high-power applications to hours in high-energy applications (see Figure 4.1). Large-scale electricity storage technologies cover a wide spectrum of applications, ranging from fast power quality applications to improve reliability all the way to slow energy management applications to improve profitability.
There are a number of applications in the aforementioned three main categories. Moreover, the deregulation of the electrical power industry in Saudi Arabia will require unbundling of the generation, transmission, and distribution sectors; some of the sectors will be privatized, and the private industry would like to see an efficient power industry. The main focus of this study is to review and assess the ESS that are suitable for energy management applications.
Lior (2010) presented a comprehensive review of the present situation and possible paths to the future of sustainable energy development. He remarked that wind and solar PV are experiencing exponential growth with decrease in cost. Improvements and technological advances in the distribution and storage of electric power will continue and should be advanced much faster. He indicated that the U.S. government budget in 2009 emphasized clean, renewable energy generation and storage, among other technologies.
DOE/EPRI (2013) published the Electricity Storage Handbook in collaboration with the NRECA, funded through Dr. Imre Gyuk, U.S. Department of Energy (DOE) and Haresh Kamath, Electric Power Research Institute (EPRI). The handbook presents information on stationary energy storage systems. These include batteries, flywheels, compressed air energy storage (CAES), and pumped hydropower, and exclude thermal, hydrogen, and other forms of energy storage that could also support the grid.
4.3 The Potential for ESSs
The level of storage on electricity networks varies considerable around the world. In the United States, around 2.5% of all the power delivered on the network has passed through a storage plant. In Europe, by contrast, that figure is 10%, and in Japan it is 15% (EPRI-DOE, 2003).
Generally, the public view is that solar PV/wind power can replace thermal/nuclear power plants as sources of power if enough wind farms and solar PV systems are built. Therefore, research and development is focused on improving the performance and cost of solar PV/wind electricity generation. As one of the critical components of renewable power supply systems, ESS is not getting due attention in its development. To obtain an estimate of the order of magnitude of the size of the ESS needed and the associated capital investment, three scenarios of renewable power penetration into the US grid are discussed:
a. 20%—ESS required for grid stability
b. 50%—Renewable becomes the principal power source
c. 75%—Ultimate renewable penetration
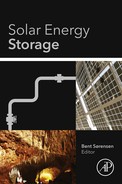
Table 4.1 summarizes the current “upper bound” conservative estimates for the needed ESS capacity for the United States under the three scenarios of grid penetration. The conventional electricity value chain has been considered to consist of five links, namely fuel/energy source, generation, transmission, distribution, and customer side energy service, as shown in Figure 4.2. A typical configuration for integration of ESS with renewables is illustrated in Figure 4.3.
Table 4.1
“Upper Bound” Estimate of U.S. ESS Size and Cost
| Estimate of U.S. ESS Size and Cost | |||
| Option 1 | Option 2 | Option 3 | |
| Grid penetration by renewable power (%) | 20 | 50 | 75 |
| Firm renewable demand, GW | 200 | 500 | 750 |
| Nameplate renewable installed capacity, GW | 570 | 1430 | 2150 |
| Capital invest. for installed capacity, $ billion | 860 | 2150 | 3220 |
| ESS power capacity, GW | 114 | 285 | 428 |
| ESS energy capacity, GWh | 912 | 2280 | 3424 |
| ESS capital investment, $ billion | 342 | 855 | 1284 |
| Investment ratio of ESS to renewable power | 0.40 | 0.40 | 0.40 |

4.4 Requirements of ESS for Saudi Arabia
Demand for new energy storage systems is increasing for applications such as remote area power supply systems (e.g., offshore platforms, telecommunication installations), stressed electricity supply systems (e.g., Hajj operations), emergency backup applications, and mobile applications. The supply of electric power to remote areas is becoming more attractive due to advancements in PV technologies and wind power generation systems, along with the development of advanced storage batteries. The principal limitation of renewable energy production is its fluctuating and unpredictable nature, requiring it to be “balanced” with reliable fossil fuel derived energy so that electricity can be supplied constantly to industry and society. Energy storage systems can be used to balance fluctuations in the supply and demand of electricity.
Due to the exponentially growing population and limited means of fossil fuel energy, new and renewable sources of energy are being promoted to meet energy demands both in grid-connected areas and in off-grid areas. These sources include solar PV, solar thermal, wind power, geothermal, tidal, wave, biofuels, and so on. Of these, solar and wind resources are being exploited on a large scale, and the available technology is also commercially developed and accessible. Solar PV is a very good source of electricity generation in this part of the world, that is, the Middle East in general and Saudi Arabia in particular. The only barriers are its storage, relatively high cost, low efficiency, and the local environmental problem of high temperature and suspended dust particles, which puts it at a further disadvantage. The status of the local environment in which the ESS has to operate needs to be thoroughly investigated to understand the limitations or advantages of local conditions for ESS operations.
4.4.1 Climate of Saudi Arabia
Usually, batteries are used to store the energy produced by the sun or the wind to ensure continuous, 24/7 supply. The batteries are very sensitive to weather conditions (temperature, relative humidity, barometric pressure, wind speed, etc.) and need to be evaluated both for efficiency and for working life degradation in the harsh environment of Saudi Arabia. Among all the weather parameters, temperature and relative humidity are very critical for battery efficiency and working life, and hence should be considered when selecting a battery for energy storage purposes.
Saudi Arabia has a desert climate characterized by extreme heat during the day, an abrupt drop in temperature at night, and slight, erratic rainfall. Because of the influence of a subtropical high-pressure system and the many fluctuations in elevation, there is considerable variation in temperature and humidity. The two main extremes in climate are felt between the coastal lands and the interior.
Temperatures are different in each part of the country. Particularly in the central area and the north, temperatures can be very high. From June through August, midday temperatures in the desert can soar to 50 °C (122 °F) or more. The south has moderate temperatures, which can go as low as 10 °C (50 °F) during the summer in the mountains of Sarawat in Asir. Along the coastal regions of the Red Sea and the Persian Gulf, the desert temperature is moderated by the proximity of these large bodies of water. Temperatures seldom rise above 38 °C, but the relative humidity is usually more than 85%, and frequently 100% for extended periods. This combination produces a hot mist during the day and a warm fog at night. A uniform climate prevails in Najd, Al-Qasim Province, and the great deserts. The average summer temperature is 45 °C, but readings of up to 51 °C are common. The heat becomes intense shortly after sunrise and lasts until sunset, followed by comparatively cool nights.
During the winter, the temperatures are moderate in general but turn cold at night, sometimes descending below freezing, especially in mountainous areas of the west and along the northern border. Torrential rains fall along the Red Sea coast during March and April. In Najd, Al-Qasim Province, in the winter, the temperature seldom drops below 0 °C, but the almost total absence of humidity and the high wind-chill factor make a bitterly cold atmosphere. In the spring and autumn, temperatures average 29 °C.
The entire year's rainfall may consist of one or two torrential outbursts that flood the wadis and then rapidly disappear into the soil to be trapped above the layers of impervious rock. This is sufficient, however, to sustain forage growth. Although the average rainfall is 100 mm per year, the whole region may not experience rainfall for several years. When such droughts occur, as they did in the north in 1957 and 1958, affected areas may become incapable of sustaining either livestock or agriculture. The region of Asir is subject to Indian Ocean monsoons, usually occurring between October and March. An average of 300 mm of rainfall occurs during this period, which is about 60% of the annual total. Additionally, in Asir and the southern Hijaz, condensation caused by the higher mountain slopes contributes to the total rainfall.
Prevailing winds are from the north, and when they blow, coastal areas become bearable in the summer and even pleasant in winter. A southerly wind is accompanied invariably by an increase in temperature and humidity and by a particular kind of storm known in the gulf area as a kauf. In late spring and early summer, a strong northwesterly wind, the shamal, blows; it is particularly severe in eastern Arabia and continues for almost three months. The shamal produces sandstorms and dust storms that can decrease visibility to a few meters.
The mean maximum and minimum values of temperature over a period of 35 years (i.e., from 1970 to 2006) are summarized in Table 4.2. This is a very important parameter that affects the performance of some ESS. The long-term mean temperature was found to vary between a minimum of 18.6 °C at Abha and a maximum of 30.2 °C at Gizan. On the other hand, the maximum and minimum temperatures recorded were 51 and − 9.4 °C, corresponding to Qaisumah and Hail stations, respectively. So any ESS being considered for Saudi Arabia should have a tolerance of withstanding a temperature of about − 9 to 51 °C.
Table 4.2
Long-Term Statistics of Weather Parameters for 20 Meteorological Stations
| S. No. | Station | Pressure (mb) | Rain (mm) | Temperature (°C) | Relative Humidity (%) | Wind Speed (m/s) | |||
| Mean | Max | Mean | Min | Max | Mean | Mean | Max | ||
| 1. | Dhahran | 1006.7 | 125.0 | 26.4 | 2.5 | 49.0 | 52.5 | 4.38 | 11.8 |
| 2. | Gizan | 1007.7 | 90.0 | 30.2 | 11.8 | 45.3 | 68.4 | 3.24 | 7.7 |
| 3. | Guriat | 954.8 | 36.5 | 19.5 | − 8.0 | 47.6 | 43.5 | 4.22 | 16.5 |
| 4. | Jeddah | 1007.3 | 55.0 | 28.2 | 9.8 | 49.0 | 61.4 | 3.71 | 11.3 |
| 5. | Turaif | 916.9 | 25.7 | 19.0 | − 8.0 | 45.5 | 40.3 | 4.33 | 14.4 |
| 6. | Riyadh | 942.4 | 70.0 | 26.7 | 0.0 | 47.8 | 26.2 | 3.09 | 8.8 |
| 7. | Yanbu | 1007.8 | 73.2 | 27.7 | 4.7 | 49.0 | 53.8 | 3.76 | 10.3 |
| 8. | Abha | 794.0 | 119.9 | 18.6 | 0.0 | 34.1 | 54.6 | 2.94 | 14.9 |
| 9. | Hail | 901.3 | 47.5 | 22.4 | − 9.4 | 44.5 | 33.2 | 3.24 | 10.8 |
| 10. | Al-Jouf | 936.1 | 34.0 | 22.0 | − 6.0 | 46.7 | 32.1 | 4.02 | 15.9 |
| 11. | Al-Wejh | 1007.9 | 116.0 | 25.1 | 5.1 | 46.0 | 64.6 | 4.43 | 11.8 |
| 12. | Arar | 949.6 | 38.0 | 22.2 | − 5.6 | 48.2 | 36.2 | 3.61 | 12.9 |
| 13. | Bisha | 884.0 | 40.0 | 25.9 | 0.3 | 44.8 | 29.3 | 2.47 | 10.3 |
| 14. | Gassim | 937.6 | 86.0 | 25.1 | − 4.0 | 49.0 | 29.0 | 2.78 | 9.3 |
| 15. | Khamis | 797.9 | 99.0 | 19.8 | 1.5 | 35.0 | 51.4 | 3.14 | 12.9 |
| 16. | Nejran | 879.4 | 157.0 | 25.7 | 1.0 | 44.0 | 30.1 | 2.10 | 8.8 |
| 17. | Qaisumah | 969.5 | 64.0 | 25.5 | − 4.0 | 51.0 | 31.4 | 3.55 | 11.8 |
| 18. | Rafina | 960.3 | 121.0 | 23.4 | − 5.8 | 49.0 | 38.4 | 3.86 | 12.4 |
| 19. | Tabouk | 926.0 | 36.0 | 22.0 | − 3.5 | 46.4 | 34.0 | 2.73 | 15.5 |
| 20. | Taif | 855.4 | 169.0 | 23.1 | − 1.5 | 40.2 | 43.3 | 3.66 | 10.3 |

4.4.2 Supply-Demand Situation of Power in Saudi Arabia
Electric energy in the Kingdom of Saudi Arabia is provided mainly by the Saudi Electricity Company (SEC). SEC is divided into four operating areas: the eastern, central, western, and southern operating areas. Residential and commercial loads represent more than 60% of the SEC total load. A large portion of the loads is mainly from air conditioners; therefore, reducing the use of energy at peak hours and building it at off-peak hours looks like a viable option.
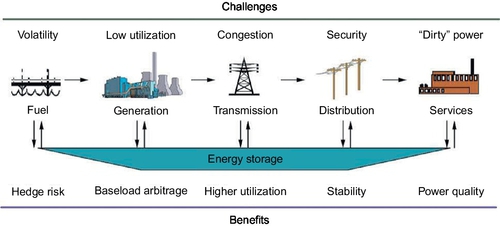
To study the viability, the hourly load data for SEC's four operating areas for 2006 were obtained. In this report, the preliminary assessment is conducted for the central operating area (COA). COA was chosen for the assessment because the load in COA is mostly residential and commercial, and the difference between the daily peak and minimum load is quite large. The peak load recorded in 2006 was 9725 MW and occurred in the month of July; the total annual energy was 52,794 GWh. The minimum load recorded was 2133 MW and occurred in the month of January. The value of the peak-to-minimum ratio for COA was 4.56 and the annual load factor was 0.62. Figure 4.4 shows the peak day load for COA: the maximum load during the day was 9725 MW, and it occurred at 1400 h on July 1, 2006. The minimum load for the day was 7290 MW, and the average load for the day was 8169 MW.
It can be seen from Figure 4.4 that the load remains below 8500 MW for around 16 h and above the 8500 MW mark for around 8 h. If the load during peak hours is supplied through any ESS, the ESS could be charged during off-peak hours. It should be noted that this is a preliminary analysis, and a detailed techno-economic analysis is required before recommending ESS for load shifting in COA.
4.4.3 Local Raw Materials for ESS
Sulfur is abundantly available and cheap in Saudi Arabia due to large refining capacity. ESS that utilize sulfur or any form of sulfur-based product may be a step toward utilization of sulfur, which is a disposal problem for Saudi Aramco.
4.4.4 Global and Local PV/Wind Power Installed Capacities
According to the latest update, global investment on the development and utilization of renewable sources of power increased to $244 billion in 2012 compared to $279 billion in 2011 (Weblink1, 2014). Global wind power installed capacity increased by 12.4% to more than 318 GW in 2013 due to greater participation by China and Canada. However, installations slowed in 2013 to about 35.5 GW, almost 10 GW less than in 2012 (Weblink2, 2014). China's installed wind capacity was 75.3 GW at the end of 2012, and it reached 91.4 GW in 2013. Canada, the other major contributor to wind power capacity, added 1.6 GW of new capacity. Europe's installed wind capacity rose to almost 121.5 GW in 2013, compared to 110 GW at the end of 2012. The world's cumulative PV installed capacity surpassed the impressive 100 GW electrical power mark, achieving just over 102 GW at the end of 2012 (Weblink3, 2014). The global cumulative PV installed capacity in 2011 was 71 GW. This capacity is capable of producing as much annual electrical energy as 16 coal power plants or nuclear reactors of 1 GW each. Each year, these PV installations save more than 53 million tons of CO2 equivalent greenhouse gases from entering into the atmosphere. The total hydro installed capacity reached 990 GW in 2012 compared to 960 GW in year 2011, an increase of 3.12% (Weblink1, 2014).
In this part of the world (i.e., in Saudi Arabia), higher intensities of global solar radiation are available, with longer hours of sunshine. Global solar radiation varies between a minimum of 1.63 MWh/m2/year at Tabuk and a maximum of 2.56 MWh/m2/year at Bisha, and an overall mean of 2.06 MWh/m2/year (Rehman et al., 2007). The duration of sunshine varied between 7.4 and 9.4 h, with an overall mean of 8.89 h. The seasonal variation of global solar radiation and sunshine duration obtained using respective data from 41 locations in the kingdom is shown in Figures 4.5 and 4.6, respectively. It is evident from these figures that higher intensities of global solar radiation and longer durations of sunshine are observed during summer, when the water requirement is comparatively higher.


The utilization of solar PVs in Saudi Arabia goes back to early 1980s, when King Abdulaziz City for Science and Technology installed the world's largest grid-connected 5 kW PV plant at Solar Village in Riyadh. PV panels are being widely used for remote applications such as cathodic protection and communication towers. Per available information, cumulative PV installed capacity in Saudi Arabia is depicted in Figure 4.7. A 500 kW PV plant was realized in 2011 in the Farasan Island power plant in Gizan, while another 10,200 kW grid-connected PV power plant was installed in 2012 at Aramco Campus in Dhahran, as can be seen in Figure 4.7. In 2013, KASPAREC in Riyadh brought a 3500 kW PV plant on line, which boosted the total PV installed capacity of Saudi Arabia to more than 20 MW. The present trends show that utilization of PV will increase, and hence for smooth and quality power supply to consumers, appropriate energy storage systems will be required.

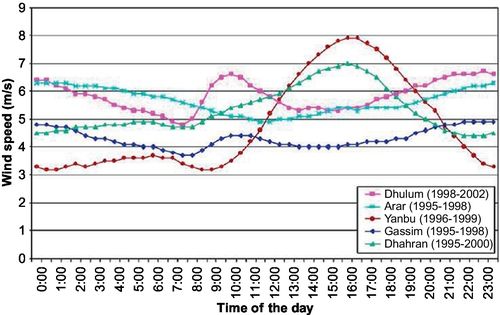
The typical overall diurnal variation of wind speed with time at five different locations in Saudi Arabia is illustrated in Figure 4.8. The coastal sites (i.e., Yanbu and Dhahran) experienced similar characteristics, where wind speed is high during the hours 13:00-18:00. That makes wind energy a potential tool for electrical peak shaving during the hours of high air-conditioning demand load. Figure 4.8 shows similar profiles for inland sites, Gassim and Dhulum. These sites are located in the mid and mid-south of the country. At these sites, the wind speed peaks twice: the highest peak occurs around midnight, and the second occurs during the late morning hours (8:00-12:00). The wind speed profile of the site Arar showed peculiar behavior compared to the others.
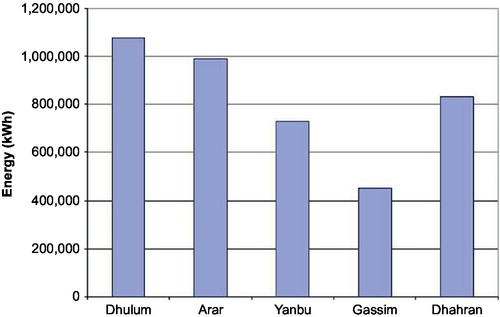
An estimated annual energy that can be generated at the five sites by a typical wind turbine, Nordex N43/600, was obtained using the wind power curve of the turbine (Nordex, 2003) and 1-year wind duration data recorded at the sites. Table 4.3 summarizes the technical data of the wind machine used. Because the hub height of the wind machine is 50 m, 1/7th power law was used to calculate the half-hourly mean wind speed values. Figure 4.9 illustrates a comparison of the annual energy that can be generated using the Nordex N43. It shows that at the Dhulum site, the calculated annual energy is about1080 and 990 MWh at Arar. For Dhahran and Yanbu, the annual energy values are 833, 730 MWh, respectively, while at the Gassim site, the Nordex N43 only produces about 454 MWh.
Table 4.3
Technical Data of Wind Machine from Nordex N43/600
| Cut-in speed (m/s) | 3 |
| Cut-out speed (m/s) | 25 |
| Rates speed (m/s) | 13.5 |
| Survival speed (m/s) | 70 |
| Rated output (kW) | 600 |
| Hub height (m) | 50 |
| Rotor diameter (m) | 43 |
As of today, Saudi Arabia does not have any wind power installed capacity, but is expected to achieve a cumulative capacity of 11 GW by 2032.
4.5 Description of Major ESS
The ESS can be divided into two categories based on function and form. In terms of function, ESS technologies can be categorized into those that are intended first for high power ratings with a relatively small energy content, making them suitable for power quality or UPS, and those designed for energy management, as shown in Figure 4.1.
Because this report concentrates on energy storage devices for stationary applications needed for energy management based on the renewable energy program, ESS for power quality management that last for few seconds to minutes as well as portable and transport applications are excluded, with exceptions made for technologies that may have dual uses. Figure 4.10 compares the various energy storage technologies for the largest power and duration periods for which they are expected to be applied. Note that superconducting magnetic energy storage (SMES) and a few other devices that are only used for high power applications are also included to indicate the differences between the power quality management and energy management applications.

Large-scale energy storage systems provide significant advantages to electric power systems, including load following, peak power, and standby reserve. The role of ESS becomes more important in renewable energy systems, as PV and wind are not available during extended periods of time. It is generally agreed that no more than about 20% of a region's demand can be provided by intermittent renewables without energy storage (Cavallo, 2001). Denholm et al. (2004) presented the results of a life cycle assessment that evaluates the energy requirements and greenhouse gas emissions resulting from the construction and operation of energy storage systems. Kaldellis and Zafirakis (2007) remarked that to bypass the electrical grid stability constraints arising from extensive RES utilization, the adaptation of an appropriate energy storage system is essential.
The electricity storage technologies suitable for “energy management applications” that are available in the market and needs assessment for storing electrical energy from renewable sources are described in the following paragraphs.
4.5.1 Chemical/Electrochemical Systems
The oldest and most established way of storing electrical energy is in the form of chemical energy storage systems. One of the main features of this form of energy storage is that it has very high efficiency due to no moving parts in the system. However, the biggest challenges that have been experienced by electrochemical storage technologies are their inability to cycle repeatedly in a deep discharge fashion, with sufficient reliability, efficiency, and better economics.
• Zinc bromine (ZnBr) batteries
• Polysulfide bromide (PSB) batteries
• Vanadium redox battery (VRB)
2. Sodium-sulfur (NaS) batteries
3. Lithium-ion (Li-ion) batteries
4. Nickel-cadmium (Ni-Cd) batteries
5. Metal air batteries
6. Lead-acid (LA) batteries
7. Liquid battery developed by MIT
4.5.2 Electrical Systems
This involves storing electrostatic energy in different forms.
• SMES is a niche technology for power quality and especially high-power distribution or transmission networks. Projected costs for bulk storage, however, show it to be expensive.
• Electrochemical capacitors (supercapacitors)
Because SMES and supercapacitors are generally meant for power quality purposes, as can be observed in Figure 4.10, these ESS will not be further discussed.
4.5.3 Mechanical Systems
Electricity is stored in the form of kinetic energy or potential energy.
• Flywheel energy storage is a good match for a range of short-term applications up to a size of several MW.
• CAES requires some type of geologic feature for storage.
• Pumped hydroelectricity storage (PHS) is best for load management when geology is available and response time in the order of minutes is acceptable. However, PHS of electricity facilities requires a lot of space and a significant water resource.
4.5.4 Thermal Systems
The principle of this type of energy storage is that the electricity available from renewables or from the grid at off-peak hours is used to heat a material (e.g., molten salts) that has thermal properties that allow the heat to be stored. This heat is utilized when the demand is high, usually by generating steam, which is in turn used to power a steam turbine or it could be used in heating/cooling systems.
4.5.5 Salient Features of Selected ESS for Renewables
Schoenung (2001) of Sandia National Laboratory presented characteristics and technologies for long- versus short-term energy storage. Applications of energy storage have a wide range of performance requirements. One important feature is storage time or discharge duration. In this study, applications and technologies have been evaluated to determine how storage time requirements match technology characteristics.
The advantages and disadvantages of various ESS are presented in Table 4.4 along with the application type, whether power quality application or energy management application. To store electrical energy generated from renewable sources such as PV cells or wind farms, ESS required are for the duration of hours to days. Therefore, suitable ESS for energy management applications that can be integrated with renewables based on Figure 4.3 and Table 4.4 are as follows:
Table 4.4
Main Features of ESS for Power Quality Applications and Energy Management Applications (ESA, 2009)
| Storage Technologies | Main Advantages (relative) | Disadvantages (Relative) | Power Application | Energy Application |
| Pumped storage | High capacity, low cost | Special site requirement | ||
| CAES | High capacity, low cost | Special site requirement, need gas fuel | ||
| Flow batteries: PSB, VRB, ZnBr | High capacity, independent power and energy ratings | Low energy density |  | |
| Metal-air | Very high energy density | Electric charging is different | ||
| NaS | High power and energy densities, high efficiency | Production cost, safety concerns (addressed in design) | ||
| Li-ion | High power and energy densities, high efficiency | High production cost, requires special charging circuit |  | |
| Ni-Cd | High power and energy densities, efficiency |  | ||
| Other advanced batteries | High power and energy densities, high efficiency | High production cost |  | |
| Lead-acid | Low capital cost | Limited cycle life when deeply discharged |  | |
| Flywheels | High power | Low energy density |  | |
| SMES, DSMES | High power | Low energy density, high production cost | ||
| E.C. capacitors | Long cycle life, high efficiency | Low energy density |  |

2. CAES
3. Flow batteries
4. NaS battery
5. NiCd battery
6. LA battery
The main features of the selected ESS are described in the following paragraphs.
4.5.5.1 Pumped Hydroelectricity Storage
Generally, the pumped hydroelectric storage system is used in power plants for load balancing or peak load shaving. This method stores energy in the form of water, pumped from a lower elevation reservoir to a higher elevation. In pumped hydroelectric energy storage systems, water is pumped to a higher elevation and then released and gravity-fed through a turbine that generates electricity. Conventional hydroelectric storage systems rely on natural elevation differentials between water bodies on the Earth's surface to store energy. Most large hydroelectric installations rely on hydraulic heads of at least 150 ft, with average head of about 400 ft. Because head height is proportional to energy, power, and efficiency, a larger head is desirable.
4.5.5.1.1 Process Description
Conventional PHS uses two water reservoirs, separated vertically. During off-peak hours, water is pumped from the lower reservoir to the upper reservoir. When required, the water flow is reversed to generate electricity. Some high-dam hydro plants have a storage capability and can be dispatched as a pumped hydro. Underground pumped storage, using flooded mine shafts or other cavities, is also technically possible. Open sea can also be used as the lower reservoir.
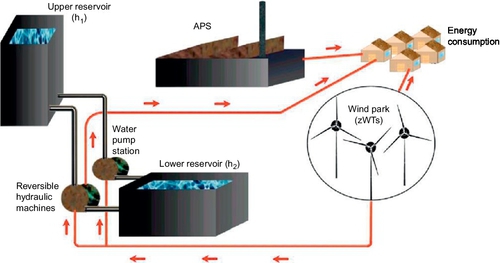
A schematic view of a pumped hydroelectric storage system is shown in Figure 4.11 (Kaldellis et al., 2009). It consists of (i) two reservoirs located at different elevations, (ii) a unit to pump water to the reservoir at high elevation (to store electricity in the form of hydraulic potential energy during availability of renewable power and/or during off-peak hours), and (iii) a turbine to generate electricity with the water flowing from the higher reservoir to the reservoir at low elevation (converting the potential energy to electricity). Clearly, the amount of stored energy is proportional to the difference in height between the two reservoirs and the volume of water stored. Some high-dam hydroelectric power plants have a storage capability and can be dispatched as a PHS. Underground pumped storage, using flooded mine shafts or other cavities, is also technically possible. If the PHS is located near seaside, open sea can be treated as the lower reservoir (Ahearne, 2004).
4.5.5.1.2 Performance Characteristics
• The self-discharge (energy dissipation) per day for PHS has a very small self-discharge ratio, so it is suitable for a long storage period.
• PHS has a cycle efficiency of 60-90%.
• The energy density of PHS is among the lowest, below ~ 30 Wh/kg.
• PHS has a long cycle life. This technology is based on conventional mechanical engineering, and the lifetime is mainly determined by the lifetime of the mechanical components.
4.5.5.1.3 Pumped Hydro Storage Applications
The typical rating of PHS is about 1000 MW (100-3000 MW), and facilities continue to be installed worldwide at a rate of up to 5 GW per year. The rating of PHS is the highest all over the available ESS, hence it is generally applied for energy management, frequency control, and provision of reserve. Since the first use in Italy and Switzerland in the 1890s and the first large-scale commercial application in the United States in 1929 (Rocky River PHS plant, Hartford), there are now over 200 units and 100 GW of PHS in operation worldwide (Ahearne, 2004; Linden, 2003) (32 GW installed in Europe, 21 GW in Japan, 19.5 GW in the United States, and others in Asia and Latin America), which is about 3% of global generation capacity (ESA, 2009). Pumped storage is the most widespread energy storage system in use on power networks. Its main applications are for energy management, frequency control, and provision of reserve.
4.5.5.1.4 Advantages/Disadvantages
PHS is a mature technology with large volume, long storage period, high efficiency, and relatively low capital cost per unit of energy. Owing to the small evaporation and penetration, the storage period of PHS can be varied, from typically hours to days and even years. Taking into account the evaporation and conversion losses, 71-85% of the electrical energy used to pump the water into the elevated reservoir can be regained.
The major drawback of PHS lies in the scarcity of available sites for two large reservoirs and one or two dams. Long lead time (typically 10 years) and high cost (typically hundreds to thousands of million US dollars) for construction and environmental issues (e.g., removing trees and vegetation from the large amounts of land prior to the reservoir being flooded) (Denholm et al., 2004; Denholm and Holloway, 2005) are the other three major constraints in the deployment of PHS. Many pumped hydroelectric systems can have negative impacts on land and wildlife. Disruption of fish spawning routes or creation of large reservoirs that fill canyons or gorges are common concerns. In general, in geographically flat places, PHS may be difficult to use or may not be used at all.
The construction of PHS systems inevitably involves destruction of trees and green land for building reservoirs. The construction of reservoirs could also change the local ecological system, which may have environmental consequences.
4.5.5.1.5 Commercial Maturity
PHS is a matured technology and has been in use for more than 100 years. Pump hydroelectricity installations that are 1000 MW and larger are shown in Table 4.5.
Table 4.5
Pumped HydroElectricity Installations Worldwide (1000 MW and Larger)
| Location | Plant Name | On-Line Data | Hydraulic Head (m) | Max Total Rating (MW) | Hours of Discharge | Plant Cost |
| Australia | Tumut 3 | 1973 | 1690 | |||
| China | Tianhuangping | 2001 | 590 | 1800 | $1080 M | |
| Guangzhu | 2000 | 554 | 2400 | |||
| France | Grand Maison | 1987 | 955 | 1800 | ||
| Germany | Marker sbach | 1981 | 1050 | |||
| Goldisthal | 2002 | 1060 | $700 M | |||
| Iran | Siah Bisheh | 1996 | 1140 | |||
| Italy | Piastra Edolo | 1982 | 1260 | 1020 | ||
| Chiotas | 1981 | 1070 | 1184 | |||
| Presenzano | 1992 | 1000 | ||||
| Lago Delio | 1971 | 1040 | ||||
| Japan | Imaichi | 1991 | 524 | 1050 | 7.2 | |
| Okuyoshino | 1978 | 505 | 1240 | |||
| Kazunogowa | 2001 | 714 | 1600 | 8.2 | $3200 M | |
| Matanogawa | 1999 | 489 | 1200 | |||
| Ohkawachi | 1995 | 411 | 1280 | 6 | ||
| Okukiyotsu | 1982 | 470 | 1040 | |||
| Okumino | 1995 | 485 | 1036 | |||
| Okutataragi | 1998 | 387 | 1240 | |||
| Shimogo | 1991 | 387 | 1040 | |||
| Shin Takesagawa | 1981 | 229 | 1280 | 7 | ||
| Shin Toyne | 1973 | 203 | 1150 | |||
| Tamahare | 1986 | 518 | 1200 | 13 | ||
| Luxembourg | Vianden | 1964 | 287 | 1096 | ||
| Russia | Zagorsk | 1994 | 539 | 1200 | ||
| Kaishador | 1993 | 1600 | ||||
| Dneister | 1996 | 2268 | ||||
| South Africa | Drakensbergs | 1983 | 473 | 1200 | ||
| Taiwan | Minghu | 1985 | 310 | 1008 | $866 M | |
| Mingtan | 1994 | 380 | 1620 | $1338 M | ||
| UK/Wales | Dinorwig | 1984 | 545 | 1890 | 5 | $310 M |
| USA/CA | Castaic | 1978 | 350 | 1566 | 10 | |
| USA/CA | Helms | 1984 | 520 | 1212 | 153 | $416 M |
| USA/MA | Northfield MT | 1973 | 240 | 1080 | 10 | $685 M |
| USA/Ml | Ludington | 1973 | 110 | 1980 | 9 | $327 M |
| USA/NY | Blenhein-Gilboa | 1973 | 340 | 1200 | 12 | $212 M |
| USA/NY | Lewiston (Niagara) | 1961 | 33 | 2880 | 20 | |
| USA/SC | Bad Creek | 1991 | 370 | 1065 | 24 | $652 M |
| USA/TN | Racoon Mt | 1979 | 310 | 1900 | 21 | $288 M |
| USA/VA | Bath County | 1985 | 380 | 2700 | 11 | $1650 M |

Source: ESA (2009)
4.5.5.1.6 Cost
Capital cost is one of the most important factors for the industrial take-up of the ESS. It is expressed in terms of cost per kW, per kWh, and per kWh per cycle. All the costs per unit energy shown here have been divided by the storage efficiency to obtain the cost per unit of output energy. The per-cycle cost is defined as the cost per unit energy divided by the cycle life, which is one of the best ways to evaluate the cost of energy storage in a frequent charge/discharge application such as load leveling. The costs of operation and maintenance, disposal, replacement, and other ownership expenses are not considered, because they are not available for some emerging technologies (Haisheng et al., 2009).
4.5.5.1.7 Developers/Suppliers
Corporate Headquarters
380 Interlocken Crescent
Suite 200, Broomfield, Colorado USA 80021
4.5.5.2 Compressed Air Energy Storage
Off-peak (low-cost) electrical power is used to compress air into an underground air-storage “vessel” (the Norton mine), and later the air is used to feed a gas-fired turbine generator complex to generate electricity during on-peak (high-price) times.
4.5.5.2.1 Process Description
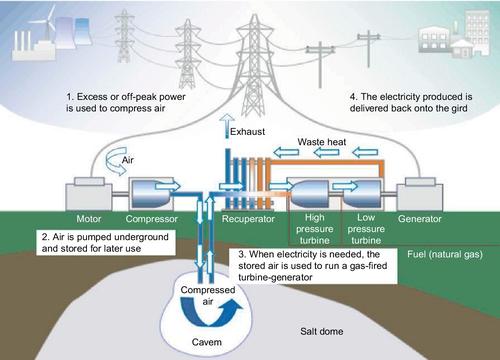
Off-peak electricity is used to power a motor/generator that drives compressors to force air into an underground storage reservoir. Figure 4.12 shows a schematic diagram of a CAES system (Jewitt, 2005; McDowall, 2004). It consists of five major components: (1) a motor/generator that employs clutches to provide alternate engagement to the compressor or turbine trains; (2) an air compressor of two or more stages with intercoolers and aftercoolers, to achieve economy of compression and reduce the moisture content of the compressed air; (3) a turbine train, containing both high- and low-pressure turbines; (4) a cavity/container for storing compressed air, which can be underground rock caverns created by excavating comparatively hard and impervious rock formations, salt caverns created by solution- or dry-mining of salt formations, and porous media reservoirs made by water-bearing aquifers or depleted gas or oil fields (e.g., sandstone and fissured lime); and (5) equipment controls and auxiliaries such as fuel storage and heat exchanger units.
CAES works on the basis of conventional gas turbine generation. It decouples the compression and expansion cycles of a conventional gas turbine into two separated processes and stores the energy in the form of elastic potential energy of compressed air (Haisheng et al., 2009). During low demand, electrical energy is stored by compressing air into an airtight space, typically 4.0-8.0 MPa. To extract the stored electrical energy, compressed air is withdrawn from the storage vessel, heated, and then expanded through a high-pressure turbine. Thus, it captures some of the energy in the compressed air. The air is then mixed with fuel and combusted with the exhaust-expanded air through a low-pressure turbine. Both the high- and low-pressure turbines are connected to a generator to produce electricity.
4.5.5.2.2 Performance Characteristics
• The self-discharge (energy dissipation) per day for CAES has a very small self-discharge ratio, so it is suitable for a long storage period.
• CAES has a cycle efficiency of 60-90%.
• CAES has medium energy density.
• CAES has a long cycle life. This technology is based on conventional mechanical engineering, and the lifetime is mainly determined by the lifetime of the mechanical components.
4.5.5.2.3 Applications
The concept of CAES to help generate electricity is more than 30 years old. Two plants currently exist: an 11-year-old plant (110 MW) in McIntosh, Alabama, and a 23-year-old plant (290 MW) in Germany, both in caverns created by salt deposits. The construction took 30 months and cost $65 M (about $591/kW). It takes about 1.5-2 years to create such a cavern by dissolving salt. This unit comes on line within 14 min. The third commercial CAES, the largest ever, is a 2700 MW plant that is planned for construction in Norton, Ohio. This 9-unit plant will compress air to 1500 psi in an existing limestone mine some 2200 ft underground.
4.5.5.2.4 Advantages/Disadvantages
In a conventional power plant, nearly two-thirds of the natural gas is consumed by a typical natural gas turbine because the gas is used to drive the machine's compressor. In contrast, a compressed air storage plant uses low-cost heated compressed air to power the turbines and create off-peak electricity, conserving some natural gas.
However, compressed air has safety concerns, mainly the catastrophic rupture of the tank. Highly conservative safety codes make this a rare occurrence at the trade-off of higher weight. Codes may limit the legal working pressure to less than 40% of the rupture pressure for steel bottles (safety factor of 2.5), and less than 20% for fiber-wound bottles (safety factor of 5).
CAES is based on conventional gas turbine technology and involves combustion of fossil fuel, hence emissions can be an environmental concern.
4.5.5.2.5 Commercial Maturity
CAES is a developed technology and is commercially available. However, the actual applications, especially for large-scale utility, are still not widespread. Their competitiveness and reliability still need more trials by the electricity industry and the market.
4.5.5.2.6 Cost
Capital cost is one of the most important factors for the industrial take-up of the ESS. It is expressed in terms of cost per kW, per kWh, and per kWh per cycle. The costs of operation and maintenance, disposal, replacement, and other ownership expenses are not considered, because they are not available for some emerging technologies (Haisheng et al., 2009).
4.5.5.2.7 Developers/Suppliers
Dresser-Rand Company
Energy Storage and Power LLC
Ridge Energy Storage
4.5.5.3 Flow Batteries
Redox flow batteries have received considerable interest over the last 20 years as potentially low-cost and highly efficient energy storage systems for large-scale applications. Preliminary work on redox cells was conducted initially by Kangro and Pieper (1962) and Boeke (1970) to provide an electrically rechargeable bulk energy storage system that is economically feasible and has a high overall efficiency, extended cycle life, and high reliability. Thaller (1976) proposed a practical redox flow battery based on the redox couples Fe2 +/Fe3 + and Cr2 +/Cr3 +. Unfortunately, the Fe/Cr flow cell had problems like cross-contamination of the electrolyte and poor reversibility of the chromium half-cell. To overcome these problems, Skyllas-Kazacos and Grossmith (1987), Skyllas-Kazacos et al. (1986a,b, 1988a,b), and Skyllas-Kazacos and Kazacos (1994)) suggested an all-vanadium redox flow battery employing V(II)/V(III) and V(IV)/V(V) redox couples in the negative and positive half-cell electrolytes, respectively. The vanadium redox cell developed at the University of New South Wales (UNSW) by Skyllas-Kazacos and coworkers (Rahman et al., 2004) is showing great promise as an efficient new energy storage system for a wide range of applications. They identified sulfuric acid as a suitable supporting electrolyte to prepare concentrated vanadium solutions for the VRB.
4.5.5.3.1 Main Features of Vanadium Flow Batteries
The main features of the VRB are shown in Figure 4.13. The cell consists of two compartments separated by a proton exchange membrane that allows protons (H+ ions) to pass but prevents vanadium ions from passing through the membrane. The electrolyte on each side consists of vanadium dissolved in a sulfuric acid solution of concentration 2-3 M. At one electrode, V4 + ion is converted into V5 + ion during discharge of the cell, releasing an electron that is transferred to the electrode in the second compartment, where V3 + ion is converted into V2 + ion with the absorption of an electron. The membrane prevents cross mixing of the electrolytes. Each side of the cell contains an inert electrode made of highly porous carbon felt. The electrolytes, both anolyte and catholyte, are stored in two large external reservoirs. The rechargeable electrolyte is pumped through the inert electrode, where the electrochemical reactions occur.

During charging, electrochemical reactions within the battery stack change the valence of the vanadium, the negative reaction change V(III) to V(II), and the positive reaction change V(IV) to V(V). This process is reversed during the discharge cycle.
In the vanadium redox cell, the following half-cell reactions are involved:
At the negative electrode:
At the positive electrode:
This gives a standard cell potential E° (cell) = 1.26 V at concentrations of 1 mol per liter and at 25 °C. Under actual cell conditions, an open-circuit cell voltage of 1.4 V is observed at 50% state of charge (SOC), while a fully charged cell produces more than 1.6 V at open circuit. The electrolyte for the vanadium battery is 2 M vanadium sulfate in 2.5 M H2SO4, the vanadium sulfate (initially 1 M V (III) + 1 M V (IV)) being prepared by chemical reduction or electrolytic dissolution of V2O5 powder.
The stability of the electrolyte is affected by the operating temperature, SOC, vanadium concentrations, sulfuric acid concentrations, and so on.
A stack of these energy-producing cells can be connected in series in a bipolar manner. The physical size of the battery stack determines the power kW available from the battery, and the volume of the electrolyte in the reservoirs determines the kWh energy storage of the battery (Rahman and Skyllas-Kazacos, 2000).
4.5.5.3.2 Performance Characteristics
Cell lifetimes are expected to be up to 10 years, though cells have run for up to 14,000 cycles. A VRB can be refurbished by replacing the cell stack alone. The reagents and storage tanks should be reusable. During operation, round-trip efficiency is about 75%. Units can run up from zero to full power in several milliseconds. However, other equipment associated with the cell may limit its response time to around 20 mS. A unit can provide instant pulses of energy without the reservoir pumps running, provided it is charged. Charged units can supply up to five times the rated output for limited periods.
4.5.5.3.3 Advantages
The VRB system offers many advantages over conventional LA batteries.
• It has very high efficiency.
• It has reasonable energy density.
• It has high charge/discharge rates.
• It has a long lifespan, independent of state-of-charge and load profiles.
• Instant recharge is possible by replacing the discharged electrolyte with fresh-charged solution, or the solution can be electrically recharged at high rates about 8-10 times faster than for LA batteries.
• The capacity of the battery can be simply increased by adding extra electrolyte to the reservoirs.
• The system can be fully discharged with no adverse effects to the battery.
• The solution life is indefinite and can be recycled continuously, so replacement costs are low and there are no waste disposal problems.
• The vanadium battery system is considered environmentally friendly.
• It requires low maintenance.
• The shelf life is theoretically unlimited.
The battery is insensitive to atmospheric oxygen, has a high 1.4 V cell voltage, and the electrolytes are not mutually destructive. The battery stack electrochemical reactions are all highly efficient with the energy, with efficiencies ranging from 75 to 80%. An accurate state-of-charge determination is possible by measuring the potential of a small open-circuit cell attached to the battery, with some portion of the electrolytes being pumped through it. No complex solid phase changes are involved during charging and discharging, which lead to shedding or shorting in conventional batteries.
Redox flow batteries, and to a lesser extent hybrid flow batteries, have the advantages of flexible layout (due to separation of the power and energy components), long cycle life (because there are no solid-solid phase changes), quick response times (similar to nearly all batteries), no need for “equalization” charging, and no harmful emissions (similar to nearly all batteries). Some types also offer easy state-of-charge determination (through voltage dependence on charge), low maintenance, and tolerance to overcharge/overdischarge.
Additionally, this battery has a feature that allows for some new options not available with LA technology. It is possible to simultaneously charge the battery at one voltage while discharging it at another voltage. This feature can be utilized to make a minimum cost, high efficiency, and maximum power point tracker, or allow the battery to operate as a DC transformer, electrochemically transforming a current and a voltage into a different current and voltage.
Significant interest has been observed recently in VRB system research and applications in different countries. In 2002, a research and development laboratory for VRB was established in Central South University in China with the financial support of Panzhihua Steel Corporation (Huang et al., 2008). Vetter et al. (2010) reported research activities on various redox flow batteries, including VRB, at Fraunhofer Institute for Solar Energy Systems (ISE), Heidenhofstraße, Freiburg, Germany.
Vanadium redox flow battery energy storage research and development work has made new progress. Dalian Institute of Chemical Physics, Chinese Academy of Sciences recently initiated vanadium redox flow battery energy storage research and development to achieve new progress in the successful development of a 1 kW-class vanadium redox flow battery from the storage battery module composed of a 10 kW-class battery system, based on the successfully developed 5 kW all-vanadium flow storage battery module. The module is running stable, with energy efficiency of 78% (Miller, 2009).
4.5.5.3.4 Disadvantages
On the negative side, flow batteries are rather complicated in comparison with standard batteries, as they may require pumps, sensors, control units, and secondary containment vessels. The energy densities vary considerably but are, in general, rather low compared to portable batteries, such as the Li-ion.
4.5.5.3.5 Use of Local Raw Materials
One of the main components of VRB is vanadium electrolyte prepared in 2-3 M sulfuric acid solution. This will utilize sulfur or in turn sulfuric acid as a local raw material. Another component is the conducting polymer that is used in the electrode material.
4.5.5.3.6 Commercialization Status of VRB
Several demonstration VRBs of various sizes have been evaluated in Australia, Japan, and Thailand, where atmospheric temperature does not exceed 40 °C. Vanadium electrolyte optimization studies are being performed to improve the stability of the electrolyte at higher temperatures (Rahman et al., 1996, 2004; Rahman, 1998; Rahman and Skyllas, 1998; Rahman and Skyllas-Kazacos, 2009).
A 5 kW/13kWh vanadium battery system has been installed in a solar demonstration house in collaboration with the Centre for Photovoltaic Devices and Systems, UNSW, and Thai Gypsum Products Co. Ltd., Thailand, and its suitability for application in energy self-sufficient remote housing has been evaluated. Another vanadium battery of 4.1 kW peak power and 3.9 kWh capacity has recently been evaluated as a submarine backup battery for the Department of Defense in Australia, while a golf cart with the 5 kW battery stack mounted on the back and electrolyte tanks under the seat has been undergoing testing at UNSW since 1994. Extensive off-road trials of this battery showed excellent performance over a range of terrains. With 40 l of 1.85 M vanadium electrolyte per half-cell tank, a driving range of 17 km was obtained. The total driving range expected for 3 M vanadium solutions and full tanks containing 60 l each side, therefore, is around 40 km (Menictas et al., 1994).
In 1997, a 200 kW/800 kWh grid-connected vanadium battery was commissioned at the Kashima-Kita Electric Power station in Japan, where it is currently undergoing long-term testing as a load-leveling system. By the beginning of 1998, it had already undergone 150 charge-discharge cycles and was continuing to show high energy efficiencies of close to 80% at current densities of 80-100 mA/cm2.
Skyllas-Kazacos and Kazacos (2009) reported that VRB technology has been technically proven in systems up to 6 MWh; its more widespread commercialization in large grid-connected applications necessitated further cost reductions in membrane materials, cell stack design, and control systems. Brief information about several VRB units currently under evaluation by Sumitomo is given below.
Substation Demonstration System (Load leveling DC 450 kW × 2 h)
This demonstration system installed in Tatsumi Substation of the Kansai Electric Power Co., Inc. is linked to the commercial systems. The large amount of demonstration data obtained through this system has become the basis of the present systems. (Operation start: Dec. 1996)
System for Office Building (Load Leveling AC 100 kW × 8 h)
The system is installed in the head office building of Sumitomo Densetsu Co., Ltd. The electrolyte tank is installed in an underground cistern (dead space). (Operation start: Feb. 2000)
Wind Power Generation Output Stabilization: (Output Stabilization AC 170 kW × 6 h)
The facilities were delivered to NEDO and IAE for the demonstration testing of wind power generation output stabilization. The facilities were constructed next to the wind power generator of Hokkaido Electric Power Co., Ltd. (Operation start: Mar. 2001)
Voltage Sag Protection (Voltage Sag Protection AC 3000kW × 1.5 s; Load Leveling AC 1500 kW × 1 h)
This ESS is constructed for the liquid crystal plant of Tottori SANYO Electric Co., Ltd. When instantaneous voltage sag is caused by lightning or other causes, the system protects low voltage and prevents the manufacturing line from stopping. Under normal conditions, load-leveling operation is conducted. (Operation start: Apr. 2001)
PowerPedia: Vanadium Redox Batteries (2009)
The extremely large capacities possible from vanadium redox batteries make them well suited to use in large power storage applications, helping to average out the production of highly variable generation sources such as wind or solar power, or to help generators cope with large surges in demand. Their extremely rapid response times also make them superbly well suited to UPS-type applications, where they can be used to replace LA batteries and even diesel generators.
Currently installed vanadium batteries include
• A 1.5 MW UPS system in a semiconductor fabrication plant in Japan
• A 275 kW output balancer in use on a wind power project in the Tomari Wind Hills of Hokkaido
• A 200 kW, 800kWh output leveler in use at the Huxley Hill Wind Farm on King Island, Tasmania
• A 250 kW, 2 MWh load leveler in use at Castle Valley, Utah
4.5.5.3.7 Cost
Cost estimates of VRBs by the UNSW group and independent consulting groups place mass production costs between $300 and $500 per kW for the cell stack and $30-50 per kWh for the electrolyte (Skyllas-Kazacos, 2006; Hennessy, 2008). It should be noted that apart from cost, the VRB has some additional advantages that were previously discussed. Variation in capital cost of VRBs with storage time is illustrated in Figure 4.14, and a comparison of cost of energy ($/MWh) for VRBs and LA batteries is shown in Figure 4.15. The important feature of this graph is that the cost of each kWh generated by the VRB over its life is considerably lower than that provided by LA batteries for storage times in excess of 1.5 h. This confirms the significant cost benefit of the VRB in applications that require long storage times.


(Total battery costs per kWh versus storage time for stack cost of $AUD 500/kW and V2O5 price of $US5/lb)
4.5.5.4 NaS Battery
4.5.5.4.1 Process Description
An NaS battery consists of liquid (molten) sulfur at the positive electrode and liquid (molten) sodium at the negative electrode as active materials. They are separated by a solid beta alumina ceramic electrolyte (see Figure 4.16). The electrolyte allows only the positive sodium ions to go through it and combines with sulfur to form sodium polysulfides according to the following reaction (ESA, 2009):

The NGK design for the NaS battery is cylindrical. In the center is a pool of molten sodium, which is maintained in a molten state by keeping the cell temperature around 300-350 °C. This pool is contained and surrounded by a cylindrical tube of solid electrolyte, a material called beta alumina, which is surrounded by molten sulfur and the cell container. During discharge, sodium atoms give up electrons to the sodium electrode, becoming sodium ions, which then migrate through the solid beta alumina to the sulfur, where they react to form NaS compounds with the take-up of electrons. Cell reactions are reversed during charging, regenerating the liquid sodium and the liquid sulfur. Open circuit voltage for this cell remains constant for up to 75% of the discharge. The cell is capable of providing short-term currents of up to five times its rated output.
The typical energy and power density of NaS batteries are in the range of 150-240 W/kg. They have a typical cycle life of 2500 cycles. NaS battery cells are efficient (75-90%) and have a pulse power capability over six times their continuous rating (for 30 s). This attribute enables NaS batteries to be economically used in combined power quality and peak shaving applications (Chen et al., 2009).
4.5.5.4.2 Advantages/Disadvantages
The NaS battery is unique among secondary cells in using a solid electrolyte. The cell operates at a high temperature, which enhances transport of ions through the solid. It has up to three times the energy density of a LA battery, its lifetime is longer, and it requires little maintenance. It can utilize sulfur, which is a disposal problem in Saudi Arabia.
The major drawback is that a heat source is required, which uses the battery's own stored energy. This partially reducing battery performance, because the NaS battery needs to operate at a high temperature (300-350 °C), as previously mentioned. High-temperature operation is more costly than operating at ambient temperature, but this cell has several advantages that may outweigh the additional operating costs.
4.5.5.4.3 Cost
Initial capital cost is another issue ($2000/kW and $350/kWh), but it is expected to fall as the manufacturing capacity is expanding.
4.5.5.4.4 Developers/Suppliers and Deployment Status
NaS battery is an advanced secondary battery that was developed by Tokyo Electric Power Company (TEPCO) and NGK Insulators, Ltd. in 1983 (Kamibayashi and Tanaka, 2001). Feasibility studies of various demonstration projects show that the NAS battery technology is attractive for use in relatively large-scale battery energy storage system applications due to its outstanding energy density, efficiency, and zero maintenance.
Typical NaS battery modules developed by NGK have a rated power of 50 kW and rated capacity of 360-430 kWh. A 50 kW unit can supply 100 kW for 2 h and 250 kW for 30 s. The typical rated lifetime is 15 years or 4500 cycles to 90% capacity. DC-DC efficiency is 85%. A NaS module can reach full power output in 1mS. When in standby, a 50 kW unit uses 2-3 kW to maintain its temperature. Table 4.6 shows NaS batteries deployed at various locations in Japan.
Table 4.6
Utility Scale Sodium Sulfur Batteries Deployed in Japan
| Name | Startup | Power (kW) | Storage Capacity (kWh) |
| TEPCO, Tsunashima substation | 1997 | 6000 | 48,000 |
| TEPCO, Ohito substation | 1999 | 6000 | 48,000 |
| TEPCO, Saitama substation | 1999 | 2000 | 16,000 |
| TEPCO, Tsunashima | 2000 | 2000 | 14,400 |
| TEPCO, Pacifico | 2002 | 2000 | 14,400 |
| TEPCO, Fujitsu | 2002 | 3000 | 7200 |

NaS battery technology has been demonstrated at more than 190 sites in Japan, totaling more than 270 MW with stored energy suitable for 6 h daily peak shaving. The largest NaS installation is a 34 MW, 245 MWh unit for wind stabilization in Northern Japan. US utilities have deployed 9MW battery for peak shaving, backup power, firming wind capacity, and other applications, and project development is in progress for an amount equal to Japan's.
The demand for NaS batteries as an effective means of stabilizing renewable energy output and providing ancillary services is expanding. Several projects are under development in Europe, as well as in Japan and the United States. The annual production capacity is 90 MW, 150 MW, planned in 2010 (ESA, 2009).
Efforts are being made to reduce the operating temperature of the NaS battery. Inside Ceramatec's wonder battery is a chunk of solid sodium metal mated to a sulfur compound by an extraordinary, paper-thin ceramic membrane. The membrane conducts ions—electrically charged particles—back and forth to generate a current. The company calculates that the battery will cram 20-40 kWh of energy into a package about the size of a refrigerator, and operate below 90 °C.
4.5.5.5 Ni-Cd Battery
4.5.5.5.1 Process Description
NiCd batteries consists of a positive electrode plate made up of nickel hydroxide, a cadmium hydroxide negative electrode plate, a separator, and an alkaline electrolyte. NiCd batteries generally have a metal case with a sealing plate equipped with a self-sealing safety valve. The positive and negative electrode plates, isolated from each other by the separator, are rolled in a spiral shape inside the case. Ni-Cd batteries rank alongside LA batteries in terms of their commercial maturity (~ 100 years) and popularity.
The chemical reaction is
4.5.5.5.2 Performance Characteristics
The efficiency of a Ni-Cd battery is around 70% for DC-to-DC, although others in the family can provide efficiencies as high as 85%. The cells will self-discharge more rapidly than LA batteries will, and can lose up to 5% of their charge per month. Their lifetime varies, depending on the type of duty for which they are used. With low levels of discharge, Ni-Cd cells can operate for up to 50,000 cycles. Typical cells are rated for lifetimes of 10-15 years but can operate for longer. This drops, however, if the operating temperature becomes elevated. However, they are good for operations at low temperatures.
4.5.5.5.3 Cost
Ni-Cd battery system costs are expected to be higher than the cost of LA batteries because the cells themselves are more expensive. The Fairbanks battery energy storage plant costs around $30 m for a plant with a rated power of 27 MW, providing a unit cost of $1110/kW. EPRI-DOE estimates suggest that in 2003, the cost per kWh for batteries was around $1200/kWh for a 5 MW plant, while total plant cost was $1780/kW. This is significantly higher than the estimated cost of LA cells previously quoted.
4.5.5.5.4 Advantages/Disadvantages
NiCd batteries are robust and reliable, and they have reasonable energy density (50-75 Wh/kg) and very low maintenance requirements, but relatively low cycle life (2000-2500). These advantages over LA batteries make them favored for power tools, portable devices, emergency lighting, UPS, telecoms, and generator starting. However, over the past decade, portable devices such as mobile telephones, tablets, and laptops have been effectively displaced from these markets by other electrochemistries.
The main drawback of NiCd batteries is their relatively high cost (~$1000/kWh), due to the expensive manufacturing process. Besides, cadmium is a toxic heavy metal and has issues associated with the disposal of Cd from waste NiCd batteries. NiCd batteries also suffer from the “memory effect,” where the batteries will only take full charge after a series of full discharges. Proper battery management procedures can help mitigate this effect.
4.5.5.5.5 Developers/Suppliers and Deployment Status
The NiCd system is the “world's largest (most powerful) battery,” installed at Golden Valley, Fairbanks, Alaska, United States (Breeze, 2009). The system is rated at 27 MW for 15 min, 40 MW for 7 min, and with an ultimate 46 MVA limitation imposed by the power converter. The batteries are expected to perform 100 complete and 500 partial discharges in the system's 20-year design life. The system provides critical spinning reserve functionality in what is effectively an “electrical island.”
4.5.5.6 LA Battery
4.5.5.6.1 Process Description
LA batteries, invented in 1859, are the oldest and most widely used rechargeable electrochemical devices. A LA battery consists of (in the charged state) electrodes of lead metal and lead oxide in an electrolyte of about 37% (5.99 M) sulfuric acid.
The chemical reactions are (charged to discharged)
Anode (oxidation):
Cathode (reduction):
Because of the open cells with liquid electrolyte in most LA batteries, overcharging with excessive charging voltages will generate oxygen and hydrogen gas by electrolysis of water, forming an explosive mix. The acid electrolyte is also corrosive.
The cell reaction in a LA battery involves lead (Pb), lead oxide (PbO2), and sulfuric acid (H2SO4). One electrode of the cell is composed of lead oxide and the other of lead (usually in an alloy form to make it more tractable). During discharge of the cell, lead dissolves into the electrolyte at one electrode, releasing electrons that are transferred to the second electrode via an external circuit, where they are taken up by lead oxide, which also thereby dissolves into the sulfuric acid electrolyte. This depletes the active material on both the electrodes and the concentration of the sulfuric acid, and eventually the cell can produce no more electricity. Charging the cell reverses both these processes, depositing lead on one electrode and lead oxide on the other, while regenerating the sulfuric acid.
4.5.5.6.2 Performance Characteristics
Efficiency of LA batteries depends on a number of factors, including temperature variation and depth of charge. Typical efficiencies range between 75% and 85% for DC-DC cycling. Cells will lose charge over time due to a small but significant electrical conductivity of the electrolyte. This will increase with temperature, increasing the self-discharge rate. At low temperatures, performance will drop off too, with capacity falling as the temperature falls. At very low temperatures the electrolyte can freeze, so the optimum temperature of operation is 25 °C. The typical lifetime for a LA battery is around 5 years or up to 1000 charge-discharge cycles, though this depends on the way the cells are used. Batteries designed for utility applications can have lifetimes of 15-30 years.
There are several types of LA batteries, including the flooded battery requiring regular topping up with distilled water, the sealed maintenance-free battery having a gelled/absorbed electrolyte, and the valve-regulated battery. It is a popular storage choice for power quality, UPS, and some spinning reserve applications. Its application for energy management, however, has been very limited due to its short cycle life (500-1000 cycles) and low energy density (30-50 Wh/kg) due to the inherently high density of lead.
4.5.5.6.3 Cost
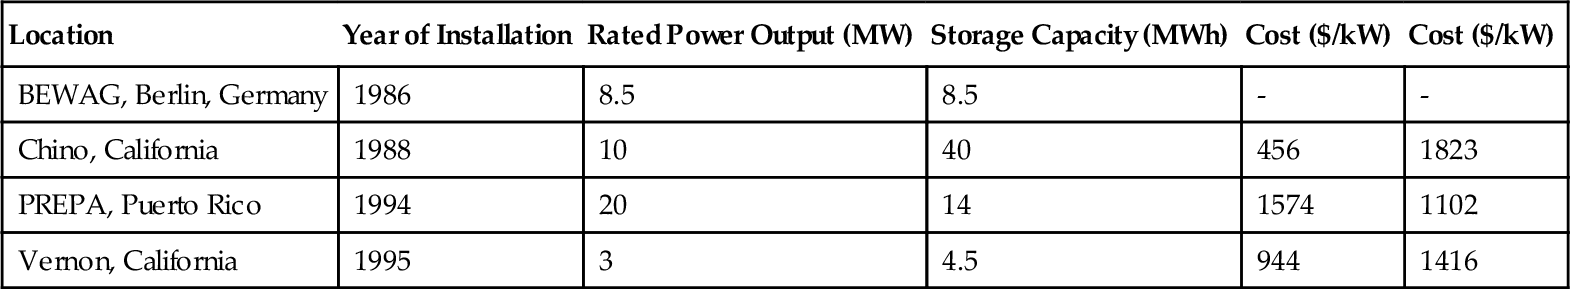
The current cost of utility-scale LA battery facilities is a matter for conjecture. Recent estimates suggest that such plants can be built for $200-580/kW. However, the costs for the plants in Table 4.7 were between $1100 and $1800/kW, significantly higher. All the plants in the table were first-of-kind designs, and costs might be expected to be high. More significant for a storage plant is the cost per kWh. For the plants listed in Table 4.7, this was between $456 and $1574/kWh, an extremely wide range that probably again reflects their first-of-kind status. More recent cost estimates obtained by EPRI-DOE, based on 2003 prices, suggest that costs were between $320 and $1260/kW for the batteries and basic interconnections and racks. The power converter system added a further $150-220/kW and balance of plant another $100/kW, putting the total cost between $570 and $1580/kW. The estimated cost/kWh for systems with capacities of 10 MW, 10 MWh and 10 MW, 40 MWh in 2003 was $590/kWh and $393/kWh.
4.5.5.6.4 Advantages/Disadvantages
LA batteries have high reliability. One of the major problems with LA batteries is that they produce hydrogen and oxygen during charging (by electrolysis of water), once the charging voltage exceeds a certain value. Because a rise in voltage is inevitable as the cell charges, the generation of gas cannot be avoided. Some cell designs simply allow the gas to escape. Such cells are normally called flooded cells because the electrodes are “flooded” with sulfuric acid electrolyte, and the water level is topped up regularly to take account of the loss through electrolysis. The alternative is the valve-regulated LA cell, sometimes also called the sealed LA cell. These use special design features to encourage the hydrogen and oxygen generated by the cell to recombine into water, while releasing any excess gas that does not recombine through a control valve. LA batteries also have a poor low-temperature performance, and therefore require a thermal management system.
4.5.5.6.5 Developers/Suppliers and Deployment Status
Delco
East Penn
Teledyne
Optima Batteries
Winston Salem
JCI Battery Group
Trojan
Crown Battery
A number of large-scale LA battery-based utility storage plants have been built, though none recently. Details of these are collected in Table 4.7. The earliest modern LA storage plant was built by the Berlin utility BEWAG to provide peak power and grid support on what was then an island grid in West Berlin. This unit has a rated power of 8.5 MW, which it could supply for up to 1 h. Output could be doubled to 15 MW, but this could only be maintained for 20 min. The plant operated successfully, with few problems. The largest one is a 40 MWh system in Chino, California (USA), which works with a rated power of 10 MW for 4 h (Moore and Douglas, 2006).
4.6 Assessment of ESS Technologies
Ibrahim and Ilinca (2013) presented a techno-economic analysis of different energy storage technologies. They indicated that the study of complete systems (energy storage, associated transformation of electricity, power electronics, control systems, etc.) will lead to the optimization of techniques in terms of cost, efficiency, reliability, maintenance, social and environmental impacts, and so on.
Schoenung (2001) of Sandia National Laboratory presented characteristics and technologies for long- versus short-term energy storage. Applications of energy storage have a wide range of performance requirements. One important feature is storage time or discharge duration. This study focuses on technologies that are more relevant to renewable electrical energy storage for Saudi Arabian conditions.
Figure 4.10, presented in Section 4.5 compares the various energy storage technologies for the largest power and duration periods for which they are expected to be applied. It can be observed that for energy management, PHS, CAES, NaS, flow batteries, NiCd, and LA are suitable for applications in scales between 1 and 100 MW, with hourly to daily output durations. Note that SMES and a few other devices that are only used for high-power applications are also included to indicate the differences between the high-power and high-energy storage devices. Figure 4.17 illustrates the commercial maturity of some of the ESS discussed above, and Figure 4.18 shows the installed power capacities as of 2008.


Table 4.8 presents the main features of different ESS. For Saudi Arabia, the PHS and CAES that have special site requirements besides water and gas fuel are not a viable option, and are therefore eliminated from further discussion. SMES and supercapacitors are more suited for power quality applications for short duration, not for the long duration needed in renewables. Li-ion batteries are expensive and need a special circuit for charging, whereas renewables require large-scale, low-cost ESS.
Table 4.8
Main Features of Different ESS [ESA, 2009]
| Technology | Advantages | Disadvantages | Commercial Maturity | Application | Cost | Remarks | |
| Mechanical energy storage | Pumped storage hydro (PSH) | High capacity, low efficiency | Special site requirement | High | Energy management | Low cost | Suitable for load leveling |
| Compressed air energy storage (CAES) | High capacity | Special site requirement need gas fuel | High | Energy management | Low cost | Suitable for load leveling | |
| Fly wheel | High power | Low energy density | High | Power quality management | Suitable for short duration in sec or min (voltage dip) | ||
| Electrical energy storage | Capacitors/supercapacitors | Long cycle life/high efficiency | Low energy density | Medium | Power quality management | Suitable for short duration in sec or min (voltage dip) | |
| Superconducting magnetic energy storage (SMES) | High power | Low energy density and high production cost | Medium | Power quality management | High production cost | Suitable for short duration in sec or min (voltage dip) | |
| Chemical energy storage | Lead-acid | Limited cycle life when deeply discharged | High | Low capital cost | Renewables & power plants | ||
| Flow batteries: VRB, ZnBr, PSB | High capacity, independent power and energy ratings | Low energy density | Medium | Power quality & energy management | Renewables & power plants | ||
| NiCd | High power/high efficiency | High energy density, high cost | HIgh | Power quality & energy management | Renewables & power plants | ||
| Li-ion | High power/high efficiency | High cost and needs special charging circuit | Medium | Power quality management | Power quality management | ||
| Metal-air | Electrically not re-chargeable | ||||||
| NaS | Medium | Power quality & energy management | Renewables & power plants |
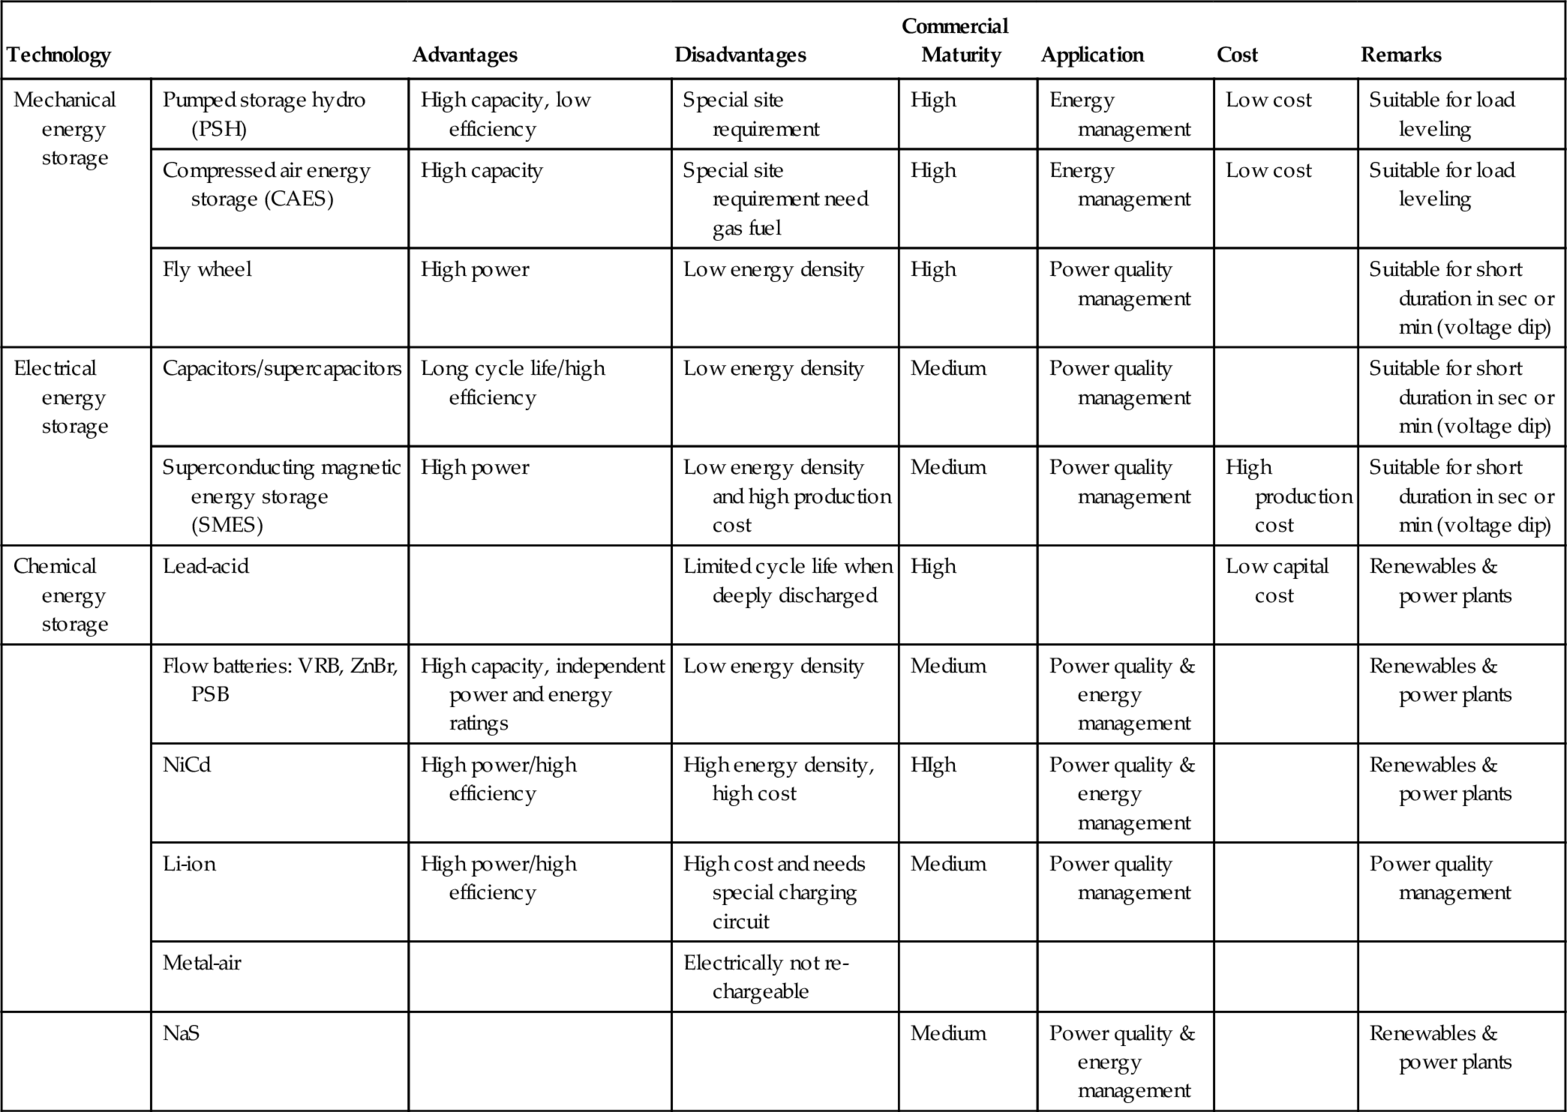
The competing ESS technologies for stationary applications to utilize renewables are LA, flow batteries, NaS, and NiCd. These ESS will be further assessed in terms of their properties. Table 4.9 presents major characteristics of the six ESS. Among the flow batteries, VRBs appear to be better than PSB and ZnBr, as they are of low capacity and low cycle life. Efficiency-wise, VRBs are also slightly better. VRBs are distinct from hybrid flow batteries (e.g., ZnBr, NaS) that have one reactive electrode and therefore suffer from the degradation drawbacks of conventional batteries. Using only vanadium in the electrolyte, as opposed to a blend of electrochemical elements, gives VRB systems the most competitive advantage in terms of operating cost, system life, maintenance, and safety. Size and weight of storage devices are important factors for certain applications, but for large-scale stationary applications such as renewables, they are not considered.
Table 4.9
Main Features of Competing ESS Technologies [Chen, 2009]
| Technology | VRB | PSB | ZnBr | NaS | NiCD | Lead Acid |
| Efficiency (%) | 85 | 75 | 75 | 89 | 60-65 | 65 |
| Cycle life charge/discharge | 13,000 | NA | 25,000 | 3000 | 2500 | 1000 |
| Size range (MW) | 0.5-100 | 1-15 | 0.05-1 | 0.15-10 | 1-10 | 0.001-40 |
| Operation temp (°C) | 0-40 | 50 | 50 | 350 | Ambient | − 5 to 40 |
| Energy density (Wh/kg) | 30 | NA | 50 | 150-240 | 50-75 | 50 |
| Self Discharge | Small | Small | Small | 20% per day | 0.6% per day | 0.3% per day |
| Green | Yes | Yes | No | No | No | |
| Disadvantages | Low energy density | Low cycle life | low cycle life | High temp. system, complex safety design | Heavy metal Cd recycling issues | Issues with mining and processing of lead. Limited cycle life when deeply discharges |
| Remarks | Most promising | 2nd Best |
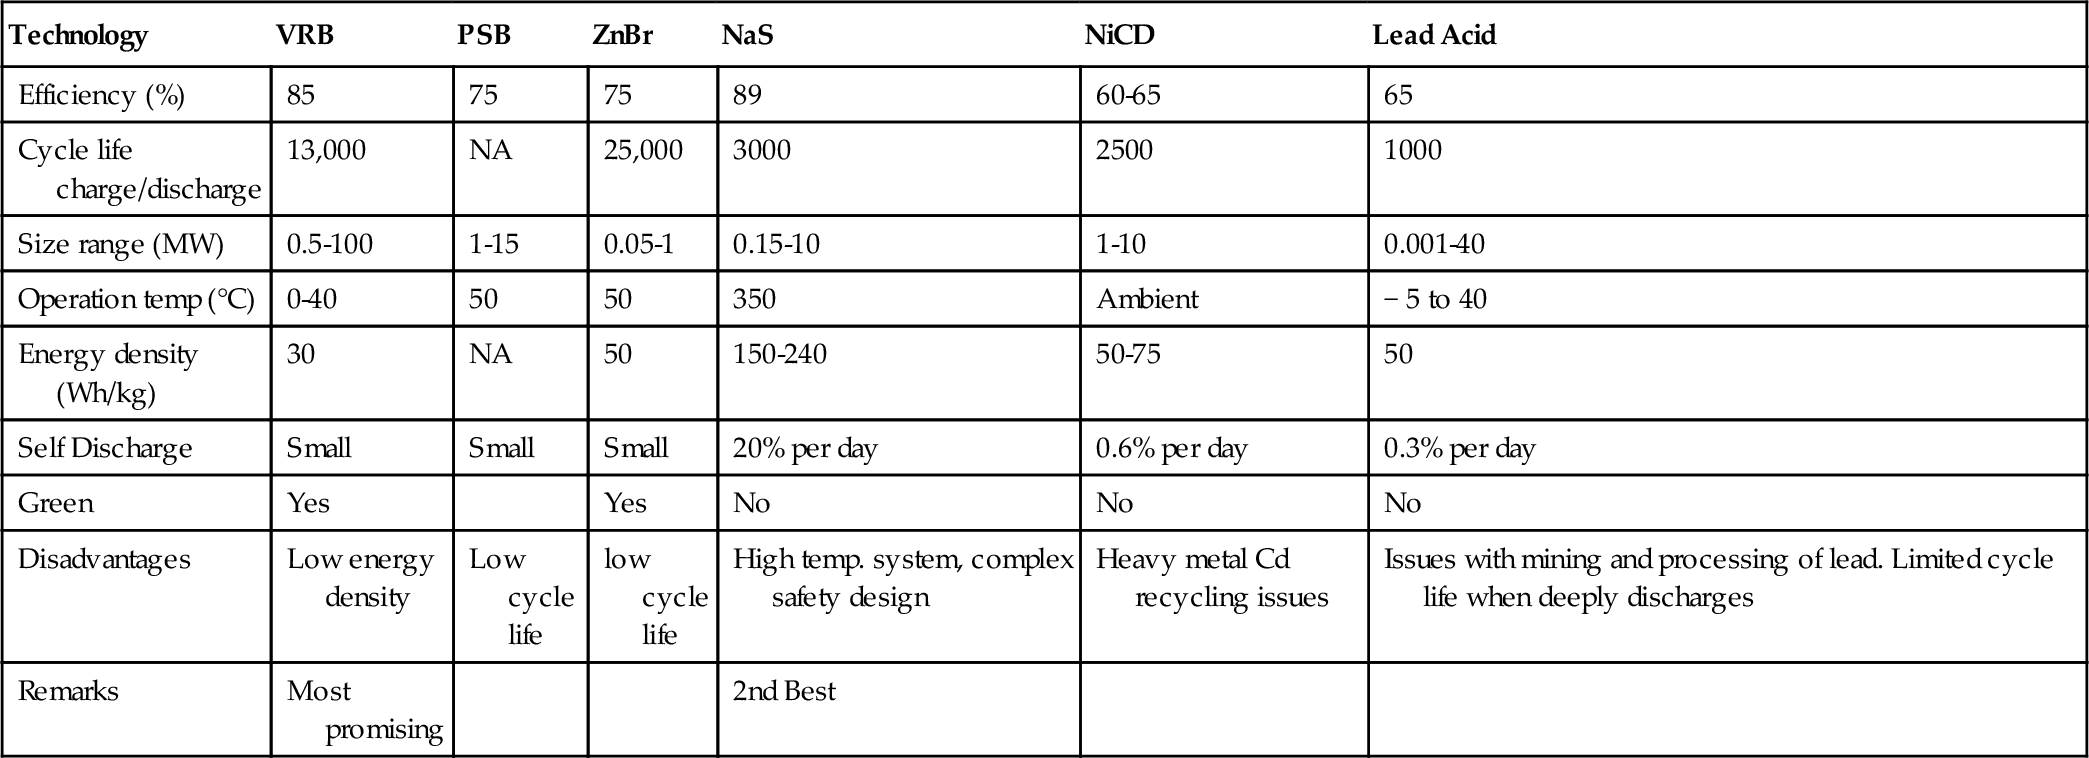
The efficiency and lifetime of selected ESS are illustrated in Figure 4.19. Efficiency and cycle life are two important parameters to consider along with other parameters before selecting a storage technology. Both of these parameters affect the overall storage cost. Low efficiency increases the effective energy cost, as only a fraction of the stored energy could be utilized. Low cycle life also increases the total cost, as the storage device needs to be replaced more often. The present values of these expenses need to be considered along with the capital cost and operating expenses to obtain a better picture of the total ownership cost for a storage technology.

4.7 Economic Evaluation of Selected ESS
The competing ESS technologies for stationary applications to utilize renewables based on technology evaluation appear to be LA, VRB, NaS, and NiCd. The three batteries are basically advanced batteries, and the LA battery is included in the analysis to compare with the currently used ESS. A preliminary economic evaluation was performed based on available cost data.
The capital costs for different ESS are shown in Figure 4.20. The capital costs have been adjusted to exclude the cost of power conversion electronics. The cost per unit energy has also been divided by the storage efficiency to obtain the cost per output (useful) energy. Installation cost also varies with the type and size of the storage and with location. The information here should only be used as a guide, not as detailed data. The costs of storage technologies are changing as they evolve. The cost data in Figure 4.20 are based on approximate values in 2002 and the expected mature values in a few years.

While capital cost is an important economic parameter, it should be realized that the total ownership cost (including the impact of equipment life and operation and maintenance (O&M) costs) is a much more meaningful index for a complete economic analysis. For example, while the capital cost of LA batteries is relatively low, they may not necessarily be the least expensive option for energy management (load leveling) due to their relatively short life for this type of application and their limited depth of discharge (DoD). The capital cost of NiCd is higher than NaS and VRB, and it has a Cd disposal/recycling problem.
Capital cost per cycle is illustrated in Figure 4.21 for the competing ESS technologies. Per-cycle cost can be the best way to evaluate the cost of storing energy in a frequent charge/discharge application, such as renewables and load leveling in power plants. Figure 4.21 shows the capital component of this cost, taking into account the impact of cycle life and efficiency. For a more complete per-cycle cost, one needs to also consider O&M, disposal, replacement, and other ownership expenses, which may not be known for the emerging technologies. It is clear from Figure 4.21 that VRB has the lowest per-cycle cost, followed by NaS, whereas the per-cycle costs for NiCd and LA are relatively high. Because the electrolyte of VRB has indefinite life, and partial refurbishment can increase the battery life, the overall economics of VRB are further improved compared to NaS. Table 4.11 presents the cost data for the selected ESS technologies in terms of $/kW, $/kWh, and cents/kWh per cycle and O&M cost. Based on data presented in Table 4.10 and Figures 4.20 and 4.21, it can be concluded that VRB is the low-cost battery among the four ESS technologies selected.
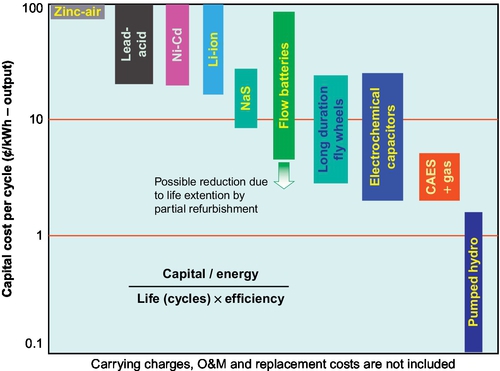
Table 4.10
Cost Comparison of Competing ESS
| Technology | VRB | NaS | NiCd | Lead Acid | Reference |
| Power cost ($/kW) | 600-1500 | 1000-3000 | 500-1500 | 300-600 | Chen et al., 2009 |
| Energy cost ($/kWh) | 150-1000 | 300-500 | 800-1500 | 200-400 | Chen et al., 2009 |
| Cents/kWh-per cycle | 5-80 | 8-20 | 20-100 | 20-100 | Chen et al., 2009 |
| O&M costs ($/kWh) | 0.001 | 0.02 | 0.02 | Huang, 2008 | |
| Overall assessment | Most promising | 2nd best |

Table 4.11
Overall Techno-Economic Evaluation of Competing ESS Technologies
| Overall Comparison of Electricity Storage Technologies | ||||
| Technology | VRB | NaS | NiCd | Lead Acid |
| Efficiency (%) | 85 | 89 | 60-65 | 65 |
| Cycle life charge/discharge | 13,000 | 3000 | 2500 | 1000 |
| Size range (MW) | 0.5-100 | 0.15-10 | 1-10 | 0.001-40 |
| Operation temp (°C) | 0-40 | 350 | Ambient | − 5 to 40 |
| Energy density (Wh/kg) | 30 | 150-240 | 50-75 | 50 |
| Self discharge | Small | 20% per day | 0.6% per day | 0.3% per day |
| Disadvantages | low energy density | High temp. system, complex safety design | Heavy mental Cadmium recycling issues | Issues with lead and limited cycle life |
| Power cost ($/kW) | 600-1500 | 1000-3000 | 500-1500 | 300-600 |
| Cents/kWh-per cycle | 5-80 | 8-20 | 20-100 | 20-100 |
| O&M costs ($/kW h) | 0.001 | 0.02 | 0.02 | |
| Overall assessment | Most promising | 2nd Best | ||
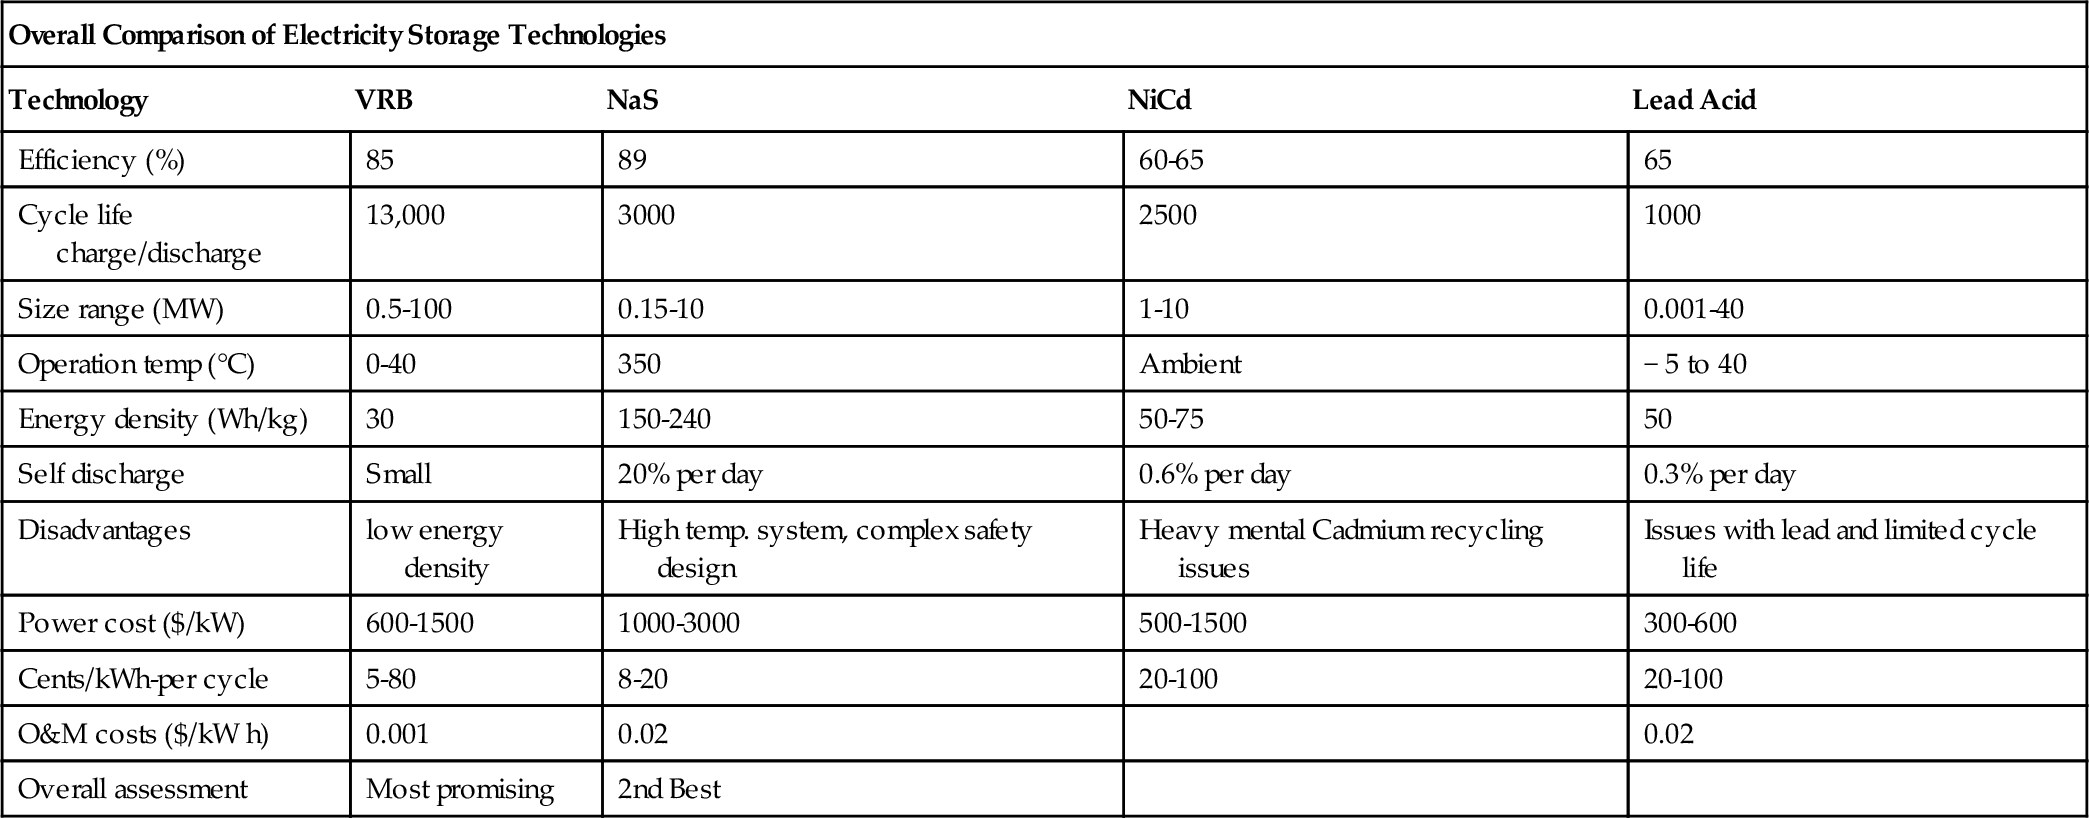
4.8 Conclusions and Recommendations
The use of electricity generated from intermittent renewable sources (solar or wind) requires efficient and cost- effective advanced ESS. ESS will guarantee high power quality, better utilization of existing power generation systems, and efficient dispatchability of renewable sources of energy. The overall techno-economic evaluation of selected ESS technologies is presented in Table 4.11.
Although there are various commercially available ESS systems, no single storage system meets all the requirements for an ideal ESS: maturity, long lifetime, low cost, high density, high efficiency, and environmentally benignancy. Each ESS has a suitable application range.
This study has identified vanadium redox batteries (VRBs) and NaS batteries as appropriate ESS that match the requirements of Saudi Arabia. Specific findings are highlighted:
• Sulfur or sulfur-based compounds are cheap in Saudi Arabia; if utilized, the economics of ESS will improve.
• The maximum atmospheric temperature was found to be 51 °C at Qaisumah and the minimum temperature recorded was − 9 °C at Hail.
• In 2008, the SEC capacities were as follows: peak load, 38,028 MW; installed capacity, 38,808 MW; firm capacity, 34,470 MW; deficit, 3558 MW. This deficiency can be partially supported by ESS.
• The VRB was found to be promising for Saudi conditions. However, the operating temperature range of the electrolyte needs to be increased above 40 °C through further research, by developing additives to improve electrolyte stability.
• NaS is also a suitable battery for Saudi conditions, as its operating temperature is high, around 350 °C.
Based on comprehensive technology assessment, economic evaluation, and Saudi Arabian conditions, it is recommended to initiate research and development work to further improve technology as well as economics. Two ESS that can be considered for further research are VRB and NaS. These advanced energy storage systems can be integrated for storing electrical energy generated from renewable sources to improve dispatchability and reliability.
The future use of electrical energy depends on the development of the next generation of batteries. Batteries are needed to realize the full potential of RESs as part of the electric distribution grid. Existing battery technologies have cost and performance limitations that hinder the rapid transition to efficient use of RESs. Other technical bottlenecks include the limited energy storage capacity of individual battery cells and the lack of fast recharge cycles with long cell lifetimes. To increase the energy storage capacity of each cell significantly, increases in cell voltage and/or in the amount of charge stored reversibly per unit weight and volume are needed. Increasing the cell voltage requires the development of new electrolytes for thermodynamic stability or of surface passivation layers that adjust rapidly to changes in electrode morphology during a fast charge and discharge. The need to mitigate the volume and structural changes of the active electrode sites in a charge-discharge cycle calls for the exploration of new materials that have nanoscale features that could enhance reversible charge storage. Especially exciting is the potential for designing novel multifunctional materials that, for example, would increase the level of energy storage per unit volume and decrease dead weight.
Specifically, recommended research areas for future work are
• Develop novel additives to stabilize electrolyte for VRB to increase the operating temperature range. Optimize the electrolyte composition for Saudi conditions.
• Improve electrode and membrane efficiency for VRB.
• Reduce operating temperature, minimize self-discharge, and improve cycle life in NaS battery.