
Environmental Issues Associated with Solar Electric and Thermal Systems with Storage
Bent Sørensen Department of Environmental, Social and Spatial Change, Roskilde University, Roskilde, Denmark
Abstract
The current status of life-cycle analysis and assessment studies of photovoltaic and thermal solar systems is reviewed, with comments on possible future developments, particularly as regards the energy stores that must form part of any realistic solar energy contribution to future sustainable energy supply systems.
11.1 Introduction
Solar energy systems generally have a complex structure, making it a major task to identify all possible environmental impacts needed for performing a life-cycle analysis and assessment (LCA). On the other hand, such impacts must be estimated and preferably quantified, in order to make a meaningful comparison between solar solutions and other renewable or nonrenewable options. Impacts derive from the solar radiation-collecting device itself, whether converting the radiation into electricity, heat, or both, as well as from the system for mounting the collectors and transporting the energy to load areas, and further from the specific or general system employed to handle the intermittency of the source flow and mismatch between energy production and use, by employing load management, trade between the system considered and other energy systems, or energy storage. One complication is that some of these systems may serve other units in the overall energy systems besides the solar parts, implying a need for a scheme for dividing impacts fairly between segments.
Historically, life-cycle analysis was first made for the collector cells and modules in isolation, and analysis for other components such as framing, power conditioning, and energy storage (the latter being, as mentioned, not dedicated solely to the solar system) were omitted or rather left to be addressed in a total energy system assessment. The early studies of impacts from photovoltaic cell manufacture, such as Boeniger and Briggs (1980), Watt (1993), Sørensen (1993a), Sørensen and Watt (1993), and Moskowitz et al. (1995), found quite sizable environmental and social impacts, but with the expectation that impacts would diminish as the technologies became more mature. At that time, solar technologies were very expensive, not only relative to the prevailing fossil energy costs, but also to the most cost-effective renewable energy solutions, hydro and wind energy. Thus, it was stipulated that a required reduction in material use and energy input in manufacture and in solar panel installation would reduce environmental impacts as well as cost.
Today, solar systems remain fairly expensive despite substantial price drops, but for some applications and locations they are approaching economic viability. It is therefore important to redo the evaluations, which earlier were based on theoretical forecasts of the technology development. The relative impacts of solar, wind, and biofuel options—the three most important renewable energy technologies to consider beyond the nearly exhausted hydro potential—are of great importance for planning a transition to renewable energy through an optimum mix of these options. Although current knowledge makes it clear that the impacts of solar and biofuel options are fairly significant, they remain smaller than those of fossil or nuclear options (Tsoutsos et al., 2005). In addition, the impacts of wind power (as well as its cost at suitable locations) are coming out in many cases as substantially below those of solar solutions (which also depend strongly on the location considered). Although these conclusions are presently emerging, the uncertainty in the assessment is still quite large, and it would seem wise to explore many renewable energy options, both technically and economically, where economic viability is based on the outcome of a full life-cycle evaluation of direct and indirect economic implications.
11.2 Solar Cells
Currently, the most common solar cells installed are crystalline or multicrystalline silicon cells. Amorphous cells seemed promising a while ago, but have not advanced in terms of efficiency or cost. Various photoelectrochemical cells based on dye sensitizing by use of metal complexes or organic dyes have been manufactured but found unreliable and of short average lifetime. The same is true for cells using organic polymers or fullerenes to increase the electron-transfer effective surface area. Scientific journals and magazines contain a flow of articles on new wonder-cells, none of which have so far made it beyond the laboratory. More serious alternatives to silicon in conventional two or more layer cells include CdTe cells and combinations of chemical group 13-15 (III-V in old notation), such as GaAs. Some of these have higher negative impacts than silicon cells, due to smaller global material abundance or to material toxicity.
Manufacture of solar cells involves several chemical and physical processes that may give rise to health and accident risks as well as pollution, and that require input of energy. Ideally, recycling can reduce the environmental impacts, but in return it needs additional energy use. Currently, few schemes for solar panel recycling are in place. Pollution can be reduced by avoiding emissions to air, wastewater, or soil in manufacturing plants, and by proper handling of decommissioned cells. However, experience with solar cell recycling plants and other end-of-life technologies is not yet available.
The manufacturing process has changed since the early solar cells were marketed. Microprocessor scrap is no longer used as silicon raw material, but a less refined stock of “solar-cell-grade” silicon forms the starting point for photovoltaic cell production. This grade of silicon is much less expensive than the microprocessor grade, but more expensive than the former cost of the microprocessor scrap. Multicrystalline cells have today reached a higher market share than monocrystalline cells, and the radiation-to-electricity conversion efficiency has gradually improved. The amorphous cell market is stagnant and the organic cells have left the marketplace after serious lifetime failures. There is still scientific interest in the aforementioned potentially more efficient crystalline cells based on materials other than silicon, eventually using several stacked layers in order to capture more of the range of frequencies present in solar light. In the current marketplace, however, only the CdTe cells have a modest share. They typically have lower efficiency than the silicon cells, but also lower production cost when using thin-film techniques.
11.3 Solar Electricity Systems
Cells are connected into modules and modules are assembled in system arrays, including DC-to-AC inverters, integrated into facades or roofs of buildings, or mounted on frames placed on marginal land. Current installed system costs for building-integrated solar cells are typically 1.8-3.5 €/W of rated power (IEA, 2014; 1 € is presently about $1.1). At latitudes around 30°, the modules typically produce some 1300 Wh of energy per year and per rated W (and in locations with low turbidity and cloud cover more), which works out to an average price of 0.1-0.2 €/kWh, or about half the price level prevailing less than a decade ago.
Environmental impacts comprise a number caused by the particular production processes employed and are therefore different for different types of cells, in regard to labor intensity, energy input, and the need for special substances with associated impacts (e.g., silane for amorphous and chlorosilane for crystalline Si cells, phosphine for doping, and other sets of toxic chemicals for CdTe or GaAs cells). Recycling of as many of the chemicals used in manufacture as possible is essential, as is recycling of decommissioned solar cells (Sørensen, 1993b; 1997). Further impacts relate to the system assembly, including any framing and support, as well as circuitry and inverters. During the operational phase, there are few impacts other than possibly from detergents used for occasional cleaning of the collector surfaces, but during decommissioning, there may again be substantial impacts related to energy input requirements, as well as to handling of the many peculiar substances embedded in the module structure.
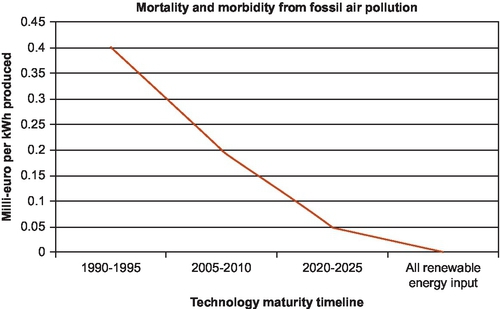
Because of the special need for chemicals known to present dangers such as toxicity, explosion risk, and diseases associated with inhalation of vapors from the processing of photovoltaic (PV) cells, life-cycle analyses were undertaken at an early stage of the solar cell development toward commercialization. However, many of the studies were not complete life-cycle studies, but single-issue analyses, notably of greenhouse gas emissions and energy payback times (an impact that is in principle irrelevant, if the overall full social cost of the system is acceptable). Figures 11.1–11.4 show the life-cycle results for four specific items in the case of multicrystalline Si-cells, taken from an early quantitative investigation pertaining to the 1995 PV development stage (Kuemmel et al., 1997) and aimed toward estimates of future impacts for a fully mature solar manufacturing industry (Sørensen, 2011a), which in the end will use only energy produced by the same kind of cells or other renewable energy sources, for any energy input required during the entire life.


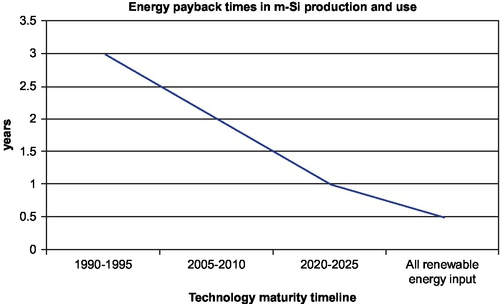
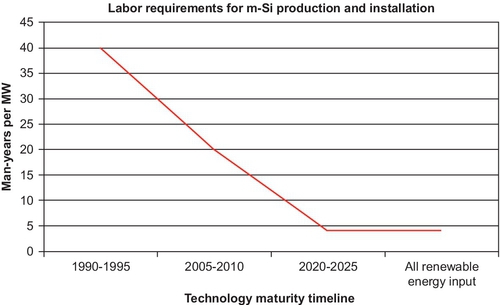
Greenhouse gas emissions and land use were already mentioned in an early study as potentially important impacts (Phéline, 1981), but without quantification. The emission of greenhouse gases shown in Figure 11.1 shows the quantitative effect of continued reduction in quantities of materials and in required energy input to the processes that cells, modules, auxiliaries, mounting, and other installation tasks required. A similar behavior is found for air pollution, initially entirely from the fossil fuels used, but with time from a mix with more renewable energy, as shown in Figure 11.2. The energy payback period is shown in Figure 11.3, exhibiting again the change in energy input mix, not so much associated with maturity of the industry as with the assumption that mitigation of climate change impacts will lead to a reduced use of fossil energy sources, as suggested by several political responses to the already observed negative warming impacts. Figure 11.4 shows the labor required by the photovoltaic industry, becoming reduced as the material and energy input diminishes along with the cost reduction primarily sought.
The aforementioned topical investigations are in agreement with the calculations behind Figures 11.1–11.3. For example, Alsema (2000) finds an energy payback period for late 1999 PV cells and projections for 2010 and 2020 cells that are in substantial agreement with those of Figure 11.3, and Fthenakis and Kim (2011) find CO2, NOx, and SOx emissions for cells produced around 2007 that are very similar to those of Figure 11.1. Alsema’s CO2 emissions agree with ours in 1999 and 2010, but are estimated somewhat higher for 2020.
A central problem in LCA is monetizing. On one hand, there are impacts that are difficult to translate into economic terms but that still appear important for deciding among technologies, and on the other hand, even if valuation is possible, it may greatly increase the uncertainty in the estimate. One example is the effect of global warming caused by anthropogenic uses of fossil energy sources. The emissions (Figures 11.1 and 11.2) are indeed very accurate, but their economic consequences are much more uncertain, due to the range of human activities that are influenced by changing climates. Some of these consequences are discussed in the scientific summary reports of the Intergovernmental Panel on Climate Change, IPCC (2014), and additional impact analysis relevant to life-cycle assessment can be found in Sørensen (2011a). Human lives are affected and lost due to extreme events, agricultural setbacks, altered disease patterns, as well as direct impacts of changed temperature variations, in ways that exhibit large geographical differences. For example, as a result of global warming, fewer lives are lost in Siberia due to cold winters, while more lives are lost in Central Africa due to hot summers. This situation influences traditional methods of economic valuation, where the societal cost of a life lost is different in rich and poor countries. These differences are traditionally determined by gross national product (GNP) or by purchasing power parity estimates, but a fully egalitarian valuation with the same value of a life lost everywhere will typically give the monetized climate change impact a two-orders-of-magnitude-higher value than the mere GNP-adjusted figures (Sørensen, 2011a). Figure 11.5 gives the climate change impact of solar cells as estimated when assuming the valuation of a human life made in a major study for the European Union and used globally. One should note that the methodology for life-cycle assessment that I use considers the economic setback for society when losing one of its members and does not enter into an ethical discussion of the value of a human life.
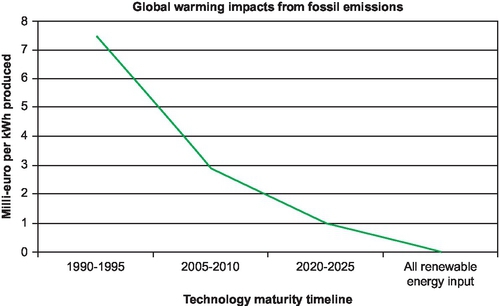
Figure 11.6 shows the results of the analysis regarding the effects of air pollution from the m-Si solar cell life cycle. Here, mortality and morbidity from diseases caused by air pollution are estimated, the latter in terms of workdays or healthy retirement time lost (presented as disability-adjusted shortening of life in years, DALY). Again, the impacts drop to zero if the future energy system is entirely based on renewable energy, as it could well become (Sørensen, 2014).
While Figures 11.1–11.6 give timelines of some important impacts from m-Si solar cell production and use, there are several other impacts that need to be included in a life-cycle assessment, e.g., for comparing different energy solutions (solar, wind, biomass) or choosing the particular technology most beneficial (crystalline or amorphous silicon, CdTe, GaAS, photoelectrochemical solar cells). A range of these is estimated in Tables 11.1 and 11.2, focusing on technical and economical impacts, respectively. Included are the impacts illustrated in the figures, but taken specifically for the present situation (as of 2015). Land use is set at zero, considering that the solar panels considered are building-integrated, although there may be some additional land used by the manufacturing facility. For dedicated solar cell parks, a land use impact must be attributed (e.g., taken as the cost of purchasing the land area). The last box of impact categories contains those that are hard to quantify, such as resilience and supply security. Even if a monetary value cannot be assigned, such considerations may be important for the political decision of choosing between different energy solutions.
Table 11.1
Life-Cycle Physical Impacts from Building-Integrated m-Si Solar PV Systems
| Impact Type: | Uncertainty | |
| Environmental impacts (m-Si based rooftop systems). | Emissions (g/kWh) | |
| Releases from fossil energy in all steps of cycle | For year 2015: | |
| CO2 | 19 | L,g,m |
| SO2 and NOx | 0.08 | L,r,n |
| Special substances (chlorosilanes, metal particles, etc.) | NQ | |
| Land use (for building-integrated system) | 0 | |
| Social impacts | Accidents | |
| Occupational injuries | (10− 9 cases/kWh) | |
| Silicon provision and cell manufacture | ~ 1 | |
| Panel assembling, mounting, and installing | < 1 | |
| Operation | ~ 0 | |
| Decommissioning | < 1 | |
| Economic impacts | Miscellaneous | |
| Energy payback time | 1.5 (y) | |
| Labor requirements | 12 (man-y/MW) | |
| Other impacts | ||
| Supply security (plant availability) | High | |
| Robustness (technical reliability) | High | |
| Global issues (nonexploiting) | Compatible | |
| Decentralization and choice | Good | |
| Institution building (other than required grid) | Modest | |
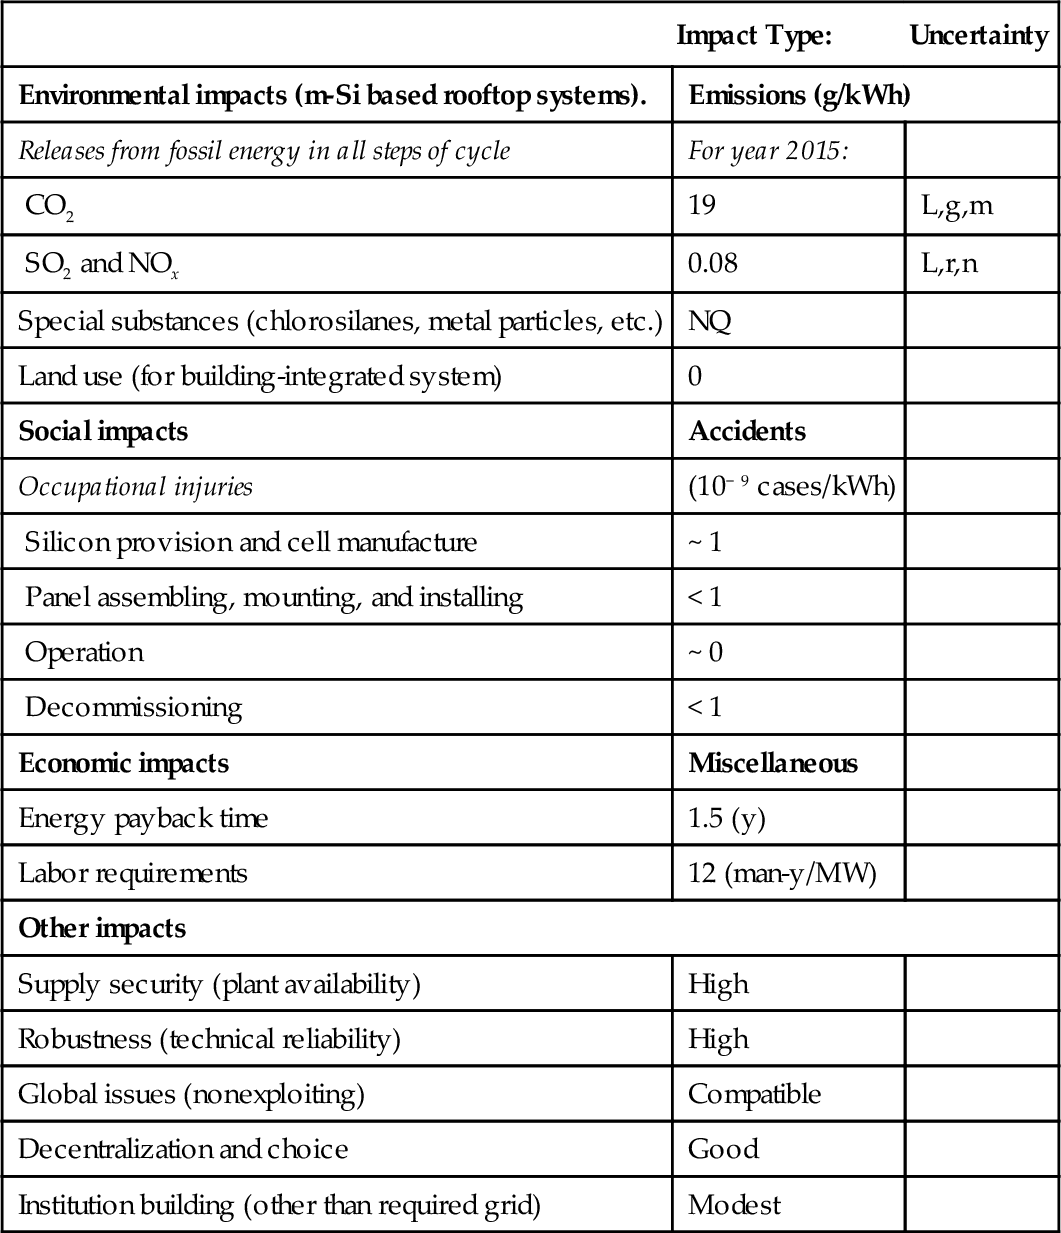
NA, not applicable; NQ, not quantified; L, M, H: low, medium, or high uncertainty; l, r, g: local, regional, or global impact; n, m, d: near, medium, or distant time frame.
Table 11.2
Monetized Assessment of Impacts from m-Si Building-Integrated Solar PV Systems
| Monetized Value 2010 (m€/kWh)a | Uncertainty and Ranges | |
| Environmental impacts (m-Si based rooftop systems) | ||
| Releases from fossil energy in all steps of cycle | For year 2015: | |
| Greenhouse effect from fossil emissionsb | 1.9 | H,r,n |
| Land use (for building-integrated system) | 0 | H,r,n |
| Visual intrusion (annoyance from reflections, etc.) | NQ | L,l,n |
| Social impacts | ||
| Mortality and morbidity from fossil-burning air pollutionc | 0.125 | H,r,n |
| Special substances (chlorosilanes, metal particles, etc.) | NQ | |
| Occupational injuries | ||
| Silicon provision and cell manufacture | 0.1 | M,l,n |
| Panel assembling, mounting, and installing | < 0.1 | L,l,n |
| Operation | 0 | L,l,n |
| Decommissioning | < 0.1 | L,l,n |
| Economic impacts | ||
| Direct costs (southern Europe or USA) | 100-200 | M |
| Energy payback time | NA | |
| Labor requirements | NQ | |
| Benefits from power sold (ignoring intermittency cost) | 100-300 | |
| Evaluation of other impacts | ||
| Supply security (plant availability) | NQ | |
| Robustness (technical reliability) | NQ | |
| Global issues (nonexploiting) | NQ | |
| Decentralization and choice | NQ | |
| Institution building (other than required grid) | NQ | |
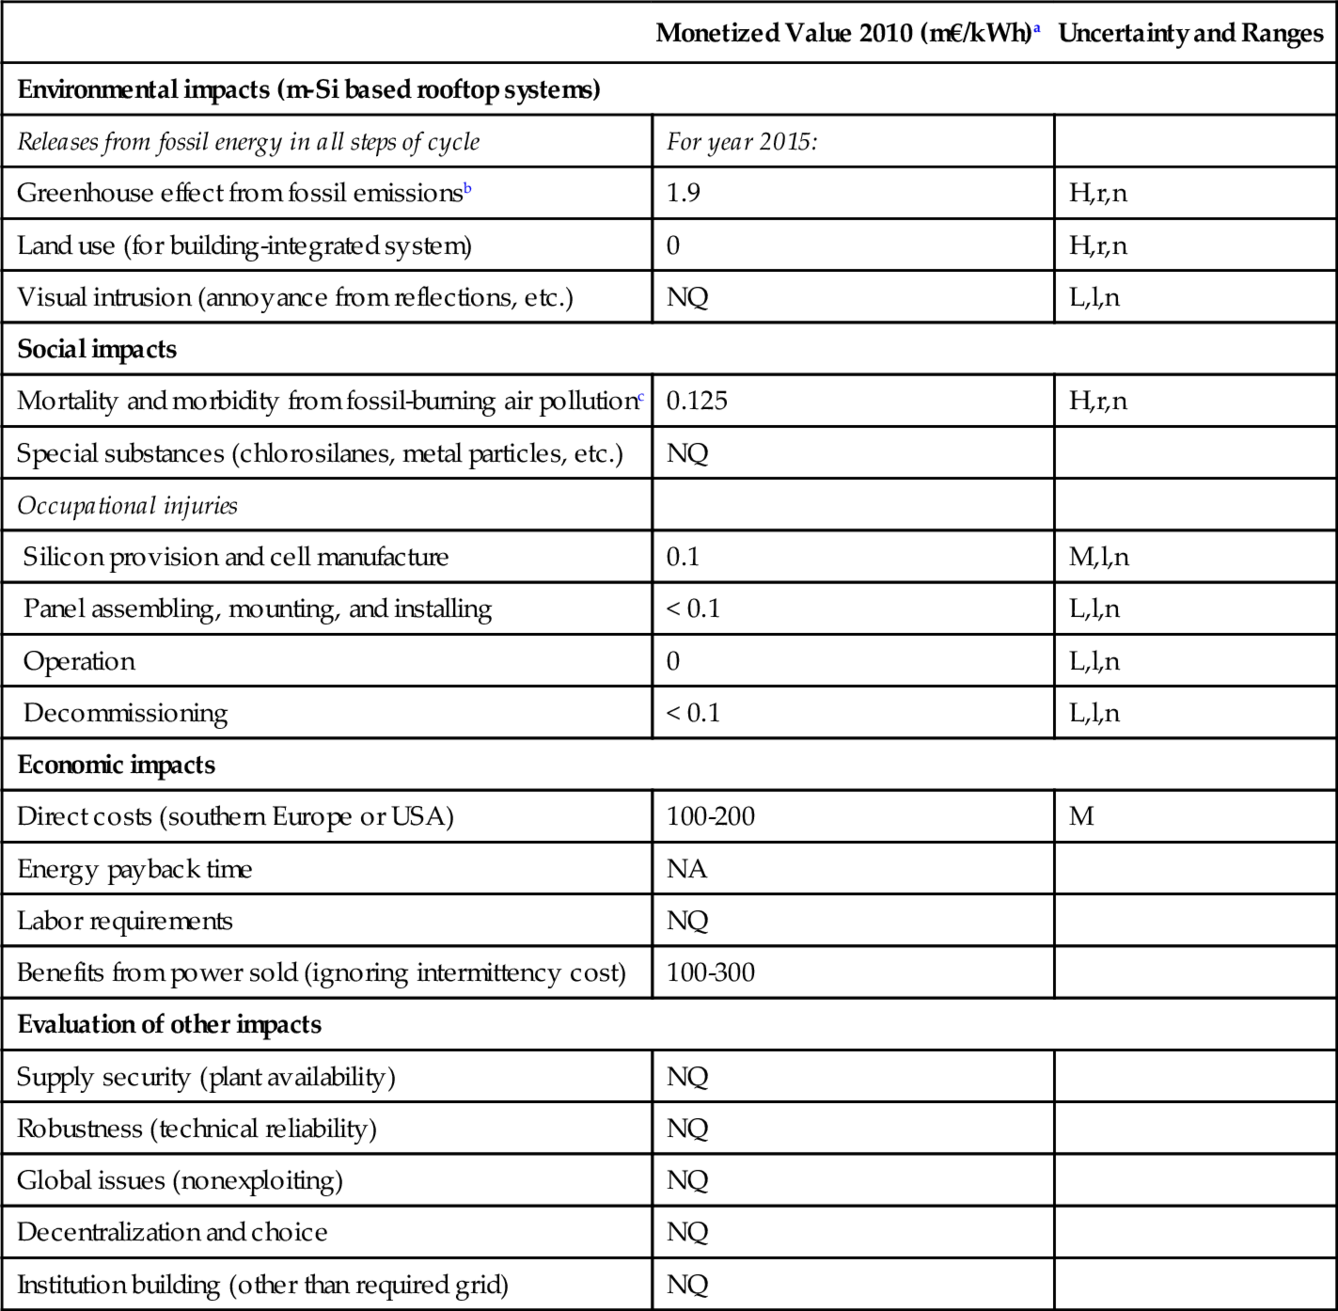
NA, not applicable; NQ, not quantified; L, M, H: low, medium, or high uncertainty; l, r, g: local, regional, or global impact; n, m, d: near, medium, or distant time frame.
a By 2010, 1 € was approximately 1.1 US$.
b Global warming effects over 100 years, as estimated in Sørensen (2011a) using the 2.6 M€ EU valuation of a life lost.
c Mortality as for warming-related deaths, morbidity using the 65 k€ EU valuation for a disability-adjusted life shortening of a year (DALY).
A substantial number of publications give estimates of the range of life-cycle impacts from solar systems, similar to the ones described previously, as regards global warming, energy use, and health impacts, occasionally with an additional focus (e.g., on labor requirements; Stamford and Azapagic, 2012; Masanet et al., 2013). However, labor requirements are an uncertain quantity, partly because they depend on the level of automatization in manufacture, say by use of robot technology, and partly because labor requirements are likely to diminish with maturity of the technology, as needed to reach cost goals. Additional life-cycle studies have been made for large desert installations of solar cell arrays (Ito et al., 2003) and for concentrating solar installations (Whitaker et al., 2013; Corona et al., 2014; Barton, 2014). Such systems are only viable at certain geographical locations with very clean air (low turbidity and hence little scattering of radiation) and high levels of solar radiation.
11.4 Solar Electric Storage
Because of solar source intermittency and more generally due to mismatch between production and energy demand, a full life-cycle analysis should include the additional components and arrangements needed to deal with this intermittency. In this book, the focus is on energy storage, although as mentioned in the introductory chapter, measures for avoiding mismatch by power exchange between different national or international systems, or demand management, may constitute less expensive ways of dealing with intermittency than active energy storage. A practical difficulty in adding storage to the life-cycle assessment is that storage of power for later electricity regeneration is usually a common facility for all electricity units attached to the system, whether solar or based on other energy conversion techniques. Therefore, the impacts have to be distributed between the solar cell systems and other systems, presumably in proportion to how much each system draws on the stores incorporated. This means that an analysis of impacts can only be made when a scenario for the entire power supply system has been established and accepted for the future distribution of investments. Examples of such scenarios and their impacts on intermittency can be found in Sørensen (2014). Here, the analysis will be restricted to studying the impacts for each promising energy storage system in isolation, and it will be left to future energy planners to decide on the solar share and the selection of stores to be used in a particular energy supply system.
The primary energy storage systems relevant to solar power are underground storage of hydrogen or other gases, pumped hydro, batteries, and other reversible electrochemical devices. Magnetic storage at ultralow temperatures, using superconducting coil charging, is possible but further away from economic viability than the other technologies mentioned. Short-term smoothing by flywheels or capacitors is important for dispersed power generation in isolated systems, but not very relevant for systems where a large number of electricity producers are connected to a common transmission grid of sufficient capacity.
Looking first at underground gas stores, there are impacts from establishing the stores, from producing the gas to be stored (e.g., hydrogen) on the basis of surplus electricity (by electrolyzers—i.e., fuel cells in reverse mode of operation), and from regeneration of electricity from the stored gas (by gas turbines or fuel cells). LCA studies have been made for compressed air storage (Denholm and Kulcinski, 2004; Barnhart and Benson, 2013), often employing caverns formed in salt domes, i.e., upward salt intrusions reaching shallow depth below the ground, where excavation can be simplified to water injection and brine extraction, which over periods of a few years will form a cavity suitable for gas storage, at much lower cost than drilling. Such geological formations are frequent in regions having experienced ice age displacements of matter during progression and withdrawal of ice cover, such as nonmountainous parts of northern Europe and northern North America. Compressed air storage facilities use compressors and turbines and need heat management, including burners currently using natural gas for the energy recuperation stage (Sørensen, 2010). Similar caverns can be used for underground hydrogen storage, sometimes requiring a cavity liner to reduce pressure losses, and in this case, no auxiliary energy input for extraction is required. Used as an electricity store, the hydrogen would, as mentioned, be produced by electrolyzers and electricity regenerated by turbines or fuel cells, implying that only data for the excavation/flushing of the cavern can be taken from existing compressed air LCA studies.
Caverns of the kind suitable for hydrogen storage include the salt dome structures, the even cheaper aquifer upward-bend types, and the more expensive rock-drilled cavities (see illustration in Chapter 1; Sørensen, 2011b). Both salt dome and aquifer caverns are currently in use for energy storage (of natural gas), for example in Denmark, so costs and life-cycle inventories may in principle be derived. Although no LCA has yet been made, but only cost estimates for future hydrogen stores (Lord et al., 2011; Simón et al., 2014), one may use some data from the establishment of compressed air caverns in salt domes as a proxy for the hydrogen stores. Compressed air stores are considered less relevant for solar electricity systems because they are aimed at short-term storage, such as night to day, but not the weekly effects of changing weather systems that reduce solar power output in overcast or rainy conditions, or the seasonal variations present in all areas away from the equator. The plant equipment of a hydrogen store has some similarity to that of a compressed gas store (compressors, gas turbines), but the overriding cost element is electrolyzers. The 2011 US study by Lord et al. finds a cost of 1.6 US$/kg H2 for establishing caverns in salt domes and filling them with compressed hydrogen (two roughly equal shares in cost), and 0.8 US$/kg H2 if the caverns are in aquifers. The 2014 EC study by Simón et al. has the salt dome cavern cost (excavation only) reduced to between 0.1 and 0.3 €/kg H2 for large installations after the year 2025. To this some 0.7 €/kg H2 for topside equipment (including compressors) should be added, and another 1.0 €/kg H2 for the electrolyzers. Finally, there is an estimated 0.6 €/kg H2 operation and maintenance cost, plus what may have to be paid for the input electricity and its transmission to the storage site.
Because the input electricity in the solar case would be a surplus not able to find other uses, its economic value could be put at zero, whereas the output electricity would have the value that the power market is willing to pay at the moment of regeneration. Alternatively, the hydrogen produced may be sold as a vehicle fuel, an avenue that would be highly profitable if a hydrogen vehicle fleet were already in place. According to the European study of Simón et al. (2014), this would have the potential to be profitable even if the market price were paid to the solar cell power provider of the electrolyzer input electricity.
A large number of studies claim to have calculated life-cycle impacts of hydrogen production pathways (an overview with many references is given in Bhandari et al., 2014; important recent studies are Patyk et al., 2013; Cetinkaya et al., 2012; Dufour et al., 2012). However, the majority of the studies are not full life-cycle analyses, but only estimates of a few impacts such as energy use and the associated greenhouse gas emissions, which in any case is highly dependent on the mix of methods used to generate the energy needed for electrolysis or other avenues of hydrogen production. Furthermore, the results are rarely disaggregated so that the impacts from electrolysis can be sorted out as needed in the present context of storage. For instance, Cetinkaya et al. (2012) include solar PV hydrogen production, but without singling out impacts from electrolysis. Because the largest impacts found in studies disclosing such information are usually from the electricity input to electrolysis, which here is not considered a cost of the electrolysis step (Tables 11.1 and 11.2), the published aggregated data cannot be used. Nearly all the literature studies focus on hydrogen production for delivery to filling stations serving hydrogen-fueled vehicles. This further implies very different conditions from the ones required here, regarding time-wise utilization of the plant as well as compression equipment, where filling station storage is often assumed to be in metal containers at 30 MPa or more (i.e., considerably higher than needed for underground hydrogen storage). Life-cycle analyses for hydrogen storage and subsequent use on the small scale relevant for automotive applications were performed earlier (see Sørensen, 2011b).
A few studies do allow the extraction of data for the electrolysis step separately. Table 11.3 gives the results derived from Patyk et al. (2013) for a high-temperature solid-oxide laboratory-size electrolysis unit (SOEC). Impacts from a solid oxide fuel cell (SOFC), identical to an SOEC except for the reversal of operation, have been studied by Pehnt (2003). The study by Dufour et al. (2012) considers a conventional alkaline electrolysis unit, suggesting lower material requirements than for the SOEC, and it has PV energy input as one of its case studies, but without separating the impacts from the electrolysis plant. According to Patyk et al., this step is by far the most important for LCA impacts over the operating life of a hydrogen storage facility. It should be kept in mind that an underground hydrogen store may use the same fuel cell in forward and reverse mode for extracting the electric power from hydrogen and converting it to hydrogen for storage. This implies that additional impacts from power regeneration equipment may be taken as negligible, relative to the ones already included. An issue is that both of the studies referred to state the impacts per unit of hydrogen produced. This is meaningless for underground hydrogen stores, because the amount of hydrogen pumped into them depends not only on the renewable energy source of power, but also on the entire electricity and hydrogen usage system, as well as on utility policy, power exchange arrangements, and demand structure and management (Sørensen, 2014). In order to avoid this complication, the numbers given in Table 11.3 are based on the energy rating of the storage itself, and the data pertaining to the electrolysis unit are calculated from those given in the references by assuming an operational life of 10,000 h for the unit (which at present is at the high end of experiences).
Table 11.3
Life-Cycle Physical Impacts from Geological Seasonal Hydrogen Store, Using High-Temperature Electrolyzers to Convert Solar Power into Hydrogen and Back
| Impact Type: | Uncertainty and Ranges | |
| Environmental impacts construction phase (salt dome or aquifer) | Emissions (g/rated MJ)a | |
| Salt dome excavation by flushing | ||
| CO2 emissions from energy use: natural gas or renewable | < 0.2 | L,g,m |
| Water usage | Modest | L,r,n |
| Land use | Modest | L,l,n |
| Waste (brine, may be used for salt production) | Low | L,r,n |
| Alternative: aquifer, accessed by drilling | ||
| CO2 emissions from natural gas or renewable energy use | < 0.1 | L,g,m |
| Land use | Modest | L,l,n |
| Electrolyzer (high-temperature SOEC) and surface plant | ||
| Energy used in manufacturing: fossil or renewableb | 0.015 MJ/rated MJa | L,g,m |
| Steelb | 0.015 | L,r,n |
| Nickel oxideb | 0.004 | L,r,n |
| Zirconiab | 0.003 | L,r,n |
| Lanthanumb | 0.001 | L,r,n |
| Solvent usedb | 0.035 | L,l,n |
| Water use (see Figure 11.7) | Modest | L,r,n |
| Land use (see Figure 11.7) | Modest | L,l,n |
| Operational phase | ||
| In addition to energy counted under PV system | Small | L,l,n |
| Social impacts | Accidents | |
| Occupational injuries (based on similar industries) | (10− 9 cases/rated MJ) | |
| Excavation | < 1 | |
| Electrolyzer and other equipment | < 1 | |
| Operation | ~ 0 | |
| Decommissioning | < 1 | |
| Economic impacts | Miscellaneous | |
| Energy payback time | Small (y) | |
| Labor requirements | NA | |
| Other impacts | ||
| Supply security (plant availability) | High | |
| Robustness (technical reliability) | High | |
| Global issues (nonexploiting) | Compatible | |
| Decentralization and choice | Modest | |
| Institution building (other than required grid) | Modest | |
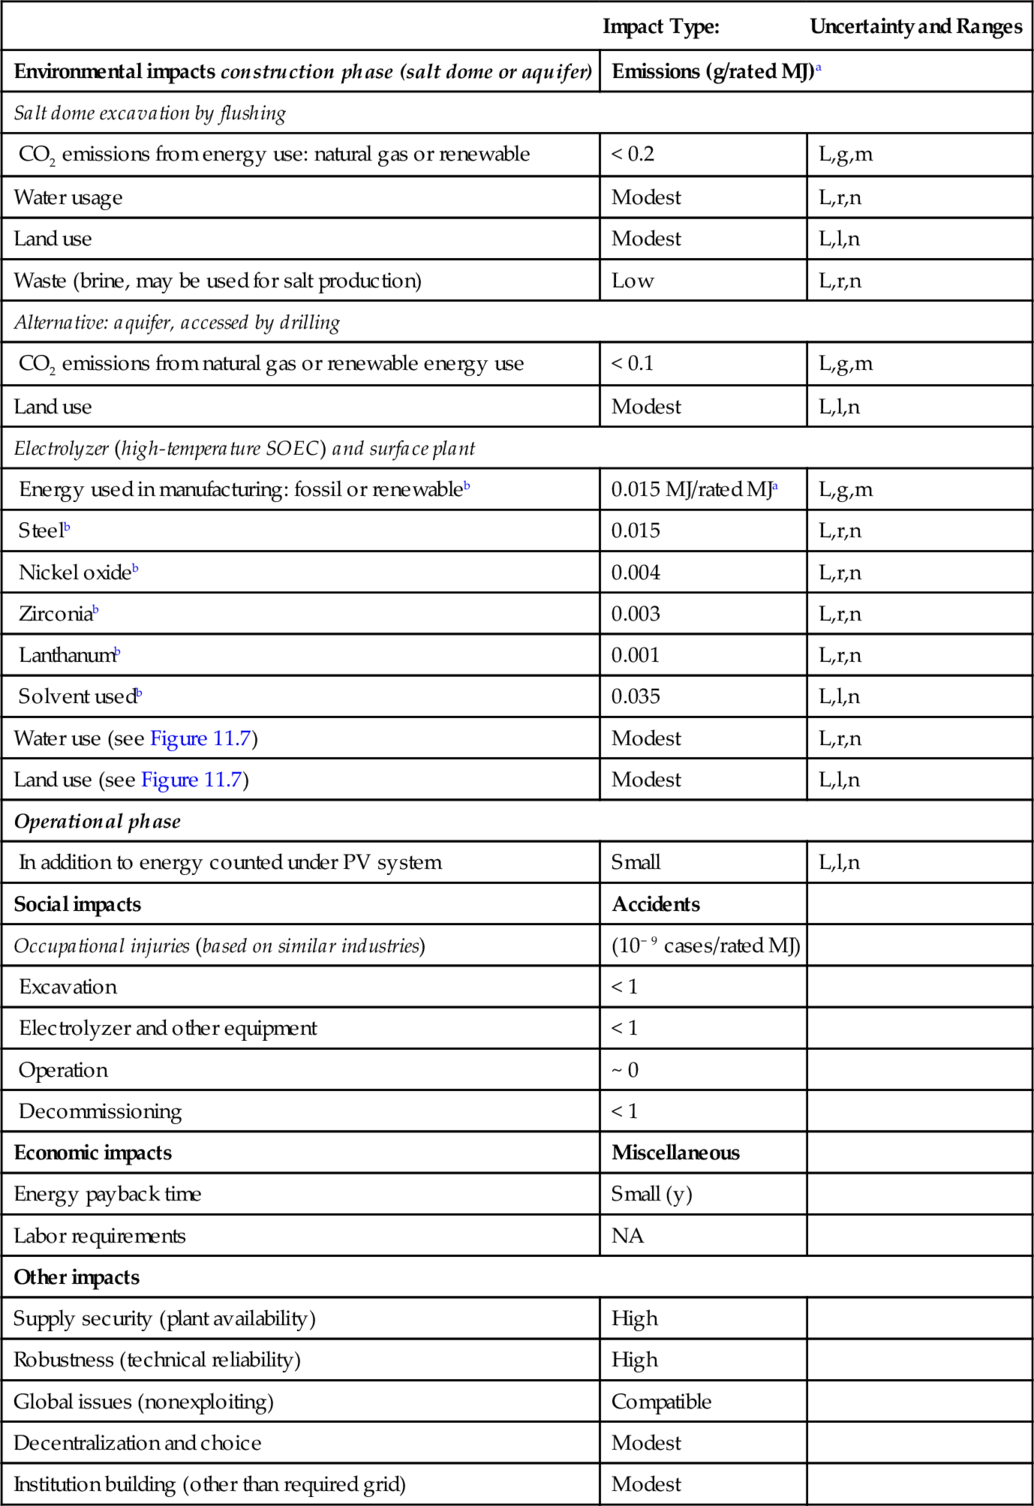
Assumed CO2 emission from natural gas burning: 115 g/MJ.
NA, not applicable; NQ, not quantified; L, M, H: low, medium, or high uncertainty; l, r, g: local, regional, or global impact; n, m, d: near, medium, or distant time frame.
a Rated MJ refers to the capacity of the store, not the production of the electrolyzer.
b Based on Patyk et al. (2013) and assuming an electrolyzer life of 10,000 h of operation.
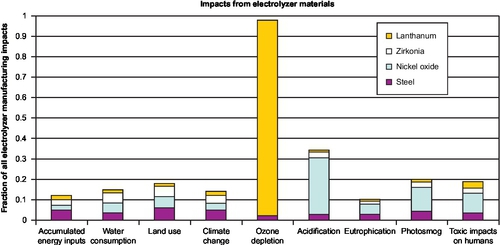
The cavern establishment is found to cause very modest impacts, with aquifer drilling even lower than salt dome flushing. The high-temperature electrolyzer consists of a solid-oxide fuel cell in reverse operation, and its fabrication involves a number of impacts related to material and electrolyte losses, as seen in Table 11.3. The possible negative impacts of these depend on schemes for material recycling involved, but most of the impacts are still from the energy required for manufacture of the electrolyzer unit—energy that may be of fossil or renewable origin. The impact assessment presented in Table 11.4 considers both alternatives, reflecting impacts from using currently typical energy mixes as well as future ones in an all-renewable energy system such as the ones discussed by Sørensen (2010, 2011b, 2014). Only global warming impacts are monetized in Table 11.4, because the remaining environmental and social impacts depend on more complex details of the electrolyzer manufacturing process not reflected in the laboratory-scale SOEC data used here. Figure 11.7 relates the various impacts to the specific materials that cause them, indicating the possible need to develop high-temperature fuel cells that do not rely on materials such as lanthanum.
Table 11.4
Life-Cycle Environmental and Social Damage from Geological Seasonal Hydrogen Store, Using High-Temperature Electrolyzers to Convert Solar Power into Hydrogen and Back
| Unit | Impact | Uncertainty and Ranges | |
| Environmental impacts from plant construction (cavern, electrolyzer, etc.) and materials used | |||
| Greenhouse effects from fossil emissions (Table 11.3)a | kg CO2-eq./MJ H2 | 0.0006 (0) | L,r,n |
| Monetized greenhouse effects from fossil emissionsb | m€/MJ H2 | 0.00006 (0) | H,g,m |
| Ozone depletiona | kg CFC-11-eq./MJ H2 | 0.000000001 | L,r,n |
| Acidificationa | kg SO2-eq./MJ H2 | 0.000003 | L,r,n |
| Eutrophicationa | kg NOx-eq./MJ H2 | 0.000001 | L,r,n |
| Photosmoga | kg C2H4-eq./MJ H2 | 0.000002 | L,r,n |
| Water consumptiona | m3/MJ H2 | 0.00012 | L,r,n |
| Land usea | m2/MJ H2 | 0.000013 | L,r,n |
| Visual intrusion | NQ | L,l,n | |
| Social impacts | |||
| Mortality/morbidity caused by air pollutionc | m€/MJ H2 | 0.000003 (0) | H,r,n |
| Special toxic substances with human impactsa | kg C6H4Cl12-eq./MJ H2 | 0.0008 | M,r,m |
| Occupational injuries | Small | L,l,n | |
| Economic impacts | $/kg H2 produced | See text | |

The value in parentheses is for the case where renewable energy is used for producing materials and for installation.
NA, not applicable; NQ, not quantified; L, M, H: low, medium, or high uncertainty; l, r, g: local, regional, or global impact; n, m, d: near, medium, or distant time frame.
a Plant contribution from Patyk et al. (2013), who give impacts per kg of hydrogen produced without disclosing plant life, and from Table 11.3.
b Global warming effects over 100 years, as estimated in Sørensen (2011a) using the 2.6 M€ EU valuation of a life lost.
c Mortality as for warming-related deaths, morbidity using the 65 k€ EU valuation for a disability-adjusted life shortening of a year (DALY).
Pumped hydro is another option for solar energy storage. Impacts from hydro installations vary quite considerably, with the establishment of reservoirs as a major contributor (Sørensen, 2010, 2011a). Pumped hydro impacts are similar to those of other hydro installations, as they need an upper reservoir to function. The extra equipment for upward pumping is often a minor source of impacts compared to those of the rest of the facility, but the pumping energy reduces the overall storage cycle efficiency. Ribeiro and Silva (2010) find impacts dominated by energy for dam construction and land use, but in the case of pumped hydro, dams are not necessarily required (Prasad et al., 2013).
Storing electric energy in batteries is another option that has been in use for bulk storage since the early twentieth-century surge in power supply from wind energy (Sørensen, 2011c). Current advanced batteries are declining in price toward a level where they may be contemplated for large-scale storage of renewable energy. A review of their technical status is given by Chen et al. (2009), and specific energy analyses for lithium-ion and other batteries are furnished by Rydh and Sandén (2005), Kushnir and Sandén (2011), and Barnhart and Benson (2013), finding an energy payback time of around 6 months for Li-ion batteries, which is better than that of other battery types included in the study. Extended life-cycle analyses have until now primarily been made for smaller batteries aimed at electric vehicles, such as the 10 kWh lithium-ion battery studied by Zackrisson et al. (2010) and the study of several battery types by McManus (2012). Similar to the Patyk et al. (2013) study for geological stores, they use commercial software for the LCA, which means replacing data not explicitly inserted by the user with generic data, usually derived from outdated technology and with assumptions (e.g., on the mix of energy sources used) that may differ greatly from those relevant for the case actually studied. With this reservation, some results for the production of various battery types of 1 MJ capacity are given in Table 11.5.
Table 11.5
Life-Cycle Environmental and Social Damage from Battery Production
| Unit | Pb Acid | Li-Ion | NiCd | NaS | |
| Environmental impacts from manufacture of various batteries, per MJ battery capacity | |||||
| Greenhouse effects from fossil emissionsa | kg CO2-eq./MJ | 6 (0) | 22 (0) | 12.5 (0) | 2 (0) |
| Monetized greenhouse effects from fossil emissionsb | m€/MJ | 0.6 (0) | 2.2 (0) | 1.3 (0) | 0.2 (0) |
| Ozone depletiona | kg CFC-11-eq./MJ | 0.0000003 | 0.00044 | 0.000001 | 0.0000001 |
| Particulate matter (above 10 μm)a | kg PM10 eq./MJ | 0.025 | 0.035 | 0.49 | 0.009 |
| Ionizing radiationa | kg 235U-eq./MJ | 1.3 | 3.7 | 4.4 | 0.3 |
| Photochemical oxidants (non-CH4 volatile organics)a | kg NMVOC/MJ | 0.035 | 0.04 | 0.19 | 0.007 |
| Water consumption (water not returned to origin)a | m3/MJ | 0.085 | 0.155 | 0.0024 | 0.00033 |
| Land usea | m2/MJ | 0.25 | 0.42 | 0.69 | 0.09 |
| Visual intrusion | NQ | NQ | NQ | NQ | |
| Social impacts | |||||
| Mortality/morbidity caused by air pollutionc | m€/MJ | 0.03 (0) | 0.11 (0) | 0.07 (0) | 0.01 (0) |
| Special toxic substances with human impactsa | kg C6H4Cl12-eq./MJ | 7 | 4 | 5 | 0.3 |
| Occupational injuries | Small | Small | Small | Small | |
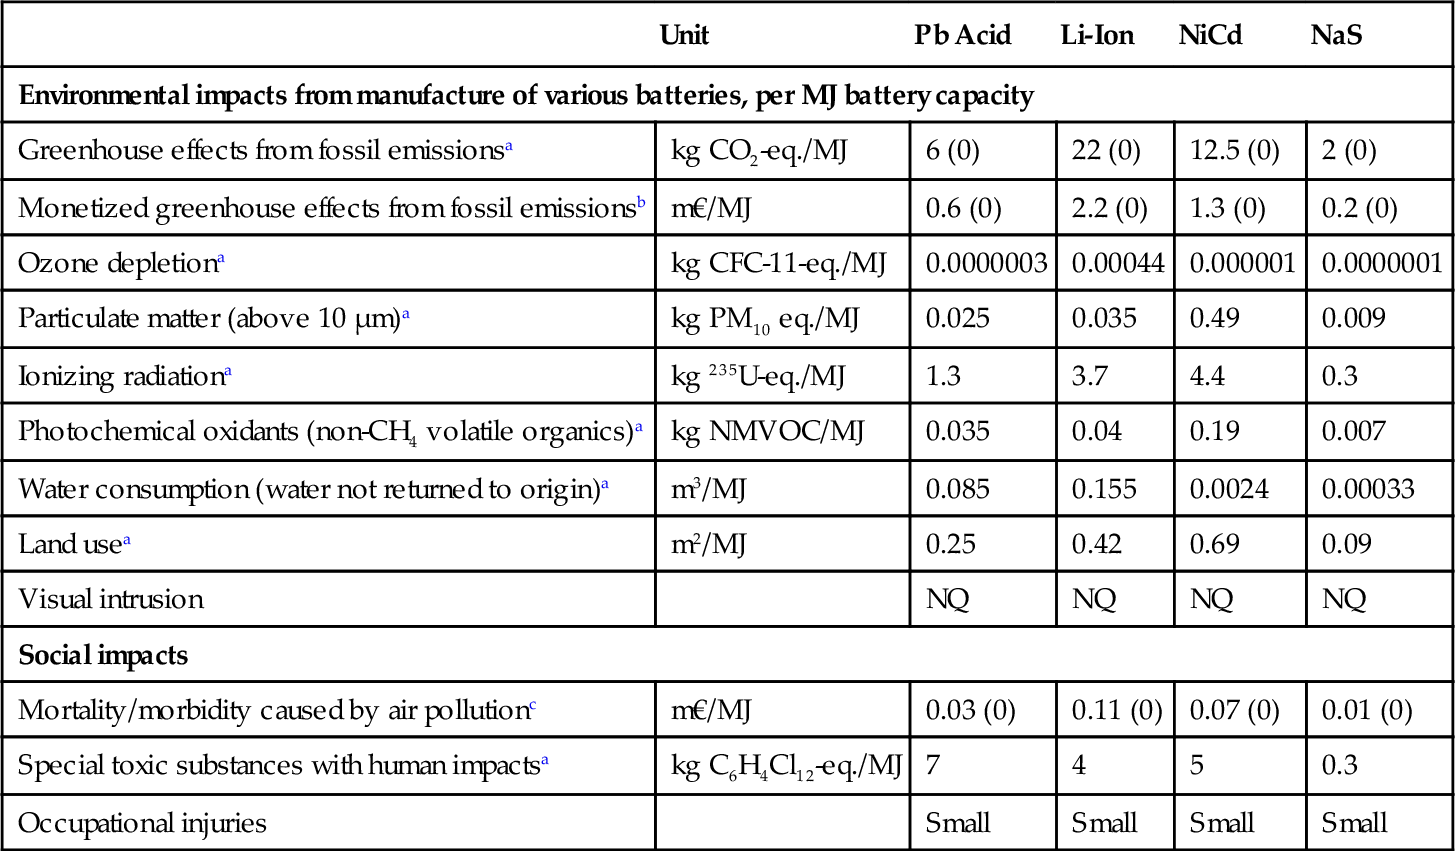
The value in parentheses is for the case where renewable energy is used for producing materials and for installation.
NA, not applicable; NQ, not quantified; L, M, H: low, medium, or high uncertainty; l, r, g: local, regional, or global impact; n, m, d: near, medium, or distant time frame.
a From McManus (2012), who also gives impacts per kg of battery material. The uncertainty on impacts is stated as ± 20%.
b Global warming effects over 100 years, as estimated in Sørensen (2011a) using the 2.6 M€ EU valuation of a life lost.
c Mortality as for warming-related deaths, morbidity using the 65 k€ EU valuation for a disability-adjusted life shortening of a year (DALY).
11.5 Solar Heat Systems
Solar thermal panels are used to provide heating for individual buildings or for district heating lines. Discussing them in a way is more complicated than discussing solar cell panels, because solar cells are hardly influenced by the remainder of the electricity system they feed into, while the functioning of thermal cells depends critically on the balance of the system, and particularly on the inlet temperature of the fluid being passed through the collectors. As a consequence, dimensioning of the thermal collector, the size of heat store (if present), and the kind of heat distribution system used (typically using air or water) must be done together, in accordance with the characteristics of the solar radiation at the location and the specific mounting of the collector (tilt angle and azimuth angle). Each component will have environmental and social impacts and a generic analysis would treat them separately, leaving the weighing to be done for each particular setting. The discussion here will therefore be confined to analysis of the impacts from the solar thermal panel and, in the following section, from the thermal energy store.
The negative life-cycle impacts associated with solar thermal systems are in any case very small compared with those of present-day heating systems based on fossil fuels such as natural gas. This means that if externalities are included in the price of the systems, the bare cost changes very little. Nielsen and Sørensen (1998) estimated the average full cost of energy over the system lifetime for solar thermal systems, as it would develop over time of purchasing the hardware, finding costs in an interval of 0.045-0.09 €/kWh for 2015-2020 vintage systems, declining to between 0.03 and 0.07 €/kWh by 2050. The lower figures are for the radiation conditions of southern Europe, the higher ones for high latitudes (50-60°N).
More detailed analysis of LCA impacts from solar thermal collector manufacturing and installation may be found in several recent publications, such as Carnevale et al. (2014) and Lamnatou et al. (2015), again based on commercial software with some European energy mix (primarily based on Switzerland) used for energy input and many impacts taken from databases not specifically derived from current solar thermal installations. This limits the assessment to past installations, and weakens the fact that both studies find solar thermal collector impacts smaller than those of solar cell panels. The current rapid development taking place for all solar cell technologies may make future impacts more similar.
Table 11.6 shows the Lamnatou et al. (2015) results for selected solar thermal systems, omitting the operational impacts that are quantified but smaller than the system installation impacts. The impacts from panel manufacturing are found modest compared with those of transport (manufacturer to building location) and installation, the latter being included in the rightmost column.
Table 11.6
Life-Cycle Environmental and Social Damage from Solar Thermal Systems
| Unit | Flat-Plate Collector | Evacuated Tube | Flat-Plate System | |
| Environmental impacts from single-dwelling solar thermal unit, per m2 of collector installeda | ||||
| Greenhouse effects from fossil emissionsa | kg CO2-eq./MJ | 10.2 (0) | 9.0 (0) | 274 (0) |
| Monetized greenhouse effects from fossil emissionsb | m€/MJ | 1.0 (0) | 0.9 (0) | 27 (0) |
| Ozone depletiona | kg CFC-11-eq./MJ | 0.00001 | 0.00001 | 0.00035 |
| Acidificationa | kg SO2 eq./MJ | 1.0 | 0.8 | 2.0 |
| Eutrophicationa | kg PO4-eq./MJ | 0.7 | 0.7 | 1.4 |
| Photochemical smoga | kg C2H4/MJ | 0.05 | 0.03 | 1.3 |
| Water consumption | m3/MJ | NQ | NQ | NQ |
| Land use (manufacturing plant) | m2/MJ | NQ | NQ | NQ |
| Visual intrusion | NQ | NQ | NQ | |
| Social impacts | ||||
| Mortality/morbidity caused by air pollutionc | m€/MJ | 0.5 (0) | 0.4 (0) | 0.12 (0) |
| Special toxic substances | NQ | NQ | NQ | |
| Occupational injuries | Small | Small | Small | |
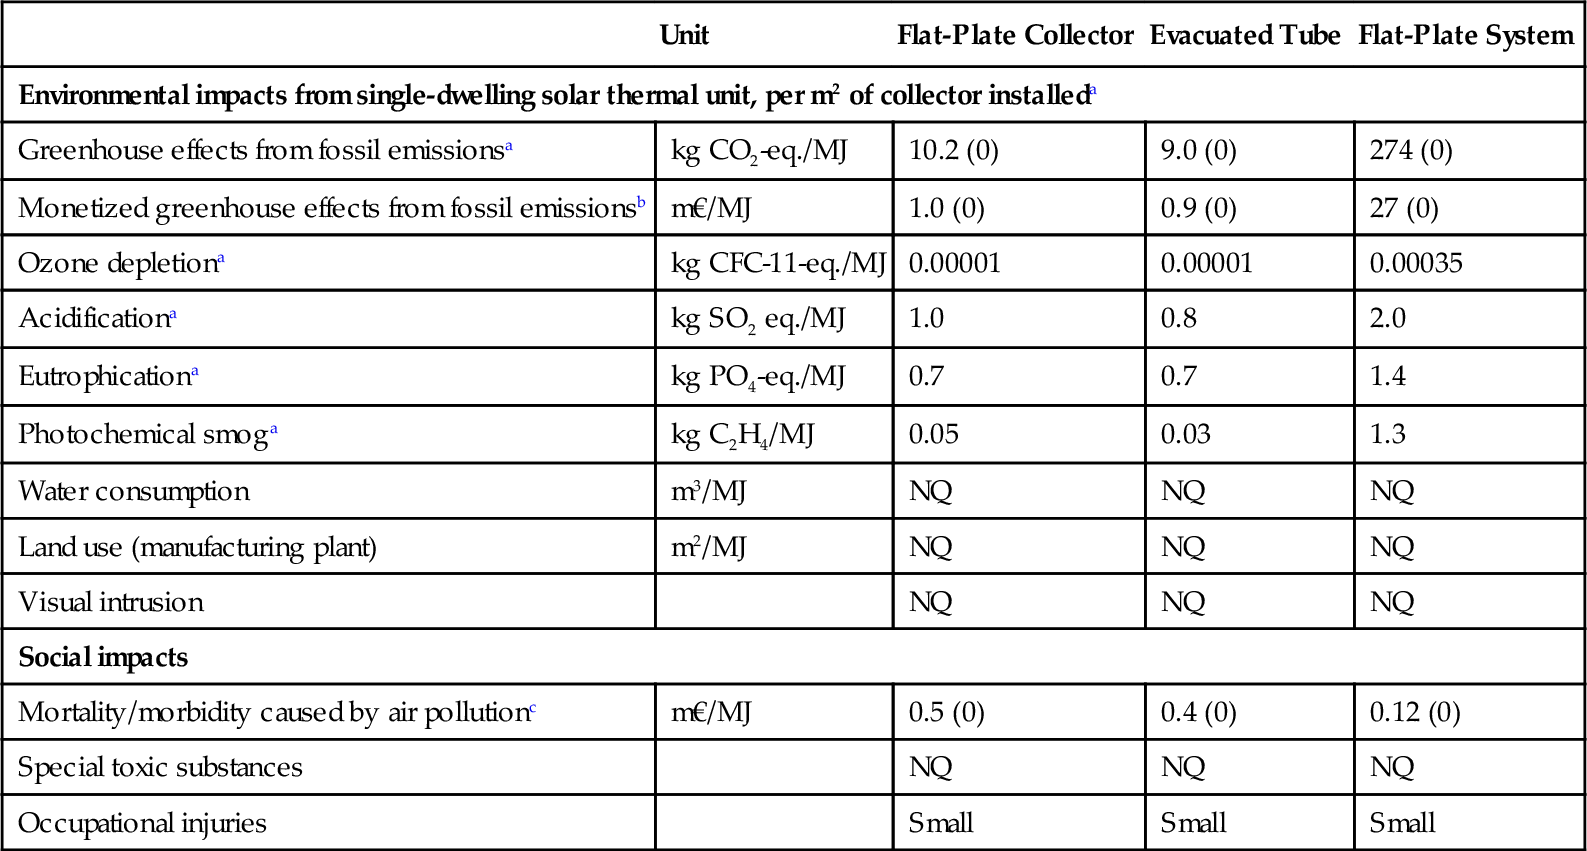
The zero in parentheses would apply if only renewable energy were used at all instances of energy input.
NA, not applicable; NQ, not quantified; L, M, H: low, medium, or high uncertainty; l, r, g: local, regional, or global impact; n, m, d: near, medium, or distant time frame.
a From Lamnatou et al. (2015). The system (hot water and space heating) values include Swiss average manufacturing, delivery of system, and installation impacts, but not additional impacts from the operational phase (circulation pumps, etc.).
b Global warming effects over 100 years, as estimated in Sørensen (2011a) using the 2.6 M€ EU valuation of a life lost.
c Mortality as for warming-related deaths, morbidity using the 65 k€ EU valuation for a disability-adjusted life shortening of a year (DALY).
11.6 Solar Heat Storage
The heat stores used in connection with building-integrated solar thermal systems are currently mostly insulated containers of water, although alternatives do exist, such as gravel and phase-change materials. For communal solar systems used in connection with district heating networks, use of a common solar pond store has been explored. A reasonably complete list of the options may be found in Sørensen (2010).
Oró et al. (2012) have considered the LCA impacts from three storage systems connected to solar concentrator power plants (which, as mentioned, are relevant only for regions of particular solar radiation conditions), using either heat capacity storage in concrete or molten salt, or phase-change materials. Not surprisingly, the simplest system using concrete has the lowest LCA impacts when evaluated for the same rise in storage temperature.
While performing an LCA for the simplest heat capacity stores (e.g., blocks of concrete) is fairly trivial and leads to very small impacts, the more complex storage systems require effort in order to correctly interpret the results. Oró et al. (2012) find that with a prescribed temperature rise, the impacts from the molten salt system are highest, while for the design temperature conditions, the phase-change system has the highest impacts. In any case, the required temperature behavior is determined by the entire system, and it is thus difficult to make a meaningful appraisal by just comparing stores with operating maximum temperatures more than 300 °C apart. On one hand, the molten salt system stores about twice as much energy per kg as the two other systems do, but on the other hand, salt can cause considerable environmental damage if it is lost from the plant. In contrast, a block of concrete does not seem to invite any accidental escape from the plant.
11.7 Combined Systems
As noted in the review article by Lamnatou et al. (2015), no life-cycle studies seem to have been made for combined power and heat producing solar collectors (PVT systems). Because of the limitations to reasonably south-facing surfaces on detached dwellings or larger buildings, it is in practice rarely possible to install both solar PV and solar thermal panels of sufficient area to supply a reasonable fraction of both the heat and the power demanded within the building. Therefore, the combination consisting of a PV panel with heat tubes on the back side to carry hot water into the building’s heat-distribution system, or alternatively a combination with airflow in a confined, transparent space in front of the PV collector plate and connected to a heat distribution system based on warm air, is likely to become the preferred system in the future (Sørensen, 2001).
In general terms, the LCA impacts from a PVT system must be considerably smaller than the sum of impacts from a corresponding PV plus thermal flat-plate system, due to the common collector surface, common framing, and combined installation effort.
11.8 Conclusion
The entire area of storage systems to use in supply systems based on renewable energy is in its infancy. We do not know which storage systems will be selected for future energy systems characterized by solar and other renewable energy intermittency, although we do have a catalog of possible candidates. Therefore, it is not so straightforward to perform life-cycle analyses and assessments for the entire future energy system envisaged. Without knowing the mix of renewable energy sources, the detailed layout of the system and its operating conditions, the extent of transmission facilities and arrangements for using them, the future demand structure and its possible modification by various energy management options, and the technical development of the relevant components, it is not possible to describe precise conditions for the use of energy storage and choose between the storage solutions presently known. What can be done is to sketch some scenarios for combining all the mentioned concerns, and then analyze these with respect to environmental and social impacts. The previous examples should be seen in this light.
Despite such large uncertainties, the investigations described do suggest that there exist solar storage options that are neither prohibitively expensive, nor have unacceptable levels of externalities. Underground hydrogen storage in salt domes and aquifers is suggested as one such possibility—one that is strangely absent from the majority of published renewable energy storage work as well as from the policy debates on energy futures that go on in many countries.