
Photovoltaics and Storage Plants
Efficient Capacities in a System View
B. Böcker; B. Steffen; C. Weber Chair for Management Sciences and Energy Economics, University Duisburg-Essen, Essen, Germany
Funded by the Federal Ministry for Economic Affairs and Energy under Grant 03ESP415.
Abstract
In the medium to long term, many countries aim at low-carbon electricity systems, relying mainly on photovoltaics and wind farms for power generation. To assess the efficient capacity of storage plants complementing these intermittent power sources, an optimization at the system level is required. This chapter proposes a numerical optimization model to this end. Taking the emission-reduction targets of Germany as an example, the efficient generation portfolio is derived, showing that photovoltaics and pumped-hydro storage play a key role in the efficient portfolio for 2040; lithium-ion batteries are also part of the efficient mix. Sensitivity analyses allow the interpretation of the impact of changes to cost parameters or political objectives.
9.1 Energy Outlook
A salient feature of electricity systems is the requirement to instantaneously balance supply and demand. Traditionally, seasonality and other fluctuations on the demand side were answered by controllable thermal power plants, in some countries complemented by a very limited capacity of indirect electricity storage (almost always pumped-hydro storage (PHS) plants). To mitigate climate change, though, governments recently increased their efforts to reduce greenhouse gas emissions, most prominently by increasing the share of renewable energy sources (RES) in power generation. By 2020, for instance, Australia targets to achieve a share of 20% (up from 11% in 2011), France of 27% (up from 12%), and Spain of 38% (up from 30%) (REN 21, 2013).
Particularly ambitious targets have been set in Germany. The share of RES in power generation shall be ramped up in a narrowly defined corridor, reaching 80% by 2050. In addition, national carbon dioxide (CO2) emission reduction targets have been fixed, aiming for a reduction of 80-95% by 2050 (compared to 1990). The bulk share of emission reductions thereby has to be achieved in the power generation sector. Given the natural constraints for hydropower and the cropland needs of biomass, additional renewable capacity can primarily be wind power or photovoltaic systems. Given their intermittent load, though, wind and photovoltaics cannot be controlled to follow the system load. To illustrate the magnitude of intermittencies, Figure 9.1 shows the feed-in from German photovoltaics during a summer week in 2013.
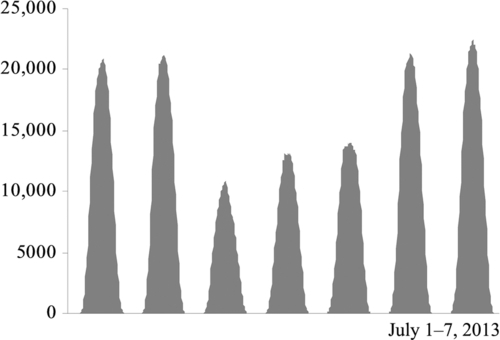
The pronounced day-night pattern makes it very natural to consider storage plants to smooth the curve. And the larger the share of renewables, the higher the need of storage technologies (or other backup solutions) to make sure electricity is available when needed.
While many storage technologies are still characterized by such high costs that a widespread commercialization is expected only in the medium term, PHS has been commercially operated for nearly a century, and interest in new sites has recently gained momentum (Steffen, 2012). The renewed interest is fueled precisely by growing shares of intermittent renewables. The typical setup of PHS in lower mountain ranges allows for storage cycles of 6-10 h, which fits well to the day-night pattern of photovoltaic systems as shown in Figure 9.1.
To allow for efficient capital investment, PHS plants are utility scale, with a typical pump-turbine capacity starting from 200 MW. This is a major difference compared to the photovoltaic capacity distributed in many small sites. In Germany, for instance, many installations are smaller than 10 kW. Consequently, the economics of photovoltaics and PHS shall not be looked at considering single plants, but must be analyzed in a system context. This is even more the case because PHS is clearly not the only possible technology to complement renewables. Lithium-ion (Li-ion) batteries are strongly considered (and covered in this chapter), and also the remaining share of conventional generation provides flexibility.
To analyze the efficient use of storage in a system context, Steffen and Weber (2013) proposed a capacity-planning model based on peak-load-pricing theory. It has been applied to study the efficient use of PHS in a power system with a high share of renewables. Recently, Böcker and Weber (2015) extended the model to explicitly model reservoir size restrictions and their impact on efficient capacities—an aspect that is especially relevant for power systems with very high shares of wind and photovoltaics (beyond the 40-60% that have been under study by Steffen and Weber, 2013). While Böcker and Weber (2015) focus on analytical solutions, this chapter takes a more applied perspective, by numerically optimizing generation capacities and power generation in a system with very high shares of wind and photovoltaics, storage, and some thermal power plants. Taking Germany as a case study, the CO2 reduction target (− 80% by 2050) is assumed as fixed and the plant park for a 2040 horizon optimized accordingly, revealing how photovoltaics and PHS complement each other in a power system with very high shares of renewables.
The remainder of this chapter is structured as follows: First, the model to evaluate the role of photovoltaics and storage plants in a system context is described. Second, the regulatory and technical framework is sketched together with the input parameter and scenario assumptions. Third, results of the reference case and a series of sensitivities are presented. Finally, the chapter concludes with a short summary and outlook.
9.2 Storage Plants in a System View
We aim to derive the efficient portfolio consisting of generation and storage technologies and capable of meeting the energy demand in each hour at the lowest system costs under different technical and political constraints. This is a typical optimization problem. Because we are focusing on a rather distant year in the future, a green field approach is taken, neglecting existing plants.
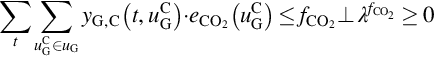
System costs are described by the sum of investment and operational costs. The objective function minimizing these costs may be written as follows:
Generation technologies uG (including conventional technologies uGC and renewable technologies uGR) are characterized by investment costs and operational costs. Investment costs are computed by multiplying specific investment cost cinv,K,G(uG) with the installed capacity ![]() . Because we consider a single (representative) year in the future that does not cover the whole technical lifetime of the plants, investment costs are annualized. In the case of conventional power plants, operational costs cop,G(uG) are dominated by fuel prices and accrue during power generation
. Because we consider a single (representative) year in the future that does not cover the whole technical lifetime of the plants, investment costs are annualized. In the case of conventional power plants, operational costs cop,G(uG) are dominated by fuel prices and accrue during power generation ![]() . The operational costs for renewable power generation can be neglected and are assumed as zero. Operational costs are assumed to be constant over the observation period
. The operational costs for renewable power generation can be neglected and are assumed as zero. Operational costs are assumed to be constant over the observation period ![]() .
.
For storage technologies uS in contrast to other generation technologies, a distinction can be made between investment costs for installed capacity KS(uS) (measured in MW) and storage volume VS(uS) (measured in MWh). The specific investment costs are given by cinv,K,S(uS) for the storage capacity and cinv,V,S(uS) for the storage volume.
The main constraint in this system model is the balance of supply and demand D(t) in each hour. Besides storage plants, the model distinguishes between flexible generation (mostly conventional technologies) yG,C and fluctuating feed-in by renewable technologies. The latter is assumed to be proportional to the installed capacities KG(uGR) and to the feed-in pattern ![]() (taken from July 2011 to June 2012). Storage plants can provide additional supply
(taken from July 2011 to June 2012). Storage plants can provide additional supply ![]() when discharging and increase demand
when discharging and increase demand ![]() when charging:
when charging:

Demand is assumed as inelastic until power prices reach the value of lost load (VoLL). The VoLL is modeled by a virtual “conventional plant” with investment costs of zero and operational costs corresponding to the VoLL. Curtailment of RES ![]() is included as an option to obtain an economically efficient energy system. It will only be selected when it is cheaper to dump excess production than to construct and operate additional storage capacities.
is included as an option to obtain an economically efficient energy system. It will only be selected when it is cheaper to dump excess production than to construct and operate additional storage capacities.
Conventional power generation yG,C(t, uGC) is limited to its installed capacity KG(uGC). Additionally, renewable energy technologies and storage volume (especially PHS) are limited by available sites in Germany, and corresponding constraints are taken into account.
The consideration of storage plants requires additional constraints in the model. First, storage-filling levels are subject to a continuity constraint, with the next storage level ![]() being calculated by adding the charged amount
being calculated by adding the charged amount ![]() and subtracting the discharged amount of energy
and subtracting the discharged amount of energy ![]() to the current storage level. Efficiencies of storage plants are thereby split in a charging ηS,ch and a discharging ηS,dc efficiency. The rate of self-discharge sd(uS) depends on the average storage level in the current time step.
to the current storage level. Efficiencies of storage plants are thereby split in a charging ηS,ch and a discharging ηS,dc efficiency. The rate of self-discharge sd(uS) depends on the average storage level in the current time step.
Additional restrictions require that storage plants be empty at the beginning and that their levels during operation be limited by the storage volumes. Cycle stability is a potentially restrictive factor for the lifetime of batteries. It is typically defined as number of full cycles during technical lifetime. Under the assumption of similar storage usage during the lifetime, this is converted into a maximum number CS of full cycle equivalents per year. This can be written as a linear constraint by limiting the sum of charging to the storage:
Charging yS,dc(t, uS) and discharging yS,chc(t, uS) are furthermore limited to the installed storage capacity KS(uS).
Political objectives are described in two additional constraints. First, the minimal share of RES in power supply fRE is considered through
RES power generation used effectively for demand coverage is determined as the sum of RES feed-in minus the curtailed energy and the storage losses. Under the long-term scenarios considered here, storage charging is typically done using renewable excess production rather than conventional power. Consequently, all storage losses are attributable to the usage of renewables and should be deduced from the renewable feed-in.
Second, the political objective of limiting CO2 emissions is considered using an emission-bound ![]() in
in ![]() . CO2 emissions are proportional to the conventional power generation YG,C(t, uGC) weighted with the specific CO2 emission coefficient
. CO2 emissions are proportional to the conventional power generation YG,C(t, uGC) weighted with the specific CO2 emission coefficient ![]() .
.
Additional costs for the distribution of power (grids) and grid constraints are not taken into account in this model. Furthermore, the energy supply of conventional technologies is not subject to additional restrictions like unavailability or ramp constraints.
9.3 Reference Case
9.3.1 Scenario Assumptions and Parameters
The following investigation is based on assumptions for 2040 and a planning period of one year with hourly time steps Δt. The optimal portfolio consists of up to nine different technologies. Besides four conventional technologies (lignite, hard coal, CCGT1, and OCGT2) and three RES (wind onshore, wind offshore, and photovoltaics), two storage technologies (PHS and Li-ion) are taken into account.
Table 9.1 provides an overview of the main input parameters.
Table 9.1
Technology Input Parameters
| Capacity Costs (k€/MW) | Volume Costs (k€/MWh) | Technical Lifetime (years) | Efficiency (%) | Operational Costs (€/MWh) | |
| Lignite | 1500 | 0 | 40 | 49 | 8.2 |
| Hard coal | 1200 | 0 | 40 | 51 | 23.9 |
| CCGT | 700 | 0 | 30 | 62 | 50.5 |
| OCGT | 400 | 0 | 25 | 41 | 76.3 |
| Wind offshore | 1600 | 0 | 20 | 100 | 0 |
| Wind onshore | 1200 | 0 | 20 | 100 | 0 |
| Photovoltaics | 800 | 0 | 25 | 100 | 0 |
| PHS | 840 | 20 | 50 | 80 | 0 |
| Li-ion | 100 | 150 | 20 | 90 | 0 |
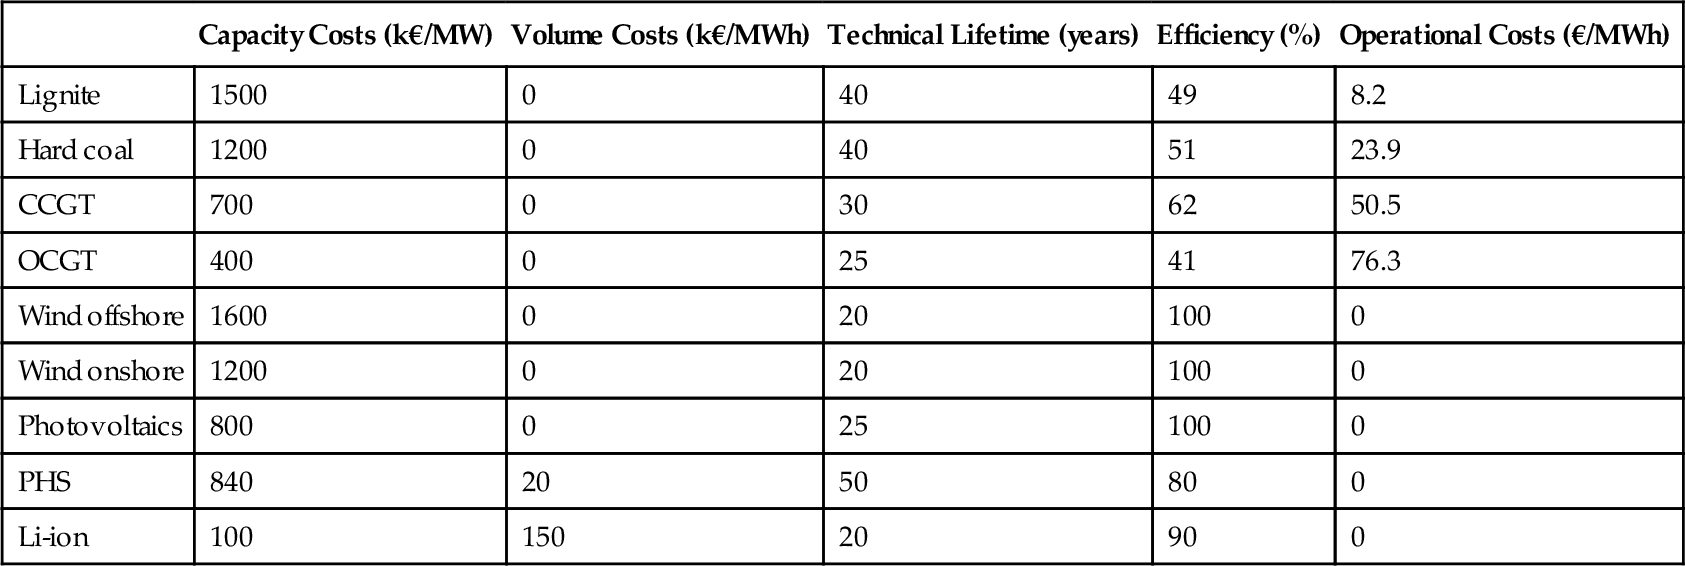
Source: Based on data by IEA (2013), ISE (2013), RWTH Aachen (2013, 2014), own analyses.
Hard coal and especially lignite have high investment and low operational costs and are therefore typical base load technologies. The two gas technologies (CCGT and OCGT) are rather peak technologies due to low investment and high operational costs. CO2 emission prices are not included in the fuel prices because a quantity bound is specified for CO2 emissions. The specific CO2 emission rates in ![]() are 0.74 for lignite, 0.67 for hard coal, 0.32 for CCGT, and 0.49 for OCGT.
are 0.74 for lignite, 0.67 for hard coal, 0.32 for CCGT, and 0.49 for OCGT.
Wind onshore, wind offshore, and photovoltaics are established renewable technologies with high additional potential. All these RES are characterized by supply-dependent feed-in and high fluctuations. Given the meteorological conditions, full load hours for wind offshore (3500) are almost twice as high as for typical wind onshore locations (1800), and photovoltaics can provide only 900 full load hours (assumed according to AEE, 2013). Full load hours as well as the investment costs are highly dependent on the exact location. In Germany, realistic sites are limited to about 198 GW for wind onshore, 54 GW for wind offshore, and 275 GW for photovoltaics (assumed according to IWES, 2013).
Similar to base load and peak load technologies, a distinction can be made between storage technologies for short-term and long-term balancing. PHS has rather high investment costs for pump-turbine capacity and low volume costs for the reservoir size, hence typically the reservoir volume will provide several hours of full load when discharging. In comparison to that, Li-ion has low capacity costs for power electrics but high volume costs for the reactive substances and therefore advantages for short balancing between load and supply (i.e., low full-load hours). Besides the storage cycle efficiency, the cycle stability and self-discharge rate are important restrictions when it comes to evaluating the potential role of storage plants in an efficient portfolio.
PHS typically has no limitations in charging and discharging cycles, and also self-discharge may be neglected. Yet the total storage volume is limited by available sites in Germany, where a maximum storage volume of 2 TWh is assumed based on an extrapolation of Voith (2014). For Li-ion batteries, in contrast, site restrictions are less relevant but cycle stability is limited. By 2040, Li-ion batteries are expected to reach 8000 full cycles and a self-discharge rate of approximately 2% per month (iSEA, 2013).
In line with the energy concept of 2010 and the coalition agreement of the current German federal government, the minimum share of RES in power generation is set to 65% for the year 2040, and CO2 emissions in the electricity sector are limited to 20% of the CO2 emissions in 1990 (Bundesregierung, 2010). The latter exceeds the official objective of − 70% emission reduction until 2040 for the entire economy, yet it is expected that power generation will contribute disproportionate to overall emission reduction. The VoLL is assumed as 10,000 €/MWh.
9.3.2 Results
In the reference case, more than 250 GW generation capacities (63 GW conventional and 189 GW RES) and 18 GW storage capacities are needed to cover a peak demand of 90 GW (Table 9.2). Hard coal is not part of the efficient portfolio as a consequence of low lignite operational costs compared to the investment costs. The realistic sites for wind offshore are fully exploited (54 GW).
Table 9.2
Efficient Portfolio Reference Case
| Capacity | Power Supply | |
| Demand | 90.0 GW Peak Load | 540.8 TWh (3.2 GWh cutoff) |
| Lignite | 3.7 GW | 24.0 TWh |
| Hard coal | 0.0 GW | 0.0 TWh |
| CCGT | 44.8 GW | 162.4 TWh |
| OCGT | 14.9 GW | 2.9 TWh |
| Wind onshore | 60.1 GW | 97.4 TWh |
| Wind offshore | 54.0 GW | 171.9 TWh |
| Photovoltaics | 74.5 GW | 62.5 TWh |
| PHS | 14.1 GW(28.8 h) | 16.3 TWh |
| Li-ion | 4.2 GW(3.3 h) | 3.4 TWh |
| Curtailment RES | 60.8 GW | 8.5 TWh |
| Load cutoff | 1.7 GW | 3.0 GWh |
The demand is covered to 65% by RES and to 35% by conventional technologies, in line with the political objectives. 91.1% of the possible RES feed-in is used directly and 5.4% indirectly with storage in between. In total, 2.3% of the possible RES feed-in is curtailed and another 1.2% is lost through the storage process.
System costs are approximately €43.3 bn: 76% is capital costs for generation technologies, 4% is capital costs for storage technologies, and 20% is operational costs of conventional power plants.
The mean electricity price for an additional unit of demand is 63.2 €/MWh and the shadow price of the CO2 constraint is ![]() . Hence the marginal cost of tightening the CO2 bound by one ton is about 75 € in this future electricity system, and this would also be the market price for an emission certificate if market-based policy instruments like emission certificates are used to achieve the CO2 objective. Additionally, the constraint on the RES share is also binding, with a shadow value of 46.4 €/MWh. Requiring an additional unit of RES electricity would hence increase the system costs by almost 50 €, other things (notably CO2 emission levels) being equal. Using again market-based instruments, each RES production unit would be valued at 46 €/MWh in addition to its market value. These costs are, however, not reflected in the electricity price previously indicated, because the RES requirement is handled through a separate constraint. So the RES certificate price instead corresponds to a support payment from the government, which on the other hand receives the revenues of the CO2 certificate sales.
. Hence the marginal cost of tightening the CO2 bound by one ton is about 75 € in this future electricity system, and this would also be the market price for an emission certificate if market-based policy instruments like emission certificates are used to achieve the CO2 objective. Additionally, the constraint on the RES share is also binding, with a shadow value of 46.4 €/MWh. Requiring an additional unit of RES electricity would hence increase the system costs by almost 50 €, other things (notably CO2 emission levels) being equal. Using again market-based instruments, each RES production unit would be valued at 46 €/MWh in addition to its market value. These costs are, however, not reflected in the electricity price previously indicated, because the RES requirement is handled through a separate constraint. So the RES certificate price instead corresponds to a support payment from the government, which on the other hand receives the revenues of the CO2 certificate sales.
The optimization model used here can be interpreted in economic terms as partial equilibrium on the electricity and related markets. Using duality theory, it can then be shown also that capital and operating costs of the installed technologies plus the costs of CO2 certificates plus scarcity rents for limited wind offshore sites are exactly matched by the electricity revenues and the revenues from the RES certificate provision. Note that only direct or indirect RES energy supply that can cover the demand receives the certificate price of 46.4 €/MWh in the system described here (see constraint (9.5)). The curtailed RES feed-in and losses during the storage process have no value and are therefore not supported.
Furthermore, the limitation of RES capacity (according to realistic sites) is a key element in the previous results, because otherwise wind offshore expansion would be unrealistically high. The shadow price of this constraint can be interpreted as the additional willingness to pay for wind offshore investment in a system perspective. In the reference case it is 75,600 €/MW.
9.4 Sensitivities
The role of photovoltaics and storage plants in an efficient power system as discussed previously may be very sensitive with respect to different input parameters. Especially for a long-term perspective such as 2040, the actual parameters may deviate considerably from the expected values used in the reference case. This is particularly true for investment costs. Furthermore, the composition of the efficient portfolio may be considerably affected by variations in the policy objectives.
9.4.1 Investment Cost
Concerning the investment cost of storage technologies, a broad range of assumptions is used in the literature. Moreover, the past has shown that ex-ante studies may be contradicted considerably by later evidence. Therefore, the following sensitivities indicate the impact of variations in the investment costs in a range of ± 50%.
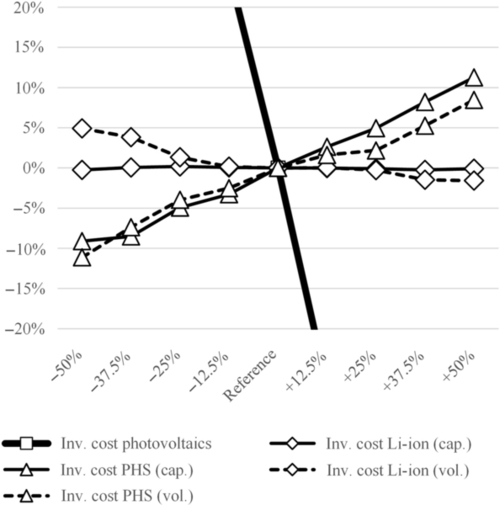
Figures 9.2 and 9.3 show the effect of varying investment costs on efficient storage capacity and volume for Li-ion and PHS, respectively. There is a strong impact of the investment costs of storage technologies on both their efficient capacities and volumes.


If storage investment costs (capacity or volume) increase, the corresponding efficient capacity and volume decreases, and vice versa. But cross-price elasticities are also important. For example, if the PHS volume investment cost rises by 50%, the efficient Li-ion capacity increases by nearly 100% and volume by over 150% (see Figure 9.2), while the efficient PHS capacity drops by approximately 50% and capacity by about 40% (see Figure 9.3). In line with actual cost shares for typical plant layouts, sensitivities are strongest with respect to volume cost in the case of Li-ion batteries and with respect to capacity cost in the case of PHS.
Generally, higher investment cost for photovoltaic capacity leads to less Li-ion and more PHS capacity and volume. This means that Li-ion complements photovoltaic feed-in, and PHS the increasing wind share in the case of increasing photovoltaic costs. Also the opposite is mostly true, yet with very low photovoltaic costs (and corresponding high penetration), longer term storage is required for the photovoltaic feed-in. This leads to a shift in storage volumes and capacities from Li-ion to PHS.
The investment cost sensitivity of efficient photovoltaic capacity is shown in Figure 9.4. As expected, variations of photovoltaic investment costs have the strongest influence. A cost reduction of 25% leads to an increase of efficient capacity of 60% (outside the display area). In addition, Figure 9.4 underlines that Li-ion tends to complement photovoltaics, while PHS substitutes for photovoltaics in the scenario under study.
9.4.2 Political Objectives
In the analysis so far, two political objectives have been included (share of RES and emission constraint). Both have the ambition to slow down climate change by reducing emissions and increasing RES, and both lead to an energy system based on renewable energies and with limited direct emissions. Subsequently, we investigate the impact if only a single objective is pursued. Then, an additional investigation describes their interactions.
If the CO2 restriction is dropped, the total capacities are nearly the same, but there are some shifts between the technologies (see Figure 9.5). In particular, CCGT is replaced by lignite and partly OCGT, because there are no incentives to limit CO2 emissions. Correspondingly, the CO2 emissions increase to 138 mt, a 93% increase compared to the reference case. This is accompanied by a slight shift in the renewable portfolio from photovoltaics to onshore wind, inducing also a small increase in the storage capacities. Because renewables lose the benefit of contributing to CO2 reduction, dumping RES production gets comparatively cheaper and the installations shift to the cheaper wind energy. The resulting increase in the share of unused RES electricity is only partly compensated by the increase in storage capacities.
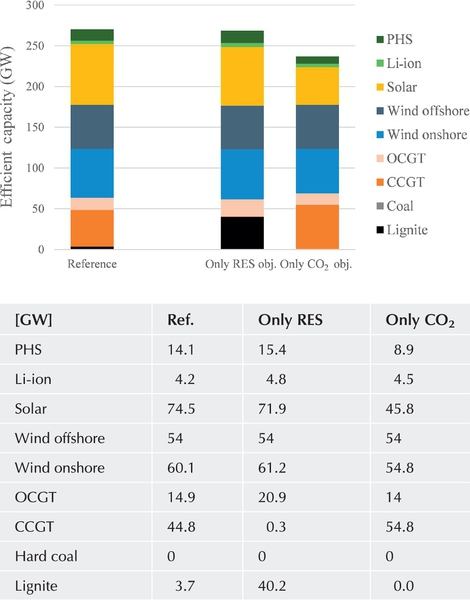
In the opposite case, when the RES objective is abandoned but the CO2 objective maintained, lignite drops out of the efficient portfolio and CCGT increases. Correspondingly, less renewable capacities are needed to satisfy the CO2 bound and, consequently, the need for longer term storage via PHS is also reduced. The CO2 price, which indicates the marginal costs of CO2 reduction, increases in this scenario to ![]() . This also increases the base electricity price to 104 EUR/MWh. At the same time, system costs drop by about 1 bn€ to 42 bn€. These results seem contradictory at first sight, yet are perfectly consistent with economic efficiency (in the model setting): adding another constraint like the RES requirement will always lead to an increase in system cost, unless the constraint is not binding (i.e., superfluous). On the other hand, this constraint is instrumental for achieving the CO2 target; therefore, the marginal costs attributable only to the CO2 target drop when the RES constraint is introduced. Because the RES constraint creates additional revenues for the RES producers, the electricity price needed to recover the capital costs decreases. From a consumer perspective, the double objective therefore seems preferable at first sight, yet government revenues are much lower in that case and, consequently, consumers are likely to be charged in other ways to cover government spending.
. This also increases the base electricity price to 104 EUR/MWh. At the same time, system costs drop by about 1 bn€ to 42 bn€. These results seem contradictory at first sight, yet are perfectly consistent with economic efficiency (in the model setting): adding another constraint like the RES requirement will always lead to an increase in system cost, unless the constraint is not binding (i.e., superfluous). On the other hand, this constraint is instrumental for achieving the CO2 target; therefore, the marginal costs attributable only to the CO2 target drop when the RES constraint is introduced. Because the RES constraint creates additional revenues for the RES producers, the electricity price needed to recover the capital costs decreases. From a consumer perspective, the double objective therefore seems preferable at first sight, yet government revenues are much lower in that case and, consequently, consumers are likely to be charged in other ways to cover government spending.
If climate change mitigation is considered as the primordial objective, the efficient solution hence is the reliance on a single CO2 constraint. Setting a binding RES objective in addition has the effect of pushing RES, while at the same time keeping low-cost technologies (lignite) longer in the efficient portfolio. These interdependencies between the different objectives are discussed further in the following sensitivity analyses.
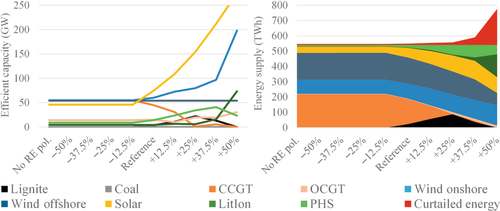
The RES policy sensitivity in Figure 9.6 analyzes the effect of a variation of the RES objective between 33% and 98% (sensitivities − 50% to + 50% compared to the reference case). The RES objective is only binding in the reference case and when the objective gets more restrictive (increasing the minimum share of RES). Up to the + 25% sensitivity, CO2 restriction is binding, and lignite is progressively displaced by CCGTs. After this point, the path is driven only by the renewable energy (RE) policy. Without binding CO2 constraint, lignite is the most efficient conventional technology, which fades out when RES approaches the 100% scenario. The storage capacity of PHS increases with RES expansion but drops in the last step. This is an effect of limited sites for PHS. With extremely high RES penetrations, it gets more important to store energy for longer periods (increasing the full load hours). In this case, efficient Li-ion capacity raises sharply from 16 GW to 73 GW.
To study the effect of an increasing CO2 target, Figure 9.7 shows the efficient capacities and generation volumes for power systems with 10% up to 30% of CO2 emissions compared to 1990 (again − 50% to + 50% compared to the reference case). With the 30% target, all technologies except hard coal are part of the efficient generation portfolio. Among storage plants, PHS accounts for more than triple the capacity of Li-ion batteries. Moving from right to left, the additional emission reductions are entirely realized by a coal-gas switch, with generation volumes (and the corresponding capacities) moving from lignite to CCGT, while the renewable capacities and storage remain constant. Only when lignite is entirely replaced by natural gas (at a CO2 target of about 18% compared to 1990) do wind and solar capacities start to increase further. Most prominently, a sharp rise in photovoltaic capacity can be observed, with capacity almost doubling between 80% and 90% CO2 emission reduction. This strong rise is complemented by a significant increase of PHS capacity (from 14 GW to 32 GW), while the efficient Li-ion capacity stays roughly the same. Figure 9.7 also indicates that the “curtailed energy” increases only slightly; the additional storage capacity hence allows commercializing most of the additional intermittent feed-in.

Unlike in the RE sensitivity, the CO2 restriction is binding in all cases. With fewer CO2 restrictions, lignite will increasingly be part of the efficient portfolio and substitute for CCGT.
9.5 Conclusion
Policy makers target large-scale changes to power systems to reduce CO2 emissions and thereby slow down climate change. To achieve this target, conventional generation technologies using fossil fuels must be reduced, and the use of RES and storage increased. From today’s point of view, wind onshore, wind offshore, and photovoltaics will make the largest contribution in an RES-dominated system. With PHS and Li-ion, two proven technologies are available for storage plants, although Li-ion batteries have so far hardly been applied at large scales.
Using an optimization model as presented in this chapter, the main drivers of change in the German energy system can be analyzed. In consideration of the political objectives of a minimum share of RES in the power supply and a limitation in CO2 emissions, photovoltaics and storage play a key role in the efficient portfolio for 2040. Efficient photovoltaic capacity of 75 GW comes around more or less twice as high as in 2014, and PHS capacity increases from around 6 GW in 2014 to 14 GW in 2040. While today Li-ion is hardly used for power management, the technology could play a role in future power systems (with an efficient capacity over 4 GW, according to the optimization). Sensitivity analyses show the high dependency of storage capacities on investment costs and political objectives.
Analyzing shadow prices of main restrictions allows statements concerning average cost of an additional unit of demand (electricity price), the magnitude of CO2 prices to achieve the CO2 target, and required incentives for RES to be competitive in the market. While the limitation to a CO2 emission reduction target only reduces system cost, the combination with an RES share objective allows for more technologies to be part of the efficient portfolio.
Interpreting the optimization results, it should be noted that the present analysis neglects factors such as cross-border interconnections (increasing flexibility and reducing storage capacity) and grid restrictions (decreasing flexibility and potentially leading to higher storage capacity). In addition, further studies could evaluate power-to-gas as a further technology, especially for extreme cases with close to 100% RES. In sum, though, the present analysis sheds light on important mechanics concerning the efficient interaction of photovoltaic and storage plants in a future power system.