
Storage of Solar Thermal Energy in Dependency of Geographical and Climatic Boundary Conditions
Roman Marx Institute of Thermodynamics and Thermal Engineering (ITW), Research and Testing Centre for Thermal Solar Systems (TZS), University of Stuttgart, Stuttgart, Germany
Abstract
Thermal energy storage is a method to balance the temporal fluctuating solar heat gained by solar thermal collectors with the heating demand for domestic hot water preparation and space heating on the building level. Both solar yield and heating demand depend on climatic boundary conditions, which change depending on geography. Furthermore, regulations on building standards in different countries or local individual user behaviors (e.g., for hot water consumption) have further, nonnegligible influence. Those factors can sometimes even neutralize each other, and must be quantified and taken into account in order to design an energetic and economic solar thermal system for each specific location. Considering all above factors leads to the result that solar thermal applications are technically meaningful at many locations, and geographically even more homogenously distributed than single boundary conditions like solar irradiation may expect.
5.1 Introduction
In solar thermal applications, the fluctuating solar irradiation (and thus solar yield) and the actual heating demand of connected consumers are rarely equal by time and magnitude. Hence, storage of thermal energy is important to balance this mismatch. Storing thermal energy to cover the heating demand for domestic hot water (DHW) preparation and space heating for residential buildings can be distinguished by storage duration. There are short-term, long-term, and seasonal thermal energy storage (TES) concepts. The short-term TES concepts are mainly to balance day to night periods up to a few days. The long-term TES concepts can store thermal energy for several weeks. Their intention is to shift some heat from periods of high solar yield to times of high heating demand, and they can bridge some time of low solar irradiation (e.g., during cloudy periods). Seasonal TES is often used within solar district heating (SDH) networks consisting of large volumes in the range of a few 1000 m3 to many 10,000 m3. If these are designed well, they can store the thermal energy from summer at times of high solar thermal yield to winter at times of high heating demand. An additional differentiating factor is the desired scope of application of the TES. It can either be installed in systems providing heat for DHW preparation or for the combination of DHW preparation and space heating. Usually, TES for combined purposes is larger in volume because it needs to cover a higher heating demand.
The incipient statements are generalized for a fixed location of application. The dimensioning of solar thermal installations including TES relies on more than the scope of application. There are several boundary conditions that affect the size of both the solar thermal collector area and the volume of the TES. The main factors are solar irradiation and heating demand. These factors must be taken into account on an annual basis, but even more important, by the course of transient changes during shorter periods of time. One must consider if there is a good match between solar yield and heat demand at an overlapping period of time, or if there is a long period of time in between. This interrelation depends strongly on geographical and climatic boundary conditions. The dependency of all boundary conditions will be discussed in this chapter, focusing on the situation in Europe.
5.2 Influencing Boundary Conditions
The focus of the assessment in this chapter is on the region of Europe. The limitation to Europe is justified because of its large north-south extension, many different countries with individual building stock, and profound databases for all significant boundary conditions for the assessment. Furthermore, ambitious goals in European energy politics toward a predominant renewable energy supply create a huge market in Europe for solar thermal applications. According to the ESTIF (2013), the installed solar thermal capacity was 28 GWth in the 27 EU countries and Switzerland in 2012 (glazed collectors). This corresponds to an annual solar thermal energy supply of 20 TWhth. Moreover, the IEA (2012) estimates a solar thermal energy supply of about 280 TWth for Europe in 2050 on building level for DHW preparation and space heating, not taking SDH into account.
5.2.1 European Climate
Europe has a north-south extension of about 3800 km and east-west extension of about 6000 km. It reaches from the 35th to 70th latitude north. Thus, significantly different climates can occur among the European countries. According to the Köppen-Geiger climate classification by Peel et al. (2007), the European climate has a range from arid to polar, with a large share of cold climate. The main factors for the classification are the ambient air temperatures in summer and winter, as well as precipitation during those periods. Ambient air temperature especially influences heating demand. In Europe, the mean ambient air temperature varies between − 2 and + 19 °C.
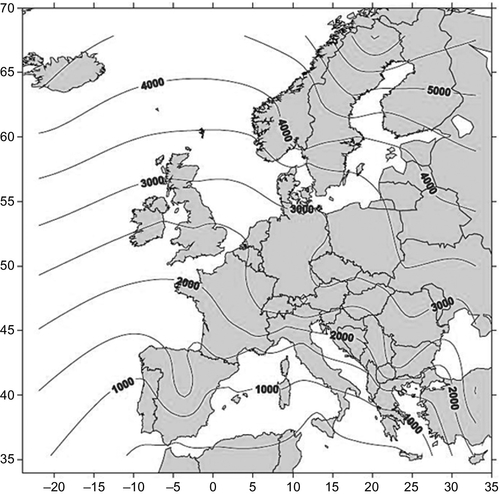
A method to correlate ambient air temperature with heating demand can be done by heating degree days (HDDs). An HDD is defined as the sum of daily temperature differences between an effective room temperature and the mean ambient air temperature, when it is lower than a defined limiting temperature. Within the work of Ecoheatcool and Euroheat & Power (2006), a map of Europe has been developed in which HDD isolines have been implemented, interpolated by 80 measurement stations (see Figure 5.1). Internationally, there is no harmonized definition for the limiting temperatures of HDDs. In the case of Ecoheatcool and Euroheat & Power (2006), an effective room temperature of 17 °C has been defined. It is selected relatively low to consider additional internal heat gains (e.g., by persons, electric energy consumption, etc.). The limiting ambient air temperature, when heating starts, is set to 13 °C, taking passive solar gains of the building into account. In Figure 5.1, one can see that HDDs differ significantly within Europe. In south Italy, with about 500 Kd, the HDD is 11 times smaller than in the north of Scandinavia. Hence, it could be assumed that the heating demand is also much higher in Scandinavia than in the Mediterranean region. This is not the case, because there are large differences in the building construction design between those regions.
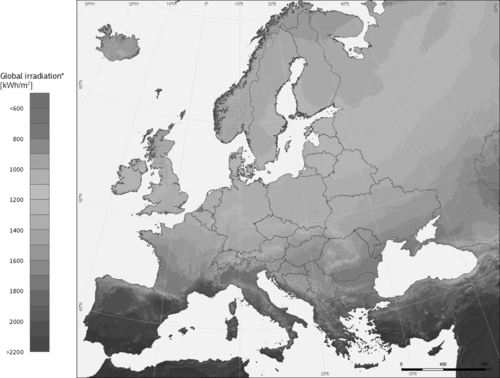
A further factor related to climate and latitude is solar irradiation. It not only determines the potential solar yield by solar thermal collectors, but also influences significantly the ambient air temperature and thus the heating demand. Hence, the solar thermal collector area needs to be dimensioned according to solar irradiation and the kind of application (DHW preparation or a combination of DHW preparation and space heating). Because the thermal energy store levels out the fluctuations between solar yield and heating demand, the storage capacity must be dimensioned accordingly. Figure 5.2 illustrates the distribution of solar irradiation in Europe. The annual sum of solar irradiation is shown on an optimally incident surface and azimuth directed to the south. The range of potential solar irradiation differs between 800 and 2200 kWh/(m2 a). A north-south gradient can clearly be identified, in addition to a west-east gradient. Particularly at the coastal regions in central and northern Europe, the solar irradiation is lower than in more continental regions at the same latitude.
5.2.2 European Building Stock
Considering the climatic boundary conditions, a clear tendency for favorable solar thermal applications in southern European countries can be concluded. However, these are not the only factors influencing the dimension and design of the technology.
The construction of buildings, and thus their heating demand, is also a crucial factor. Nowadays, thermally well-insulated buildings are standard in newly built houses. In many European countries, certain standards are even regulated by law in order to reduce the primary consumption. Hence, the heating demand decreases in those buildings. The lowered heating demand can be covered more easily by solar thermal applications. Nevertheless, newly built houses are only a minority in the entire building stock within Europe. Many buildings in Europe are older than 50 years. According to the BPIE (2011), about 40% of all buildings were erected before 1960, which was before any regulations regarding energy savings or efficiency came into effect. Further, the retrofitting rate of buildings is about 1% per year. That means that the change within the building stock is proceeding slowly.
Focusing on European residential buildings is meaningful, having a share of 75% of all buildings (BPIE, 2011). Furthermore, the share of single-family houses is about 64%, compared to a share of 34% of multifamily houses. Single-family houses are characterized by a relatively high surface-to-volume ratio compared to larger buildings. The higher the heat exchanging surface of buildings, the higher the heat losses; thus, the heating demand increases. To reduce the primary energy consumption of such buildings, the heating demand can be reduced by thermally insulating the building's facade, or by including renewable energy sources such as solar thermal application. The large advantage of solar thermal applications for single-family houses is that there is usually enough space for solar thermal collectors on the roof. Thus, including solar thermal in those buildings can be an effective and also more economic measure to reduce the primary energy consumption instead of insulating the facade.
Taking retrofitting of solar thermal applications into account, the heating demand of European buildings must be assessed in order to evaluate their potential. The heating demand of buildings depends on several factors. The main factors are the standard of thermal insulation, air exchange rate, gross area of the building, and individual DHW consumption. These factors can differ significantly throughout Europe and counterbalance advantages of the climate.
The standard of insulation varies among European counties. For example, in Figure 5.3, the U-values (W/(m2 K)) of external walls are shown for Sweden and the Netherlands at different periods of construction. The trend toward lower U-values and thus lower heat losses of the buildings can clearly be seen. Nevertheless, this example highlights the obvious differences in thermal insulation standards in different countries.

The air exchange rate differs in a similar magnitude as the U-values. Often having ventilation systems that do not include heat recovery, a too-high air exchange rate induces unnecessarily high heat losses. According to BPIE (2011), the air exchange rate is for houses constructed since 2000 (e.g., 0.2 1/h in Germany, 0.6 1/h in Denmark, 4 1/h in the Czech Republic).
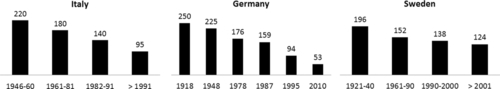
The U-value and air exchange rate influence the specific heating demand (kWh/(m2 a)) of buildings. In Figure 5.4, the specific heating demands of single-family houses are shown for three different countries from three regions of Europe, taking different periods of construction into account. According to the development of the U-values, the specific heating demand also decreases for all depicted countries by time. Although in Sweden and Germany the HDDs (compare Figure 5.1) are several times higher than in Italy, the specific heating demand is in a similar range. This demonstrates that the building stock has already been adapted to the specific climate for a long time in order to reduce heating demand. Thus, the climate has a much smaller influence on the heating demand, as indicated by the HDD.
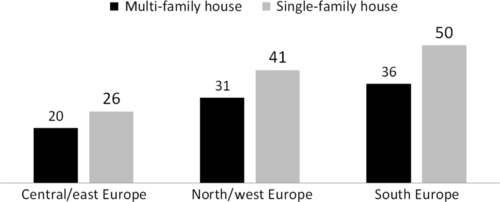
The previously described values are specific values. To quantify these values, they must be combined with the actual gross floor area of the buildings. In Figure 5.5, the average gross floor areas for single and multifamily houses are depicted for different regions of Europe per capita. Again, the distribution is heterogeneous throughout Europe. The fact that space requirements per capita are the largest in southern Europe is important. That means that even though low values occur for the specific heating demand in southern Europe, in combination with the largest space to be heated, the total heating demand increases. The total heating demand of the building can even be higher in the milder south than it is in significantly colder regions of Europe.
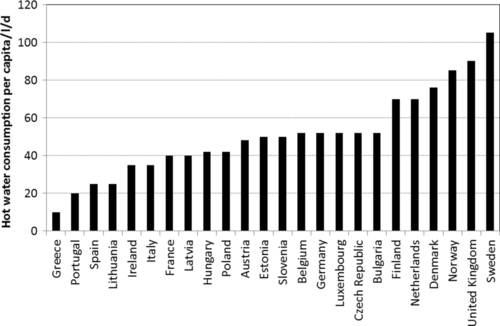
In addition to the heating demand for space heating, the heating demand for DHW preparation must be considered. Particularly for new buildings with very sophisticated thermal insulation, the demand for DHW preparation can be a large share of the total heating demand. Also, regarding solar thermal systems for DHW preparation only, this heating demand is a very important boundary condition for the dimensioning of the system. Based on the latest available Eurostat data (1999), the distribution of hot water consumption per capita is shown in Figure 5.6. The average hot water consumption in Europe is about 50 l/d per capita, but large differences between countries can be seen. In the data, a temperature lift from cold to hot water of 50 K is considered, as well as circulation heat losses. A generally lower hot water consumption can be estimated compared to the Eurostat data (1999) using current water saving devices, but the qualitative distribution may persist. Again, a geographical deviation of the hot water consumption can be assessed. Predominantly in the southern regions of Europe, the hot water consumption is lower than the average, and in the northern regions of Europe, it is above the average consumption.
5.3 Classification of Solar Thermal Systems with TES
Depending on the kind of solar thermal system, different boundary conditions affect the design and dimension of the TES. In this chapter and in Chapters 4, 6, and 10, different TES concepts and designs are described. In order to determine the influence of the different geographical and climatic boundary conditions, three different TES applications have been selected.
The first system is a system for DHW preparation only. It consists of solar thermal collectors and a buffer store separated from the heating loop for space heating. Predominantly in summer, the solar yield can be used to achieve high solar fractions for DHW preparation. The typical solar fraction of this system is within the range of 50-60% of the annual DHW preparation in central/western Europe. The solar fraction is defined in Equation (5.1). In the case of systems for DHW preparation only, the heating demand for DHW preparation is considered; for the other two examples of systems, the sum of both heating demand for DHW preparation and space heating is considered.

The second system is a solar combi-system: it combines the use of solar thermal energy for DHW preparation and space heating. Hence, the solar collector area and the TES capacity (and thus volume) are dimensioned larger than for the first system. The solar combi-system assists the conventional heating system for space heating. The system requires a more sophisticated control strategy than the first system to manage storage and distribution of solar heat for DHW preparation and space heating. The buffer tank stores thermal energy for DHW preparation and space heating. The typical solar fraction of solar combi-systems is within the range of 25-35% of the entire annual heating demand in central/western Europe.
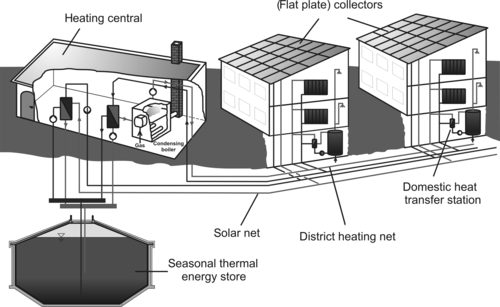
The third system considered for this assessment is a SDH system with seasonal TES. In comparison to the first two systems, a centralized seasonal TES and heating station are integrated into the system. The buildings are connected to a district heating net. Usually, the minimum amount of dwellings connected to those types of system is 100 (Bauer et al., 2010). The solar thermal collectors can be mounted on the buildings' roofs or on the ground, depending on availability. The collector fields are connected to the heating station by a solar net. The seasonal TES is designed in such a way that it can store enough thermal energy at times of high solar yield in summer for times of high heating demand in fall and winter. Backup heating usually consists of boilers using, for example, oil or gas as conventional energy sources, or biofuels such as wood chips as renewable energy sources. To increase the performance of the solar thermal components, heat pumps are often integrated into the systems (Marx et al., 2013). Those systems usually achieve solar fractions of around 50% of the total annual heating demand. Figure 5.7 shows a simplified scheme of a typical SDH system.
5.4 Case Study to Evaluate the Influence of the Diversity of Boundary Conditions
As previously described, solar thermal applications can significantly reduce the primary consumption of conventional energy sources in buildings. A large variety of boundary conditions influence the dimension of solar thermal systems. Some boundary conditions are transient (e.g., weather or heating demand). Thus, stationary calculations do not represent the actual behavior of the system correctly. Therefore, transient system simulations need to be carried out. Stepper (2014) has investigated climatic and geographical boundary conditions within his work by such transient simulations carried out with the program TRNSYS (Klein et al., 2010).
In order to reduce the amount of configuration, some simplifications have been made. The investigated building stock is reduced to single-family houses from the 1980 standard with a radiator heating system (max. 70/50 °C supply/return temperature) and the new building standard with under-floor heating (max. 35/28 °C supply/return temperature). For both heat distribution systems, a heating curve depending on the outside temperature has been applied. The gross floor area of the buildings is set to a European mean value of 152 m2, taking four inhabitants per dwelling into account. Additionally, a district heating net (65/40 °C supply/return temperature) with an annual heat demand of 1500 MWh, consisting of the previously defined new single-family houses, has been chosen.
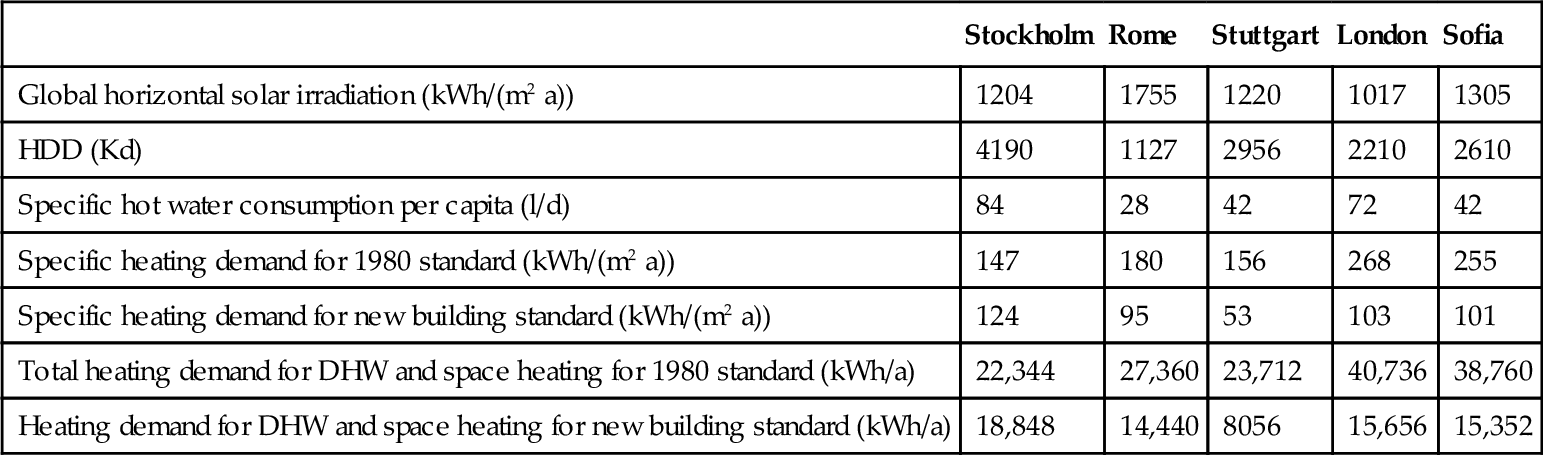
Five representative locations have been selected within Europe, each representing a different region with its own specific climate, building standard, and user behavior. The locations selected are Stockholm, representing the Scandinavian region; Rome, representing the Mediterranean region; Stuttgart, representing central Europe; London, representing the Gulf Stream influenced region; and Sofia, representing central eastern Europe. In Table 5.1, the individual parameters of each location are listed. The heating demand for DHW preparation is reduced by 20% compared to Eurostat data (1999) to take energy saving measures into account. For the 1980 building standard, Stockholm has the lowest total heating demand of all locations, and London has the highest. For the new building standard, Stuttgart has the lowest heating demand, and Stockholm has the highest.
Table 5.1
Parameters of the Different Locations of the Case Study (According to Meteonorm, Ecoheatcool and Euroheat & Power (2006), and BPIE (2011))
| Stockholm | Rome | Stuttgart | London | Sofia | |
| Global horizontal solar irradiation (kWh/(m2 a)) | 1204 | 1755 | 1220 | 1017 | 1305 |
| HDD (Kd) | 4190 | 1127 | 2956 | 2210 | 2610 |
| Specific hot water consumption per capita (l/d) | 84 | 28 | 42 | 72 | 42 |
| Specific heating demand for 1980 standard (kWh/(m2 a)) | 147 | 180 | 156 | 268 | 255 |
| Specific heating demand for new building standard (kWh/(m2 a)) | 124 | 95 | 53 | 103 | 101 |
| Total heating demand for DHW and space heating for 1980 standard (kWh/a) | 22,344 | 27,360 | 23,712 | 40,736 | 38,760 |
| Heating demand for DHW and space heating for new building standard (kWh/a) | 18,848 | 14,440 | 8056 | 15,656 | 15,352 |
At each location, the three solar thermal systems defined in Section 5.3 have been applied. The values in Table 5.1 highlight that the heating demand for DHW preparation and space heating differs significantly within Europe. Hence, reaching a certain solar fraction at each location also requires different amounts of solar thermal energy delivered into the system. This can lead to very large solar systems (collector area or TES) at some locations. As it is economically unreasonable to achieve a certain solar fraction at each location, energy saving potentials have been defined for the decentralized small-scale systems. Thus, for systems with DHW preparation only, 1, 1.5, and 2 MWh/a of effective energy savings by the solar thermal system have been defined. For the solar combi-systems, effective energy savings of 2, 3, and 4 MWh/a have been defined. For the simulation only, the collector area and TES volume have been varied. Many combinations of solar collector area and TES volume can meet the defined savings for each location, but not every combination is economically reasonable. To achieve a specific energy savings or solar fraction, for instance, one can either use a system with a very large collector area and a very small capacity of TES, or a system with a smaller collector area and a suitable capacity of TES. There are technical issues to be considered, such as stagnation of the solar thermal collectors and economic factors. Combining the components' dimensions (collector area and TES volume) with their costs enables the possibility of finding the most economical solution. Depending on many factors, the prices for solar collectors and TES can vary (e.g., volume-specific costs for smaller TES are higher than for larger ones). For this assessment, both for the solar collectors and the TES, a price range has been applied. For the solar collectors (flat-plate collectors), prices between 220 and 540 €/m2 have been estimated; for the TES (hot-water buffer tanks), prices between 350 and 1200 €/m3 have been estimated. Both price ranges are without VAT and installation. A minimum case analysis has been carried out to determine the most economical configuration. The most economical configuration using the least expensive collector price and the most expensive TES price and vice versa has been determined. The system configuration fulfilling the minimum and thus least expensive combination for both analyses is the most economical combination within the regarded price range. By this method, the most suitable configuration between solar collector area and storage capacity can be determined for each location under economic considerations. Evaluating the most suitable economic configuration by technical requirements (e.g., minimization of stagnation) shows good agreement between those two criteria, and an overall good configuration has been determined.
For the SDH system, the approach differs from that of the single-family house. Being able to configure the district heating net of a variable number of dwellings, for each location, a district heating net with an annual heating demand of 1500 MWh has been defined. Having the same heating demand at each location leads to equal solar fractions, for the same energy savings by solar thermal energy at every system. Hence, defining a uniform solar fraction makes it possible to compare the systems to each other very well. For this case study, a solar fraction of 50% has been defined. The system consists of a buried hot-water TES as seasonal TES and a hot-water buffer tank. The solar thermal collectors are connected to the buffer tank, either supplying the solar heat directly to the district heating net or charging the surplus into the seasonal TES. In between the buffer tank and the seasonal store, a heat pump is installed. If the temperature level of the seasonal TES decreases below the temperature level for a direct use of the stored thermal energy, the heat pump can further discharge the seasonal TES. If the solar part of the system, including the heat pump, cannot ensure a high enough temperature level in the buffer tank to deliver heat to the district heating net at 65 °C, a gas boiler starts to operate as a backup heating system.
Just like for the system, on a single-family house level, the volume of the TES and the collector area have been varied. Regarding the TES volume, the main focus was on the volume of the seasonal TES, but some variations of the volume of the buffer tank have also been undertaken. Furthermore, the thermal power of the heat pump has been varied. Similar to the small-scale systems, different configurations can lead to a solar fraction of 50%. Thus, the cost minimum has been determined using the following cost estimations:
– Flat-plate collector: 220 €/m2
– Buffer tank: 350 €/m3
– Seasonal TES (logarithmic interpolation based on the realized hot-water tank TES in Germany (Mangold et al., 2011) and taking a nonlinear cost reduction in dependency of the volume into account): (− 129.843 ln(VolumeTES[m3]) + 1289.567) €/m3
5.4.1 Results of the Case Study for the System for Only DHW Preparation
The system assisting the DHW preparation is the smallest considering the heating demand, but it is also the most common one in Europe (IEA, 2013). In Table 5.2, the simulation results are listed for effective energy savings for 1, 1.5, and 2 MWh/a at the representative locations. The building standard is not considered because the DHW consumption is independent from the space heating demand. The results of the case study are that TES volume varies for each location within a similar range. The solar thermal collector area differs more significantly; for example, the required solar thermal collector in London is twice as high as the one in Rome, considering the same amount of saved energy. For higher energy savings, not only larger collector areas, but also larger volumes are required. A ratio between TES volume and solar thermal collector area indicates the dependency of both values at each location. In this case, the ratio (VA-ratio) is defined as TES volume in liters divided by collector area in square meters (see Equation (5.2)):

Table 5.2
System Configurations for DHW Preparation with Energy Savings of 1, 1.5, and 2 MWh/a at Representative Locations
| Location | Energy Savings (MWh/a) | Collector Area (m2) | Storage Volume (m3) | Mean VA-Ratio (l/m2) | Solar Fraction at DHW (%) |
| Stockholm | 1 | 3 | 0.1 | 43 | 14 |
| 1.5 | 4 | 0.2 | 21 | ||
| 2 | 5.5 | 0.25 | 28 | ||
| Rome | 1 | 1.5 | 0.15 | 83 | 40 |
| 1.5 | 2.5 | 0.15 | 64 | ||
| 2 | 4 | 0.35 | 84 | ||
| Stuttgart | 1 | 3 | 0.15 | 59 | 29 |
| 1.5 | 4.5 | 0.25 | 42 | ||
| 2 | 7 | 0.5 | 57 | ||
| London | 1 | 3.5 | 0.15 | 45 | 17 |
| 1.5 | 5 | 0.25 | 25 | ||
| 2 | 7 | 0.3 | 33 | ||
| Sofia | 1 | 2.5 | 0.15 | 61 | 29 |
| 1.5 | 4 | 0.2 | 44 | ||
| 2 | 5.5 | 0.4 | 41 |

In Table 5.2, the mean values of the VA-ratio for all three energy savings are shown for each location. This approach is valid because the absolute values for each energy saving are within a close range. As indicated by the distribution of the collector area, the VA-ratio differs in a similar manner. In Stockholm, the lowest value of 43 l/m could be determined; in Rome, the highest value of 83 l/m2 could be determined.
The solar fraction at DHW preparation is also included in Table 5.2. Based on the very different thermal energy demand for DHW preparation and the fixed energy savings, the solar fraction varies significantly. Taking the two extreme examples of Stockholm and Rome, it can be seen that, for example, saving 1 MWh/a of energy leads to a solar fraction of 14% in Stockholm, but to 40% in Rome.
5.4.2 Results of the Case Study for Solar Combi-Systems
Similar to the results in the previous section, the results for the solar combi-systems providing solar thermal energy for DHW preparation and space heating are shown in Table 5.3. The effective energy savings have been defined as 2, 3, and 4 MWh/a of the total heating demand (DHW preparation and space heating) for both the building standard from 1980 and the new building standard. The results demonstrate that buildings from 1980 with a relatively high heat-distribution temperature (radiators) are less favorable than the new building standard with an under-floor heating system. The buildings from 1980 have a higher heating demand, and thus longer heating periods. In transit periods, there is a more timely overlapping of heating demand and solar yield; consequently, a better direct use of the solar yield is possible. However, systems with larger collector areas and TES volume are required to achieve the same amount of energy savings as those at the new building standard. Furthermore, higher VA-ratios are required for the solar combi-systems than for systems with only DHW preparation. This is logical because it is necessary to store a higher amount of thermal energy for DHW preparation and space heating than only for DHW preparation. Also, for the new building standard, the VA-ratio is in general higher than for the building standard from 1980, because the same energy savings result in higher solar fractions due to lower total heating demands. Therefore, the solar thermal energy needs to be stored for a longer period of time to make it usable at required periods of demand. Hence, the VA-ratio of combi-systems is not depending as clearly on the latitude of application as DHW systems. A clear geographical tendency cannot be determined by those values. Larger variations can be noticed for the different building standards (e.g., London or Stuttgart).
Table 5.3
System Configurations for DHW Preparation and Space Heating with Energy Savings of 2, 3, and 4 MWh/a for the 1980 Building Standard and the New Building Standard at Representative Locations
| Location | Energy Savings (MWh/a) | Collector Area (m2) | Storage Volume (m3) | Mean VA-Ratio (l/m2) | Solar Fraction (%) |
| Stockholm 1980 | 2 | 10 | 1.1 | 92 | 9 |
| 3 | 14 | 1.25 | 14 | ||
| 4 | 18 | 1.4 | 18 | ||
| Stockholm new | 2 | 6 | 0.5 | 93 | 12 |
| 3 | 7 | 0.8 | 16 | ||
| 4 | 10 | 0.8 | 22 | ||
| Rome 1980 | 2 | 7 | 0.5 | 77 | 8 |
| 3 | 10 | 0.8 | 11 | ||
| 4 | 14 | 1.1 | 15 | ||
| Rome new | 2 | 4 | 0.5 | 116 | 15 |
| 3 | 6 | 0.8 | 21 | ||
| 4 | 9 | 0.8 | 27 | ||
| Stuttgart 1980 | 2 | 12 | 1.1 | 81 | 9 |
| 3 | 18 | 1.1 | 13 | ||
| 4 | 22 | 2.0 | 17 | ||
| Stuttgart new | 2 | 6 | 0.8 | 119 | 27 |
| 3 | 10 | 0.8 | 38 | ||
| 4 | 14 | 2.0 | 49 | ||
| London 1980 | 2 | 12 | 1.1 | 75 | 5 |
| 3 | 18 | 1.1 | 7 | ||
| 4 | 24 | 1.7 | 10 | ||
| London new | 2 | 6 | 0.8 | 121 | 13 |
| 3 | 9 | 0.8 | 19 | ||
| 4 | 12 | 1.7 | 25 | ||
| Sofia 1980 | 2 | 11 | 0.5 | 73 | 5 |
| 3 | 14 | 1.1 | 7 | ||
| 4 | 18 | 1.7 | 10 | ||
| Sofia new | 2 | 6 | 0.5 | 83 | 14 |
| 3 | 8 | 0.8 | 21 | ||
| 4 | 12 | 0.8 | 26 |
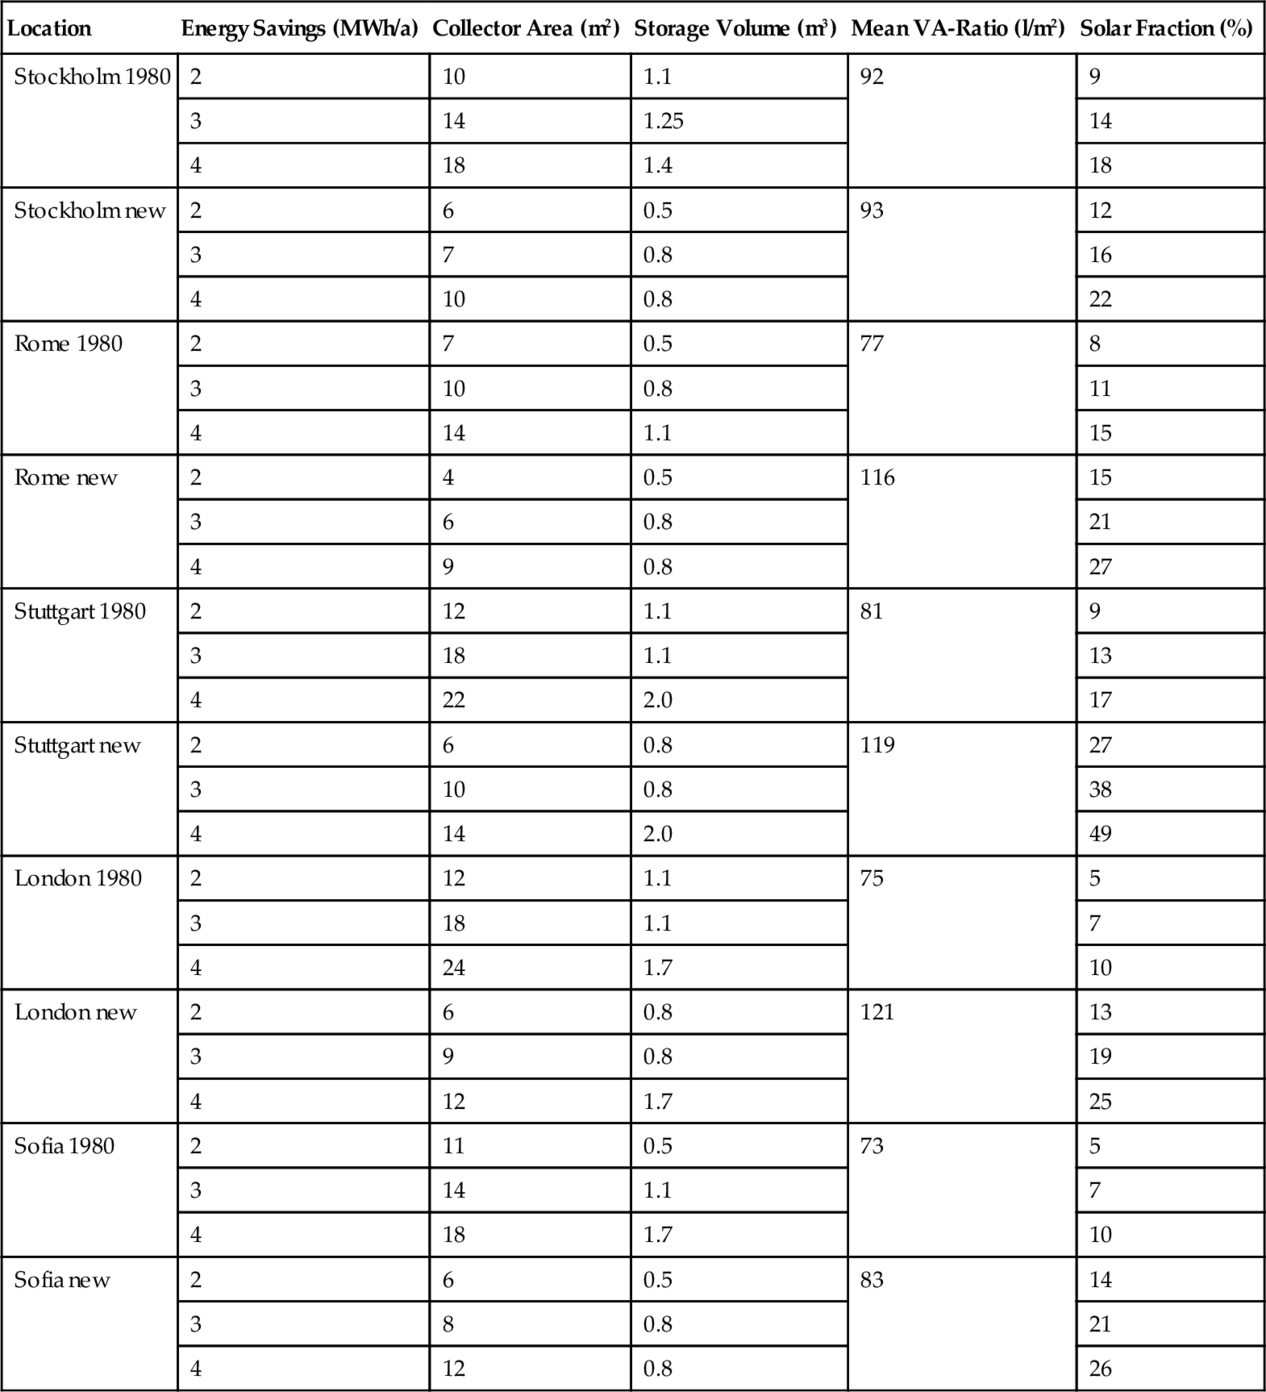
The solar fractions differ from location to location. In Stuttgart, for new buildings, energy savings of 4 MWh/a equal a solar fraction of 49%, while in Stockholm, the same amount of saved energy equals a solar fraction of 22%.
5.4.3 Results of the Case Study for the SDH System with Seasonal TES
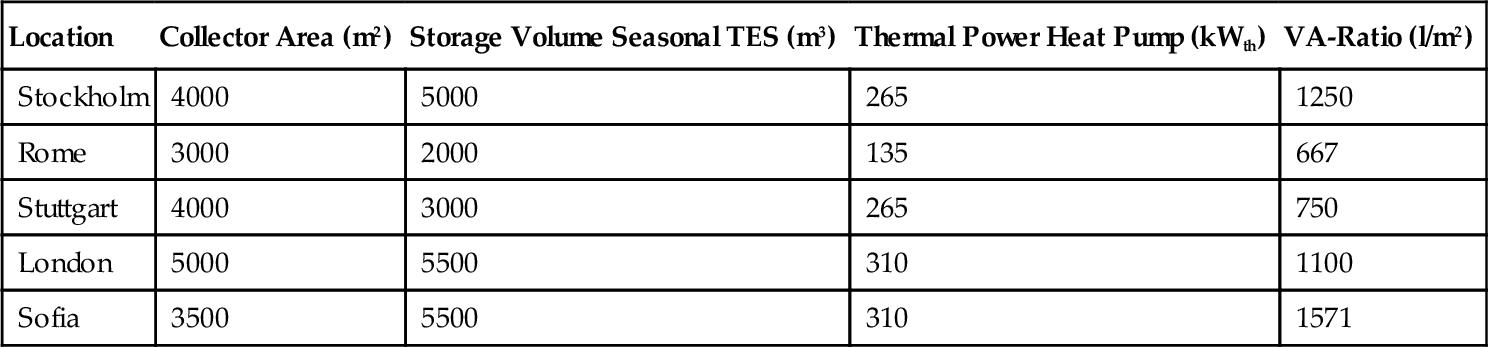
In comparison to the previously discussed systems, a constant heat demand could be defined for the SDH system, consisting of a different number of single-family houses, depending on the location. The number of houses differs between 109 in Stockholm and 132 in London. One exception is Stuttgart, consisting of 270 houses due to the very low heating demand of each house compared to the other locations (see Table 5.1). The simulations have resulted in an optimum buffer TES of a volume of 100 m3 at each location. All other values are listed in Table 5.4. Additionally, the thermal power of the heat pump integrated into the system has been evaluated. The results of the collector area show a dependency to the sum of the annual solar irradiation. In Rome, for the highest solar irradiation the smallest collector area is required, and in London, the opposite is true. Also, a certain correlation between the specific heating demand and the volume of the seasonal TES can be seen. In Stockholm, London, and Sofia, the specific heating demand is higher than 100 kWh/(m2 a). At these locations, the seasonal TES is also the largest. The reason for this is that having a higher specific space heating demand reduces the heating demand for DHW preparation at constant total heating demand. Hence, the solar thermal energy needs to be stored for a longer period of time, instead of using it time-near for DHW preparation. This requires larger storage capacities, which are realized by larger TES volumes. The heat pump dimension is dependent on the storage capacity because the TES serves as the heat source for the heat pump. The larger the heat source, the higher the thermal power of the heat pump must be in order to be able to use the stored thermal energy for heating purposes. The VA-ratio is significantly higher than for the small-scale systems. Like the size of the volume of the seasonal TES, the VA-ratio depends on the amount and period of time the thermal energy needs to be stored. Furthermore, being able to achieve a 50% solar fraction by a larger share of DHW preparation increases the cycle number of the seasonal TES (numbers of cycles of charging and discharging the TES within a period). Consequently, the usable capacity of the TES is increased, and thus can be designed smaller to store in total the same amount of thermal energy as a TES with a lower cycle number.
Table 5.4
SDH System with Seasonal TES and a Solar Fraction of 50% at Representative Locations
| Location | Collector Area (m2) | Storage Volume Seasonal TES (m3) | Thermal Power Heat Pump (kWth) | VA-Ratio (l/m2) |
| Stockholm | 4000 | 5000 | 265 | 1250 |
| Rome | 3000 | 2000 | 135 | 667 |
| Stuttgart | 4000 | 3000 | 265 | 750 |
| London | 5000 | 5500 | 310 | 1100 |
| Sofia | 3500 | 5500 | 310 | 1571 |
5.5 Conclusions
Assessing relevant boundary conditions, which can influence the design and dimension of solar thermal application, including TES, demonstrates that there is no universal dependency between geographic location and design and dimension of such systems. The climatic favorable conditions in southern regions are often neutralized by less efficient building standards or individual user behavior. The different building standards that are responsible for the buildings' heating demand rely heavily on laws and regulations by the individual authorities in each country or region.
The case study for solar thermal systems for DHW preparation demonstrates a certain geographical dependency on the dimension of such systems. The VA-ratio of those systems depends on the latitude of location. In the south, the value is the highest; in the north, the value is the lowest. That means that, in general, larger collector areas at similar TES sizes are required in the northern regions to achieve comparable effective energy savings as in the southern regions.
Examining solar combi-systems, a geographical dependency cannot be observed. The total heating demand, which depends on the building standard, has a much higher influence on design and dimension. Furthermore, the temperature range of the heat distribution system within the building influences the dimensions significantly. The VA-ratio for the new building standard with a generally lower heating demand for space heating is higher than for the 1980 building standard. Having a shorter heating period for the buildings with the new standard requires a larger TES capacity (and thus volume to store the solar thermal energy for a longer period) to make it then usable for heating purposes.
For the SDH systems with seasonal TES, some dependency can be observed. The size of the solar thermal collector area depends on the amount of solar irradiation at each location. Higher solar irradiations lead to smaller collector areas, and vice versa. The storage volume respectively the storage capacity does not depend on geographical location; the ratio between the share of thermal energy required for the demand of DHW preparation and space heating is much more important. If the share of the space heating compared to DHW preparation is high, the seasonal TES needs to be dimensioned with a larger volume, because the thermal energy needs to be stored for a longer period of time. Contrariwise, if the share for DHW preparation is high and, which is nearly constant of time, the solar yield can be used more directly and the required storage capacity is smaller. The suitable heat pump of those systems depends on the capacity of the seasonal TES. The larger the capacity of the seasonal TES, the larger the thermal power of the heat pump needs to be in order to discharge the seasonal TES in times of heating demand.
Comparing all three different systems to each other shows that the VA-ratio increases also by the size of the system. The smallest VA-ratios are obtained by the systems only for DHW preparation, and the highest ratios by the SDH systems with seasonal TES. The assessment shows further that already with small systems, a significant share of energy can be saved. Nevertheless, considering only the costs for the collectors and the TES, the economics are in favor of the large systems. The specific cost for large TES is smaller than for large collector areas. The VA-ratio is higher for the larger systems than for smaller systems. Thus, the specific costs decrease for the larger systems compared to smaller systems.
This assessment includes some generalizations. Planning solar thermal systems at specific locations makes it necessary to take the specific boundary conditions at each site into consideration. Possible different heating loads and their profiles, as well as specific local investment costs, can make a difference on the results of the assessment carried out in this chapter. Thus, the dependencies and values of this chapter can serve only as a basis for the general evaluation of the potential at different locations. This does not substitute for the detailed design and dimensioning of the solar thermal system that needs to be carried out for each concrete application.