
Chapter 15
Getting Started with IAR Embedded Workbench for ARM®
Abstract
This chapter covers how to use the IAR Embedded Workbench for ARM® to develop simple programs for Cortex®-M0 and Cortex-M0+ microcontrollers. The topics covered include how to create and customize a project, program compilation flow, how to use the Integration Development Environment, and how to use some of the debug features such as using MTB for instruction trace.
Keywords
IAR Embedded Workbench for ARM® (EWARM) overview; Project creating; Project options and optimization; Software compilation flow; Using MTB for instruction trace; Using the debugger15.1. Overview of IAR Embedded Workbench for ARM®
IAR Embedded Workbench for ARM is a popular development suite for ARM-based microcontrollers. It contains the following:
• C and C++ compiler for various ARM processors
• Integration Development Environment (IDE) with project management and editor
• C-SPY® debugger with ARM simulator, JTAG support and support for RTOS-aware debugging on hardware (a number of RTOS plug-ins are available). The debugger supports various debug adaptors including the following:
• IAR I-Jet/I-jet Trace and JTAGjet/JTAGjet Trace,
• CMSIS-DAP,
• Segger J-Link/J-Link Ultra/J-Trace,
• GDB server,
• ST Link/ST Link v2,
• TI XDS 100/200 and Stellaris FTDI/ICDI,
• SAM-ICE (Atmel), …etc.
• Additional components including ARM assembler, linker and librarian tools, flash programming support
• Examples for various development boards from multiple manufacturers
• Documentation
The full version of IAR Embedded Workbench also supports the following:
• Automatic checking of MISRA C rules (MISCRA C:1998, MISRA C:2004)
• Source code for runtime libraries
• C-RUN runtime analysis (optional)
• C-STAT static analysis
IAR Embedded Workbench is a commercial tool. Various editions are available, including a free version called Kickstart which is limited to 16 KB1 code size (for Cortex®-M0 and Cortex-M0+ processors) and has some of the advance features disabled. You can also download a fully featured version for a 30 days evaluation.
IAR Embedded Workbench is easy to use and supports many debug features available in the Cortex-M processors. In this chapter we will demonstrate the use of IAR Embedded Workbench for ARM with the Freescale Freedom board FRDM-KL25Z. Before you start, please read section 14.3.1 regarding updating the firmware and device driver installation.
In the example code package from the companion Web site for this book, there are additional examples for other hardware listed in section 14.3.
15.2. Typical Program Compilation Flow
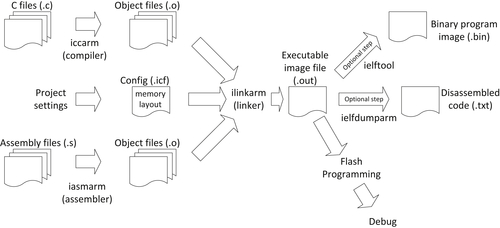
Just like most commercial development suites, the compilation process is handled automatically by the IDE and can be invoked easily by the GUI. So in most cases you do not need to understand the details of the compilation flow. Once the project is created, the IDE automatically invokes various tools to compile the code and generate the executable image, as shown in Figure 15.1.
Most of the device configurations such as configuration files for memory layout, flash programming details are preinstalled so that you only need to select the right microcontroller devices in the project settings to enable the correct compilation flow.
In order to simplify the application development and allow quicker software development, in most cases you will be using a number of files prepared by the microcontroller vendors so that you do not have to waste time in creating definition files for peripheral registers. These files are normally part of the CMSIS compliant device driver library from the microcontroller vendors. In many cases these are referred as software packages which might also include additional components such as examples, tutorials, additional software libraries.
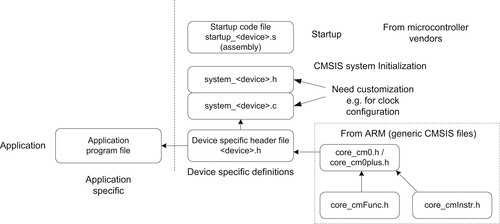
A minimalistic example project using CMSIS device library is illustrated in Figure 15.2.

While your application might only contain one file (left hand side of Figure 15.2), the project also includes a number of files from the microcontroller vendor. While you can create your applications almost entirely in C language, the start-up code which contains the vector table is often provided in form of an assembly code. The start-up code is tool chain specific. However, the rest of the files in the project are tool chain independent. In fact, in the blinky project example that we will cover in Section 15.3, apart from the assembly start-up code, all the other program code files are identical to the example project for Keil® MDK-ARM as in Chapter 14. This is an important advantage of the CMSIS-CORE because it makes most of the software components independent of the tool chain; hence the software codes are much more portable and reusable.
Additional CMSIS-CORE files are referenced by some of these CMSIS-CORE files. These are generic header files from ARM (bottom right-hand corner of Figure 15.3) and are integrated in the IAR Embedded Workbench installation. One of the project options enables these files to be automatically included during the compilation stage.
If necessary, you can disable this project option and add the generic CMSIS-CORE files into the project manually. This might be needed if you need to use a specific version of CMSIS-CORE files.
If you are using older versions of CMSIS-CORE (version 2.0 or older), you might also find that you need to include a file called core_cm3.c or core_cm0.c in the CMSIS-CORE package for some of the core functions like access to special registers and couple of intrinsic functions. These files are no longer required in newer versions of CMSIS-CORE, and the CMSIS-CORE functions are still fully compatible to older version.
15.3. Creating a Simple Blinky Project
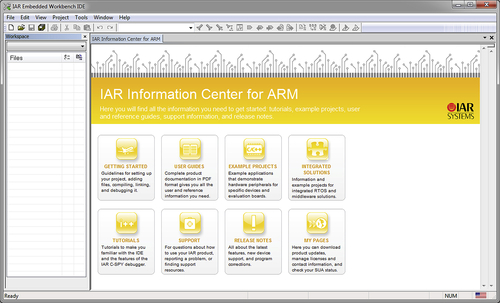
When IAR Embedded Workbench starts, you can see the screen as shown in Figure 15.4. You can open an existing example project by clicking on “EXAMPLE PROJECTS.” There are many ready-to-run examples that can serve as a starting point for application development. In this section, we look at how to create a new project from scratch.
We can create a new project using the pull down menu: Project → Create New Project…
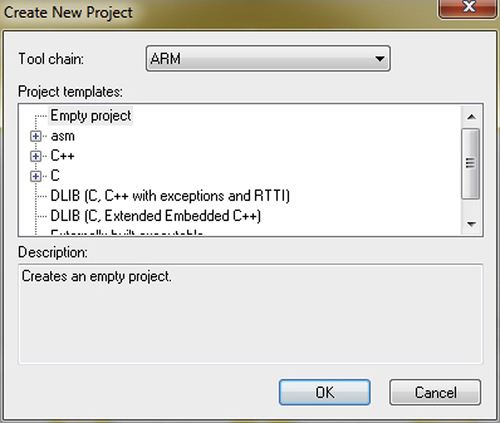
A new window will appear to allow you to select which type of project to create, as shown in Figure 15.5.
There are a number of choices here, for example, we can select:
• Create an empty project and add source code files we have already created, or
• Create a C project and that have a minimum main.c with “int main(void)”.
For this demonstration we select an empty project. The project wizard will then proceed to ask us to define the location of the project file. Here in this stage we create a project called blinky (Figure 15.6).

Once this is done, we have an empty project created, and we can start adding files to it.
In order to make the project more organized, we can add a number of file groups in the project and put different types of files into these groups. You can access to the add group/file function by right clicking on the project target (Debug) and select “Add,” as shown in Figure 15.7, or from the pull down menu, “Project → Add Group/Add File.”
For this project we create three file groups.
• Application (where the blinky program is placed)
• Startup (for the start-up code)
• CMSIS (for CMSIS-CORE-related files such as system_<device>.c)
In the following steps, the project setup step for Freescale FRDM-KL25Z is illustrated. For other hardware platform the steps are almost identical, just the filenames and the actual blinky code are different. For the Freescale FRDM-KL25Z hardware, the following files are added to the project, as shown in Table 15.1.

Table 15.1
| File | Description |
| startup_MKL25Z4.s | Startup code (in Assembly) for MKL25Z. This file is specific to IAR Embedded Workbench. |
| MKL25Z4.h | Device definition files including peripheral register definitions, exception-type definitions. |
| system_MKL25Z4.c | System initialization function (SystemInit()) for MKL25Z and related functions as specified in CMSIS-CORE. |
| system_MKL25Z4.h | Header file for defining function prototypes of functions in system_MKL25Z4.c. |
| blinky.c | The blinky application which toggles LEDs on the board. |
After adding the blinky program and the additional files to the project, a project navigation window as shown in Figure 15.8 is obtained. We have not explicitly included other CMSIS Header files as these can be automatically included using a project option (General option, see Table 15.2).
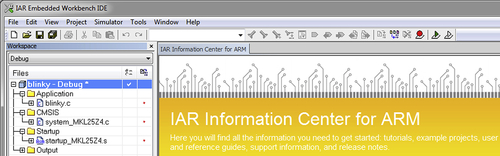
Table 15.2
Useful project options for the blinky project
| Category | Tab | Details |
| General options | Target | Device → MKL25Z128xxx4 |
| General options | Library configuration | Use CMSIS. This automatically includes essential CMSIS-CORE Header files in the project. |
| C/C++ Compiler | Optimizations | Optimization options. This is optional for the blinky project. |
| C/C++ Compiler | List | Output list file. This is optional, but can be useful for debugging. |
| C/C++ Compiler | Preprocessor | Include directory and preprocessing macros. |
| Linker | Config | Optional settings: Override default if you need to change the memory map (e.g., different stack and heap size) |
| Debugger | Setup | CMSIS-DAP. Use the on-board debug adaptor for debug. |
| Debugger | Download | Enable “Use flash loader(s)” option. This essential step enable flash download to the microcontroller. |
| CMSIS-DAP | JTAG/SWD | Optionally specify debug protocol and debug connection speed. |
In the next steps, we need to set up various project options. For minimum, a number of project options are essentials, for example:
• Device
• Enable CMSIS
• Include path for device-specific header files
• Enable flash programming option
• Debug adaptor options
Note: For user of the STM32L0 Discovery development board, an additional preprocessing macro “STM32L051xx” needs to be defined in the project.
The project options can be accessed by right clicking on the project target (“blinky—Debug” as shown in Figure 15.8), by the pull down menu (Projects → Options), or by shortcut key ALT-F7. There are wide ranges of project options available, for many categories on the left, you can find multiple tabs. For example, in the “General options” category, you can find: Target, Output, Library Configuration, Library Options, MISRA C-2004, MISRA C-1998 (Figure 15.9).

In this blinky project, we need to set up a number of options as shown in Table 15.2.
After setting up the project options, we can now try to compile the project and test it. To start with, we right click on the project target (blinky—Debug) and select Build, and then the IDE will ask us to save the current workspace, which we will save it in the same project directory as “blinky.eww,” as shown in Figure 15.10.
If everything is setup correctly, you should see the compilation report at the IDE as shown in Figure 15.11. Congratulations! You have built you first ARM® project with IAR Embedded Workbench successfully.
Now you need to download the program to the microcontroller board and test it. This can be done in three ways: Using the pull down menu to select “Project → Download and Debug,” click on the  (Download and Debug icon) on the tool bar or use short cut key Ctrl-D.
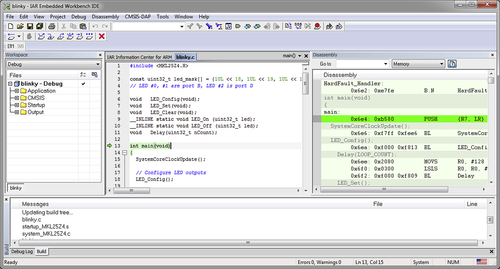
After the program image is downloaded to the board, the debugger screen should appear as shown in Figure 15.12. The program is currently halted just before the first line of C code in main(), as indicated with the green arrow.


You can start running the program by clicking on the “go” icon  on the tool bar. The LEDs on the board should start flashing. You can halt, resume, reset, or single step the program using various icons on the debugger screen, as shown in left hand side of Figure 15.13.

By default the register window is not enabled. To enable the register window, use the pull down menu to select “View → Register.”
You can insert or remove breakpoints by right clicking a line on the source window, and select toggle breakpoint. When the processor is halted, you can see the processor's registers using the register window which can be accessed by pull down menu “View → Register.”
15.4. Project Options
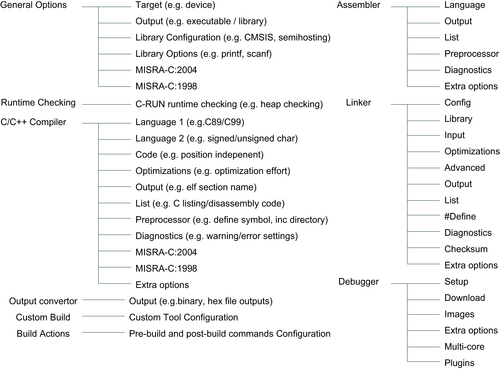
The IDE in the IAR Embedded Workbench provides many options. Figure 15.14 shows the main option categories and the tabs available.
For example, the IAR C Compiler allows various levels of optimization efforts, and when the optimization level is set to high, you can select between size optimization, speed optimization, and balance optimization. You can also enable or disable some of the individual optimization techniques (Figure 15.15).
There are also a number of additional settings for each supported debug adaptor. In some cases you need to set up the debug adaptor settings to specific debug protocol (i.e., JTAG/Serial Wire debug) and reset behaviors. Additional debug and trace options might also be needed if you are using Cortex®-M3/M4/M7 processor which has trace features.

15.5. Using MTB Instruction Trace with IAR EWARM
The MTB feature of the Cortex®-M0+ processor is supported in the IAR Embedded Workbench on the debug adaptors including: CMSIS-DAP and IAR I-Jet/I-Jet Trace. For example, if you are using the Freescale Freedom board FRDM-KL25Z, you can enable the MTB trace in the debug session from the pull down menu: CMSIS-DAP → ETM Trace, as shown in Figure 15.16.
A new window will then be displayed, and you might need to click in the On/Off icon to enable the trace, as shown in Figure 15.17.
When trace is enabled, the ETM icon on the tool bar is displayed with green background color.
After program execution started and then halted (e.g., by a breakpoint), the instruction trace will then be displayed in the trace window, as shown in Figure 15.18.


15.6. Hints and Tips
In an IAR EWARM project, the stack size and heap size requirement of a project is defined in the Linker options. You need to select the option to override the default Linker Configuration File, set up the stack and heap memory size (Figure 15.19), and save the settings in a new configuration file in your project directory.


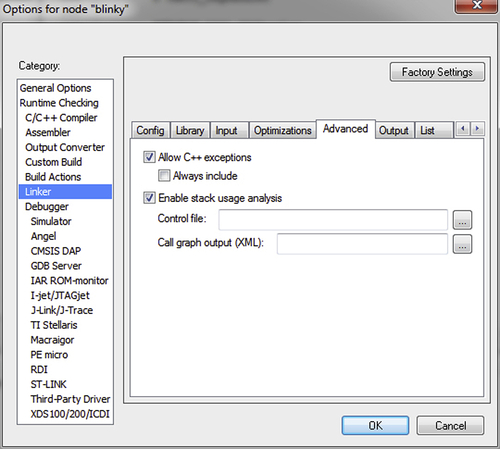
You can determine the amount of stack space you need for your application by enabling the stack analysis feature. In order to do this, you need to enable two options in the linker settings:
1. Enable linker map file generation (Figure 15.20), and
2. Enable stack analysis (Figure 15.21)

Once the options are enabled and the project is recompiled, you should see a linker map file in the DebugList directory, and you can see the stack report like the following:
Another useful feature of the IAR EWARM is C-RUN, a range of runtime check features that allows detection of potential software failures with just a small amount of software overhead. The C-RUN is an add-on product for IAR EWARM 7.20 and later versions. The C-RUN feature can be enabled from the project option, as shown in Figure 15.22.

Much of the useful information about IAR Embedded Workbench is included in the documentation which is part of the installation. Typically you can find these files from the Help menu.
On the IAR Web site, under the support->resources section, there are also a number of useful and informative technical articles. An example is “Mastering stack and heap for system reliability,” reference 10.
..................Content has been hidden....................
You can't read the all page of ebook, please click here login for view all page.