
Carbon Capture and Storage
Abstract
The vast majority of the energy in the world comes from hydrocarbons, which generate carbon dioxide when they are burned. As a consequence, the carbon dioxide levels in the atmosphere have risen dramatically, and the prevailing opinion is that increased atmospheric carbon dioxide is leading to global warming. The Kyoto accords were an international agreement designed to reduce carbon dioxide levels. These accords called for power generators to reduce carbon dioxide levels. The principal way to do this is to capture the carbon dioxide before it gets into the atmosphere and then sequester it underground. Carbon capture and sequestration technologies are reviewed here. There is no doubt that the world can generate all of its electricity without pumping any carbon dioxide into the atmosphere. This could be achieved in a 10-year time frame if the political will was there. But, if we want to seriously reduce the carbon dioxide emanating from automobiles, we have to make a major switch to electric vehicles. Even if the electricity is generated from hydrocarbon fuels, it will be done at a point source where the carbon dioxide can be captured and sequestered.
The vast majority of energy in the world comes from hydrocarbons, which generate carbon dioxide (CO2) when they are burned. As a consequence, the carbon dioxide levels in the atmosphere have risen dramatically (see Figure 4.5) and the prevailing opinion is that this is leading to global warming. The Kyoto accords are international agreements designed to reduce carbon dioxide levels. These accords call for generators to reduce carbon dioxide emissions to the atmosphere. The principal way to do this is to capture the carbon dioxide before it gets into the atmosphere, transport it to a storage site and sequester it underground. The technologies for doing this will be examined in this chapter.
There is no doubt that the world can generate all of its electricity without pumping any carbon dioxide into the atmosphere. This could even be achieved in a 10-year time frame if the political will was there. To seriously reduce the carbon dioxide emanating from automobiles, there needs to be a major switch to electric vehicles or low emission vehicles. Even if electricity is generated from hydrocarbon fuels, it needs to be done at a point source where the carbon dioxide can be captured and sequestered. While these are not cheap processes, they have to be undertaken to reduce the amount of carbon dioxide in the atmosphere.
Some people doubt that capturing and sequestering can be done in a safe and effective manner, claiming that the technology is unproven. The oil industry, however, has been injecting carbon dioxide into oil reservoirs on a large scale for 50 years. They know how to do it so that the carbon dioxide remains sequestered. As storage is ramped up, the depleted oil and gas fields are the first places to put the CO2. The next places are in known traps and deep saline aquifers. While these locations represent the largest repositories for CO2, they are also the least proven technology. Moreover, in order to create enough space in these deep formations and trapped formations, water may have to be removed and used or disposed of. The other places where CO2 can be sequestered are in deep unminable coal beds and deep in the ocean.
Carbon Emissions
In 2010, the world emitted 33.2 billion tons of carbon dioxide into the atmosphere. Of this, 25% was emitted by China and 18.5% was emitted by the United States. These two countries are the largest CO2 emitters by far, accounting for 43.5% of the world’s CO2 generation. China overtook the United States as the top CO2 emitter in 2006. Table 14.1 shows the top 15 CO2 emitting countries in the world.
Table 14.1
CO2 Emissions in 2010 (Mt/yr)
| 1 | China | 8332.5 |
| 2 | United States | 6144.9 |
| 3 | India | 1707.5 |
| 4 | Russia | 1700.2 |
| 5 | Japan | 1308.4 |
| 6 | Germany | 828.2 |
| 7 | South Korea | 715.8 |
| 8 | Canada | 605.1 |
| 9 | Saudi Arabia | 562.5 |
| 10 | Iran | 557.7 |
| 11 | United Kingdom | 547.9 |
| 12 | Brazil | 464.0 |
| 13 | Mexico | 447.0 |
| 14 | Italy | 439.4 |
| 15 | South Africa | 437.2 |
The vast majority of these emissions come from burning oil, coal and natural gas (see Figure 4.6). Not all of these emissions end up in the atmosphere, however, and contribute to the 400 ppm of CO2 content already in existence. The carbon cycle is a complicated process. Some of the carbon dioxide emitted into the atmosphere is: utilized by plants to grow cell walls in the photosynthesis process; dissolved in the ocean water; removed from the atmosphere by the world’s food crops (although the human beings and other animals that eat those crops breathe out more carbon dioxide than is removed by crops); and, removed by the new growth forests. Nevertheless, the rising CO2 levels in the atmosphere are likely to be due to the rising CO2 emissions over the past 150 years.
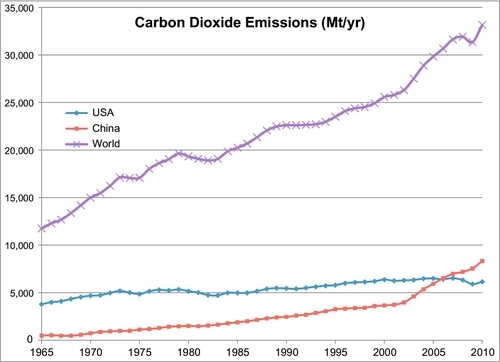
Though the world has been trying to find ways to reduce these emissions, Figure 14.1 shows that CO2 emissions in the world continue to increase. The United States and Europe have begun to reduce their emissions, but China and other developing countries continue to increase their emissions, spurred by their rapid development. The reader may be confused by an apparent discrepancy in the numbers shown in Figure 14.1 compared to those shown in Figure 4.6. Careful comparison of the two figures reveals that Figure 4.6 shows the emissions of carbon (in million tons per year), whereas Figure 14.1 shows the emissions of carbon dioxide (in million tons per year). Each ton of carbon dioxide contains 0.273 tons of carbon.
While carbon dioxide is not the only greenhouse gas emitted by the industrial world, it is by far the most important. Even though methane, nitrous oxide and chlorofluorocarbons have a stronger greenhouse effect, much smaller volumes of these are emitted each year. Nevertheless, there are programs to reduce these emissions as well.
Phase Behavior of Carbon Dioxide
It is useful to understand a little about the phase behavior of CO2 because it is not only interesting; it is also relevant to how it is handled for transport and storage. The phase diagram for any pure substance will show the pressures and temperatures where the substance is solid, liquid or gas. There is also a fourth physical state above the critical temperature and critical pressure where the substance is called “supercritical,” which is also relevant to its handling.
Figure 14.2 shows the CO2 phase diagram. Two important points are shown on that diagram: the critical point and the triple point. At the critical point, gas and liquid CO2 have the same properties (density, viscosity, etc.). It is impossible to distinguish between the liquid and gas phases at this point. At the triple point, the solid, liquid and gas phases are all in equilibrium with one another. Below the triple point, the liquid phase does not exist. It is in this region that the solid CO2 ice sublimates into a gas phase when it is heated. The triple point of CO2 occurs at a pressure of 5.11 atmospheres (76.4 pounds-force per square inch absolute or 76.4 psia) and a temperature of − 56.4°C (− 69.6°F). At sea level, the atmospheric pressure is one atmosphere (14.7 psia). This means that CO2 cannot be a liquid at atmospheric pressure. It must either be a very cold solid (known as dry ice) or a gas, which mixes with the atmosphere. Solid CO2, or dry ice, is widely used to keep things cold because it has those two properties that make it very useful: it is very cold (less than − 70°F) and, when it is heated, it does not melt to form a liquid, but rather sublimates into the atmosphere. By contrast, the triple point of water occurs at 0.006 atm (0.09 psia); consequently, at atmospheric pressure, ice melts into liquid water when it is heated.
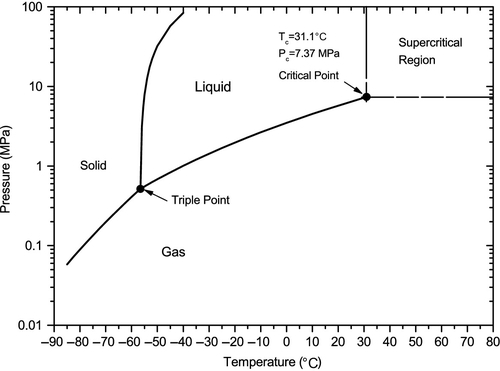
The critical point for CO2 is 31.1°C (88°F) and 7.37 MPa (1,073 psia). A system pressure of more than 7.37 MPa (which is about 73 atmospheres) and a system temperature of more than 31.1°C will result in a supercritical condition. In the supercritical region, the properties of the substance are somewhere between a liquid and a compressed gas. More importantly, the CO2 does not undergo a phase change when the temperature and pressure change. If the temperature is decreased, the CO2 smoothly transforms into a liquid. If the pressure is decreased, the CO2 smoothly transforms into a gas. Both of these changes occur without undergoing any sudden or rapid phase change.
Between the critical point and the triple point, the CO2 exists in either a liquid or gaseous state, depending on the temperature and pressure. When in the liquid state, if the temperature is increased or the pressure is decreased, the liquid will reach the boiling point line and be transformed into a gas through the boiling process. Conversely, from the gaseous state, if the temperature is decreased or the pressure is increased, the gas will reach the same line and be transformed into a liquid through the condensation process.
Technically speaking, CO2 can be transported through pipelines in the form of a gas, a supercritical fluid or in the sub-cooled liquid state. Gas phase transport is disadvantageous because of the lower density and consequently larger pipe diameter required. It is not used for pipelines of any significant capacity and length. Furthermore, in storage, the CO2 must be injected into deep wells at its destination. It must also be supplied at the appropriate pressure, which is usually around 3,000 psia (204 atmospheres) or more. To be transported in a pipeline, CO2 should be compressed to ensure that single phase flow is achieved for the entire length of the pipeline. A transmission pipeline can experience a wide range of ambient temperatures, so maintaining stability of this single phase is important in order to avoid considerations of two-phase flow that could result in pressure surges which damage the pipeline.
Most CO2 pipelines are operated in the liquid region (high pressures and low temperatures). In very hot climates, however, the liquid flowing in the pipeline can be heated above the critical temperature (31.1°C). The liquid thus becomes a supercritical fluid, which oddly enough is easier to handle. Most CO2 pipelines are buried in the earth a few feet, which keeps the operating temperature below the critical temperature. In that case, care must be taken to ensure the pressure in the pipeline remains higher than the boiling point pressure so that a phase change from liquid to gas does not occur. If this happens, it results in pressure surges that can possibly damage the pipeline. On the other hand, once the CO2 is injected into the reservoirs under the ground, the earth temperature is usually above the critical temperature (31.1°C (88°F,)) and the CO2 becomes a supercritical fluid.
In Figure 14.3 in the storage concepts section, some people have proposed that CO2 be sequestered at the bottom of the deep ocean where the temperatures can be very cold (35°F to 40°F) and the pressures are very high [4,450 psia (303 atm)] at a depth of 10,000 feet. At these conditions, CO2 is a liquid, slightly less dense than seawater; however, CO2 is soluble in seawater. When sequestered on the ocean floor in this manner, it will gradually dissolve in the ocean rather than rise to the surface. Another method of sequestering CO2 in the ocean would be to convert it to dry ice. The density of dry ice is heavier than seawater so it could be dumped into the deepest part of the ocean. It would then sink to the ocean floor where the pressure would be above the triple point pressure. The ocean would then transfer heat to the dry ice, melting it into a liquid form which would then begin rising and dissolving in the ocean water. There are certain disadvantages to this method of storage which will be explained later.
Carbon Capture Methods
Most of the CO2 that is emitted into the atmosphere comes from burning hydrocarbons in air. Air contains about 80% nitrogen and about 20% oxygen, with many other components of much smaller values. The CO2 component in the air is currently about 400 ppm, or 0.04%. The flue gas from a coal-burning power plant, however, contains 10-12% CO2. This can be captured by various methods. The most widely used commercial technology for doing this is to absorb it in Mono-Ethanolamine (MEA) using a contacting column. This process is illustrated in Figure 4.7. After absorbing the CO2 from the flue gas, the MEA is pumped to a stripping column where it is heated and the CO2 exits at the top of the column as a mostly pure CO2 stream that is ready for sale or storage. Using this technology, CO2 can be stripped out of flue gas from a power plant for about $50 per ton of CO2 recovered. It costs another $25 per ton to compress the CO2 and sequester it underground. This increases the cost of coal-fired or gas-fired electricity by about 30%.
Another method of capturing CO2 is to use solid absorbents, instead of MEA, in the process described above. There are many substances that will absorb and capture CO2, ranging from activated carbon to poly-ionic liquids. This is the focus of intensive research programs around the world.
A final method of capturing the CO2 is oxy-combustion, which is illustrated in Figures 13.13 and 13.15. In this process, hydrocarbons are burned in an oxygen environment with recycled CO2 (instead of nitrogen) as the carrier gas. This results in a flue gas that is mostly pure CO2, ready for storage.
Carbon Storage Concepts
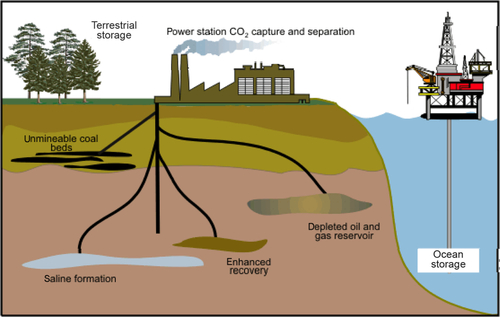
Figure 14.3 shows the concept of how carbon dioxide is sequestered in the earth or in the ocean. The CO2 is pumped into depleted oil or gas reservoirs, deep saline formations, coal beds or into the ocean itself.
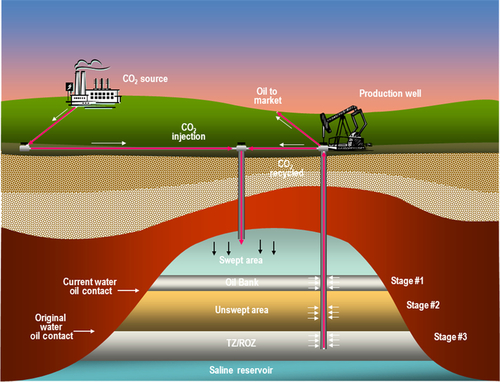
CO2 is currently used to increase the recovery of oil from oil reservoirs, a process illustrated in Figure 14.4. The CO2 is used to sweep oil towards the producing wells, mobilizing oil that would otherwise remain in the reservoir, held in place by capillary forces. At the end of the life of the Enhanced Oil Recovery (EOR) project, the CO2 remains sequestered in the reservoir. CO2 is more soluble in oil than it is in water. When it is pumped into the oil reservoir, it dissolves in the oil. If the pressure is high enough, it becomes miscible with the oil. This swells up the volume of the oil and makes it more mobile and able to be swept out of the corners of the porous rock and flow towards the producing well.
Though there are many depleted oil and gas fields, there is not enough space in such reservoirs to sequester all the CO2 that will need to be sequestered. Consequently, coal beds and saline aquifers will also have to be used. Coal beds use a different physical principle to sequester the CO2. Coal has a chemical attraction for CO2 and, when it is injected into the coal bed, it adsorbs onto the surface of the coal (releasing methane in the process). It therefore does not require much additional space in which to store the CO2. Large volumes of CO2 can be stored in coal beds, but it must be unminable coal to ensure that the CO2 remains sequestered. Chapter 13 discussed the large mass of coal reserves in the world; however, there is much more coal in the earth that is too deep to be mined. This coal can also store a large quantity of CO2.
When sequestered underground, most of the formations capable of holding CO2 are deep enough that the formation temperature is greater than the critical temperature of CO2 (31.1°C). The pressure in the formation is also likely to be greater than the critical pressure (73 atm). This means that most of the CO2 is sequestered in a dense-phase supercritical state. There are some shallow formations where the temperature would be cooler than the critical temperature. In such formations, however, it is unlikely that the pressure could be maintained high enough to keep the CO2 in a liquid state. Consequently, porous shallow formations are not suitable for storage.
The largest spaces available for carbon storage are in deep saline aquifers. When CO2 is injected into these formations, there are a number of different mechanisms that contribute to the storage process. Two of the principal mechanisms are the dissolution of CO2 in the water and the chemical reaction between the CO2 and the rock minerals and mineral salts present in the water.
When CO2 reacts with the mineral salts in the formation, it produces carbonate minerals that frequently precipitate into the formation, trapping the CO2 in-situ. This can be a relatively slow process, but once completed, it keeps the CO2 trapped and immobile in the formation. If the CO2 is not mineralized in this manner, some of the CO2 will dissolve in the water and the rest will remain as a supercritical CO2 phase that displaces some of the formation water. In this case, it can be beneficial to produce some of the formation water to the surface to create room for the supercritical CO2 phase in the formation. The produced water can be: desalinated at the surface and used; disposed of in the ocean; or re-injected back into the same aquifer trapping the CO2 by capillary action. As long as the supercritical CO2 saturation is kept low (less than about 25%), the CO2 remains immobile and trapped and cannot migrate or leak out of the containing formation. Over time, the CO2 saturation gradually dissolves and mineralizes in the aquifer water.
On the bottom of the deep oceans, high enough pressures and low enough temperatures exist that would be sufficient to maintain the CO2 in a liquid state. Liquid CO2, however, is lighter than seawater. It would rise and become dissolved in the ocean water. The problem with this method of storage is that the CO2 is more soluble in cold water. As the ocean currents carry the CO2-laden water to warmer regions, the CO2 could be released back into the atmosphere. Solid CO2 (dry ice) is heavier than seawater. If it was dropped into the ocean, it would sink to the bottom. It would then rapidly dissolve in the ocean water and suffer the same fate.
Another problem with ocean storage is that increasing the CO2 levels in the ocean will make the ocean more acidic. When CO2 dissolves in water, it makes carbonic acid which lowers the pH of the ocean water. This will adversely affect the corals and many of the marine species, killing them off. For these reasons, ocean storage of CO2 is not a viable option on a large scale or on a long-term basis.
Carbon Storage Projects
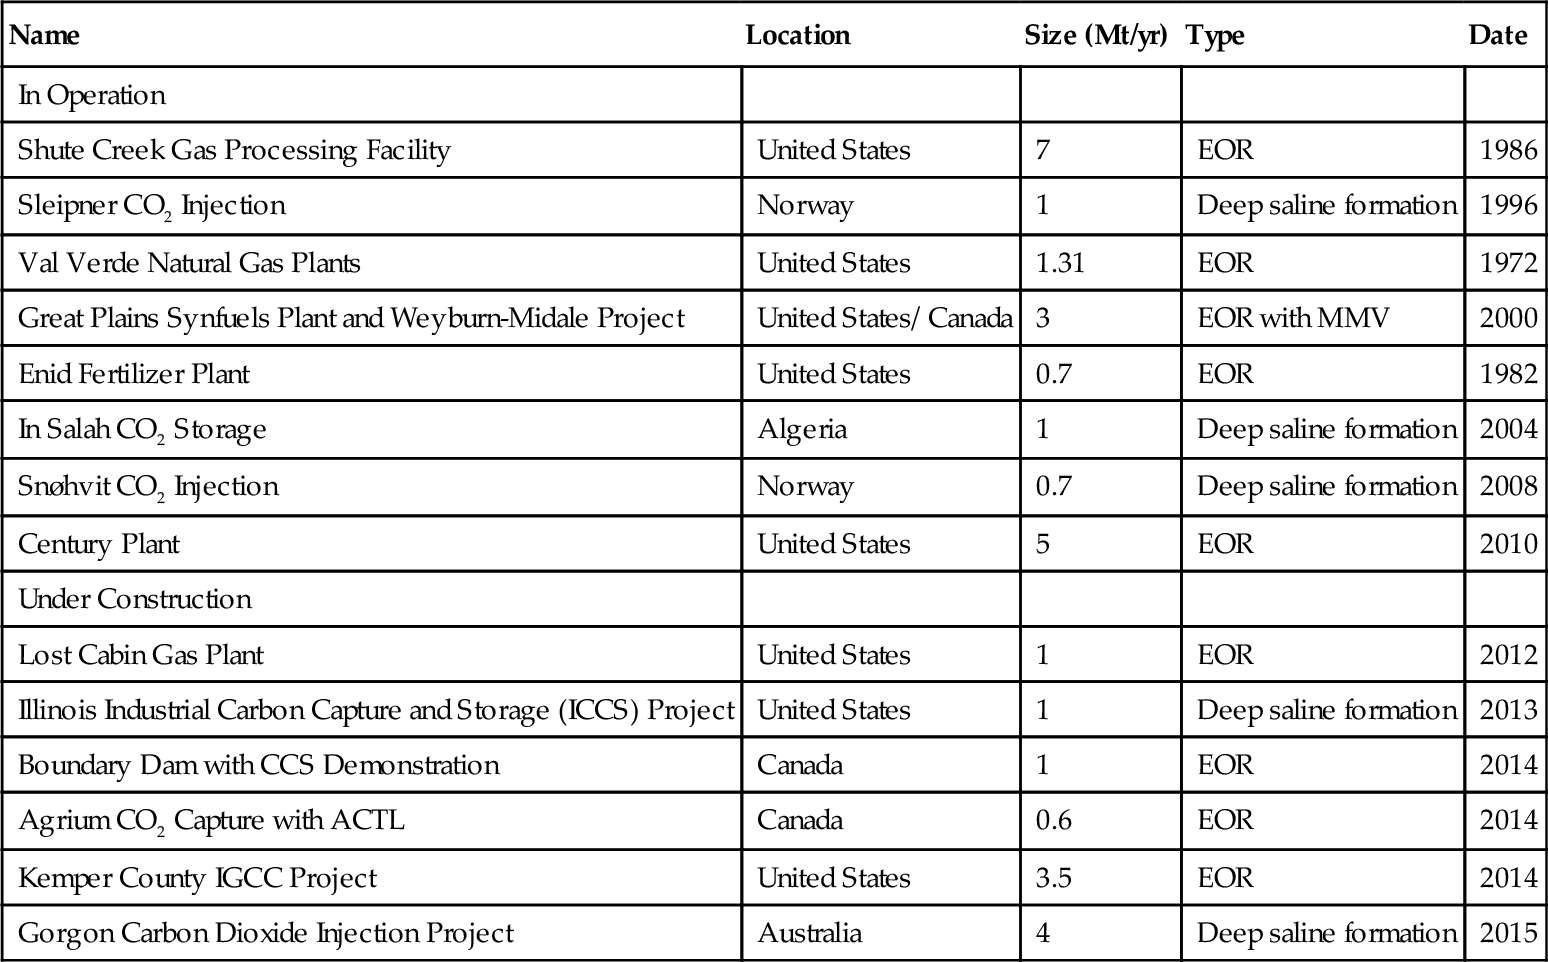
The Global CCS Institute, based in Australia’s capital city of Canberra, has identified 74 large-scale integrated CCS projects around the world. In their annual survey, undertaken in May–August 2011, they published a detailed assessment of project status, including an analysis of project dynamics, challenges and opportunities. They define large-scale and integrated projects as those that involve the capture, transport and storage of CO2 at a scale of more than 800,000 tons of CO2 annually for a coal-based power plant and more than 400,000 tons of CO2 annually for other emission-intensive industrial facilities (including natural gas–based power generation). There are many more projects around the world which are of a smaller scale or only focus on part of the CCS chain. Twenty-five of these projects are located in the United States and 21 are located in Europe. Of these 74 projects, 8 are currently in operation and another 6 are currently being constructed. These 14 projects are shown in Table 14.2. Eight of the projects are located in the United States.
Table 14.2
Current Large Scale CCS Projects
| Name | Location | Size (Mt/yr) | Type | Date |
| In Operation | ||||
| Shute Creek Gas Processing Facility | United States | 7 | EOR | 1986 |
| Sleipner CO2 Injection | Norway | 1 | Deep saline formation | 1996 |
| Val Verde Natural Gas Plants | United States | 1.31 | EOR | 1972 |
| Great Plains Synfuels Plant and Weyburn-Midale Project | United States/ Canada | 3 | EOR with MMV | 2000 |
| Enid Fertilizer Plant | United States | 0.7 | EOR | 1982 |
| In Salah CO2 Storage | Algeria | 1 | Deep saline formation | 2004 |
| Snøhvit CO2 Injection | Norway | 0.7 | Deep saline formation | 2008 |
| Century Plant | United States | 5 | EOR | 2010 |
| Under Construction | ||||
| Lost Cabin Gas Plant | United States | 1 | EOR | 2012 |
| Illinois Industrial Carbon Capture and Storage (ICCS) Project | United States | 1 | Deep saline formation | 2013 |
| Boundary Dam with CCS Demonstration | Canada | 1 | EOR | 2014 |
| Agrium CO2 Capture with ACTL | Canada | 0.6 | EOR | 2014 |
| Kemper County IGCC Project | United States | 3.5 | EOR | 2014 |
| Gorgon Carbon Dioxide Injection Project | Australia | 4 | Deep saline formation | 2015 |
The Future of Carbon Capture and Storage
Currently, the world is emitting more than 33 billion tons of CO2 annually. If this were to be sequestered in deep saline aquifers at an average pressure of 3,500 psia and an average temperature of 180°F, the average specific gravity of the supercritical fluid would be 0.65. This correlates to a density of 650 kg/m3, or 40.5 lb/ft3. At this density, the 33 billion tons of CO2 per year would have a volumetric rate of injection into the formation of 875 million barrels of supercritical CO2 per day. This is 10 times the volume of oil that is being produced per day in the world. At the surface conditions of 2,600 psia and 75°F, the specific gravity of the liquid phase would be 0.9, giving a density of 56 lb/ft3. At these conditions, the total volume of fluid being injected in liquid form at the surface would be 632 million barrels of liquid CO2 per day. Consequently, the CO2 storage business could be larger than today’s oil business. Even if only 10% of the CO2 produced is sequestered underground, it is still a very large business that today is a relatively small business. If the world chooses to invest more time and energy into carbon capturing and storage, the business potential could be huge.
The Kyoto Accords failed to make much headway in reducing the CO2 emissions. Any such future agreements would have to begin with a bilateral agreement between United States and China, the two largest CO2 emitters. Europe, Russia and India would also have to be eventual signatories to the agreement. With this critical mass, most of the other countries in the world would likely follow suit.