
Environmental Issues
Abstract
Whenever we capture energy for use, there are usually impacts on the environment. Hydrocarbon sources generate air pollution, particularly in the form of carbon dioxide, which is the most important of the greenhouse gases and a cause of public concern as it relates to global warming. Nuclear energy generates radioactive waste that has been the subject of intense public debate as well, but this energy source has begun to come back into favor due to the fact that it does not generate carbon dioxide. Consequently, many people are strongly in favor of renewable energy sources, but even these are not without impact. Large wind generation devices create noise and visual pollution, and there is even a perception (undeserved) that wind towers kill a lot of birds. Hydroelectric power is clean and cheap, but some people object to this form of energy because it requires dams that interrupt the migration paths of fish. Solar energy uses large tracts of land and can have a large impact on the flora and fauna wherever it is deployed. The truth is that you cannot extract energy from the environment without having an impact on the environment. We just have to work out ways to minimize that impact.
Whenever energy is captured for use, there are always impacts on the environment. Hydrocarbon sources generate not only air pollution but carbon dioxide, one of the greenhouse gases that are most likely to lead to global warming. Nuclear energy generates radioactive waste. While that has been the subject of intense public debate, this type of energy was slowly coming back into favor due to the fact that it does not generate carbon dioxide. Many people are strongly in favor of renewable energy sources because they are perceived as being clean and as having less undesirable effects; however, they too have an impact on the environment. Large wind generation devices create noise and visual pollution, and there is even a perception (undeserved) that they kill a lot of birds. The noise, both audible and infrasound, has impact on the health of the people that live and work near the devices. Hydroelectric power is surprisingly clean and cheap, but some people object to this form of energy because it requires dams that alter the ecology of river basins and interrupt the migration paths of fish. The truth is, as discussed in Chapter 1, you cannot extract energy from the environment without having an impact on the environment. The reason for this is that energy is the essence of the fabric of the universe. As we manipulate the flow of energy, an impact is left behind. The goal should be to work on ways to minimize that impact. So what are the impacts and how do we go about mitigating their environmental influence?
The Carbon Dioxide Issue
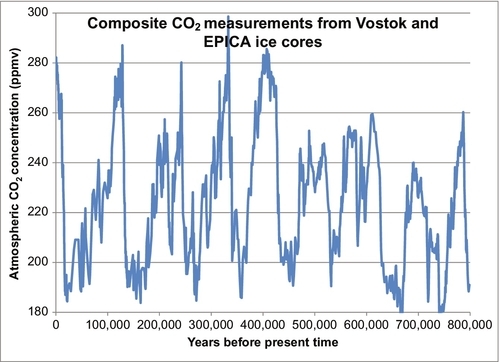
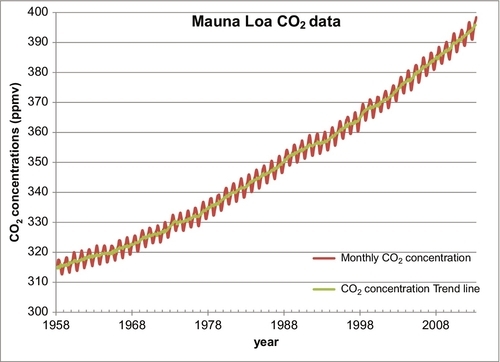
In the last 200 years, carbon dioxide (CO2) levels in the Earth’s atmosphere have risen from about 280 parts per million (ppm) to about 400 ppm. Figure 4.1 shows the CO2 levels (in ppm by volume) for the past 800,000 years. Ice ages occurred about every 100,000 years. Each time the Earth got cold, the CO2 level dropped to below 200 ppm, and when the Earth warmed up the CO2 level built back up to near 300 ppm. Two hundred years ago, the CO2 level was near 280 ppm. Fifty-five years ago in 1958 when accurate measurements commenced on the Mauna Loa Weather Station in Hawaii, the level had risen to 318 ppm (see Figure 4.2), a small but significant rise. By 2010, the CO2 value had risen to 390 ppm. This rise in the CO2 level occurred very rapidly (compared to changes in geological time). During that time period, large amounts of hydrocarbon-based fuels that emitted large amounts of CO2 into the atmosphere had been burned, and there is a strong presumption that the two situations are cause and effect, or at least strongly linked. There is also a theory that this rise in CO2 levels is causing or will lead to global warming, a general rise in the Earth’s temperature and a disruption of the weather patterns around the Earth. Because of the general acceptance of these theories and facts, people are demanding that CO2 emissions be restricted and that alternative energy sources be adopted.
While it is easy to conclude that CO2 has a negative impact on the Earth and its use should be restricted, not all scientists agree with these conclusions, and it is necessary to examine both sides of the issues. It does seem like a logical conclusion (a no-brainer, if you will) that the rising CO2 levels in the atmosphere have been caused by the vast amounts of hydrocarbons that mankind has been burning in the past 200 years. When hydrocarbons are burned, CO2 is emitted; however, it is not as simple as that. The Earth’s carbon cycle is actually very complicated. Carbon dioxide is not only generated by burning hydrocarbons, but also by transpiration by the animal life on the planet. We breathe in oxygen and breathe out carbon dioxide. It is also generated by the decay of animal and vegetable matter when they die. Carbon dioxide is also consumed by plant matter as they grow. The CO2 in the atmosphere is photosynthesized by plant life during growth, and this removes CO2 from the atmosphere. In fact, it has been shown that new-growth forests and crop growth remove significant quantities of CO2 from the atmosphere each year. On the other hand, old-growth forests can be carbon neutral because the CO2 that is being absorbed by the tree growth is balanced by the decay of the trees that die each year.
The oceans also contain vast stores of CO2 dissolved in its waters. The amount of CO2 dissolved in the ocean is inversely proportional to its temperature. As the water temperature rises, the oceans release CO2 into the atmosphere; as the water temperature decreases, it absorbs CO2 from the atmosphere.
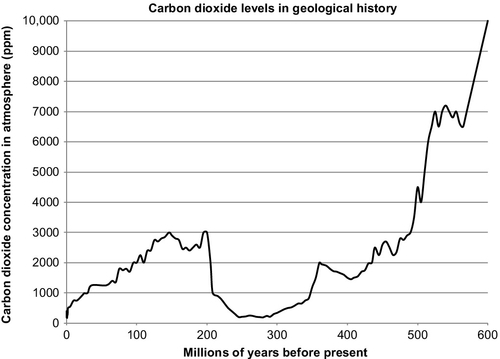
Keeping track of all these effects can be very complicated. Those that argue against a hydrocarbon source for the rising CO2 levels believe that the oceans are a much larger cause of this increase. They argue that the Earth’s temperature is dependent on the amount of heat insolation that is radiated to the Earth by the Sun. As the solar activity rises and falls (solar activity does follow cycles), the Earth’s average temperature rises and falls. As the temperature rises, the CO2 level in the atmosphere rises because of the CO2 that is being released by the sun-warmed oceans. They point to the fact that throughout the geological past, the CO2 levels have been much higher than they are now. In the Cambrian period, 500 million years ago, the CO2 levels in the atmosphere were more than 7000 ppm. Prior to that, it has been reported that the CO2 levels could have been even higher. They were only reduced by the rapid plant growth of the Carboniferous period 300 million years ago. This was also a time when the Earth was significantly warmer than it is now. During the Jurassic period, the CO2 levels rose to more than 6000 ppm. As recently as the Cretaceous period 65 million years ago, the golden age of the dinosaurs, the CO2 levels were over 2000 ppm. The cause of these high CO2 levels was clearly not the burning of fossil fuels; one of the causes was CO2 emitted by volcanoes, but it was also affected by changing solar insolation which caused the Earth’s temperature to rise, which caused the CO2 levels to rise. Higher temperatures and higher CO2 levels led to increased growth of plant life on Earth during the Carboniferous period. Plants thrive in such an environment. This is illustrated in Figure 4.3, which shows the estimates of CO2 levels for the past 550 million years.
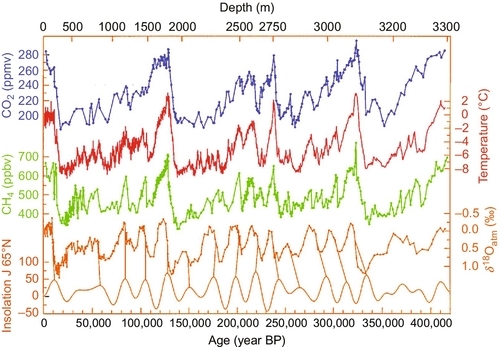
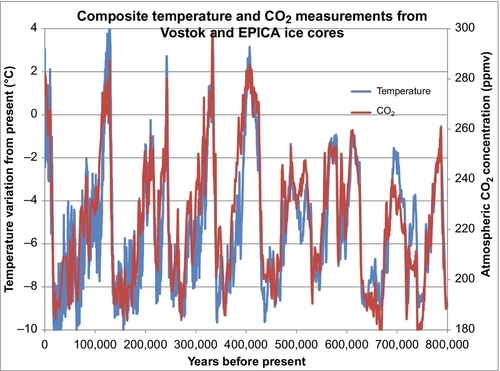
In the movie, An Inconvenient Truth, former Vice President Al Gore makes the argument that throughout geological history every time the CO2 levels increased, so did the temperatures. What he did not explain, or did not understand, was that in almost every case the temperatures rose before the CO2 levels rose, begging the question as what is cause and what is effect. Recent geological history certainly supports the argument that a rise in global temperatures leads to a rise in CO2 levels, rather than the other way around. Figure 4.4 illustrates this point. It shows a similar plot as that used by Gore. The average global temperature increases before the CO2 level increases and the global temperature also decreases before the CO2 level decreases.
Militating against this argument and in favor of a hydrocarbon source for the rising CO2 levels is the isotopic analysis of the atmospheric CO2. This shows that most of the additional CO2 in the atmosphere came from hydrocarbon sources. Whether this is leading to or will lead to global warming is a separate issue. The argument is that CO2 is a greenhouse gas and that its presence in the atmosphere has led to rising temperatures. The evidence for this is less convincing because there are many factors that have a direct impact on the global temperatures. The Earth’s temperature rises and falls in cycles all the time. Five hundred years ago the Earth endured a mini-ice age, when much of the Northern Hemisphere endured bitterly cold winters that had not previously existed. Since then there has been a gradual warming that is continuing and was probably not caused by CO2 levels. During this warming period, there have been cycles of warming and cooling. In 30 of the past 40 years, there was a period of rising global temperatures that have been blamed on the CO2 levels; however, in the past 15 years the global temperatures have stopped rising and have commenced to decrease again, suggesting that global warming has not yet taken hold or other factors are more important. Comparing Figures 4.1 and 4.2 you can see that there is no doubt the current CO2 levels are now higher than they have been for the past 800,000 years and indeed one has to go back about 3 million years before we find atmospheric CO2 levels this high.
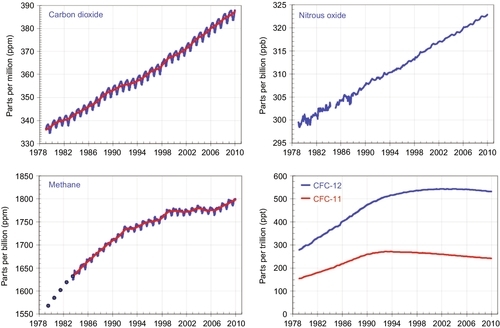
It is generally accepted that CO2 is a greenhouse gas, which means that CO2 helps trap heat from the Sun and keep it from being reradiated from the Earth back into the surrounding universe. It is not the strongest greenhouse gas; methane, nitrous oxide, chlorofluorocarbons (CFCs), and water vapor have more intense greenhouse effects. Figure 4.5 shows how during the last 33 years not only have CO2 levels been continually rising but so have methane (CH4), nitrous oxide (N2O), and CFCs. All of these are greenhouse gases. CFCs had been widely used as a propellant in aerosol spray cans and as a refrigerant for many years. Because it has both a greenhouse effect and depletes the ozone layer, it was banned from use in 1990. The graph shows its levels have stabilized and are now decreasing. CH4 and N2O have a much stronger greenhouse effect than CO2; however, because the CO2 concentration is much higher than methane and nitrous oxide, it is having or going to have the largest greenhouse effect. As the CO2 level increases, its greenhouse effect will also increase.
There is also a concern that there is an unstable feedback loop in the global warming effect that could lead to runaway global temperatures. The reasoning is that, as the CO2 levels rise, the Earth starts warming up due to the greenhouse effect. As the seas warm, more CO2 and water vapor will be released from the oceans. This increases the CO2 and water vapor concentrations in the atmosphere that will lead to more global warming. Even if this were true, the CO2 coming from the oceans would eventually deplete, leading to a plateau in the CO2 concentration. By that time, all of the ice in Greenland and Antarctica would have melted and the ocean levels would have risen by about 50-100 feet. This is speculation, however, and scientists do not fully understand this process yet.
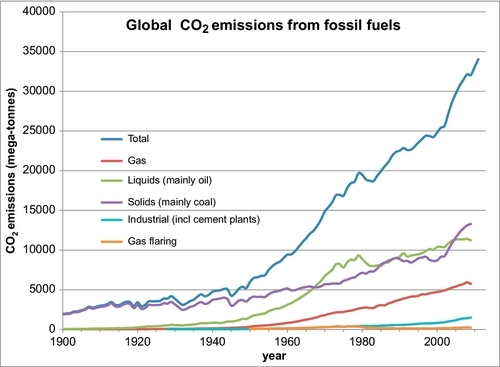
Figure 4.6 shows an estimate of the global carbon emissions for the past 100 years. The majority of the carbon emissions have come from coal, but in the past 50 years oil had become both the primary energy source and the primary CO2 source. But since 2005 the emissions from coal have again moved above those from oil, even though they are both about equal. The CO2 emissions from coal can be reduced more easily than the emissions from oil. This will be discussed more fully in the next two sections of this chapter.
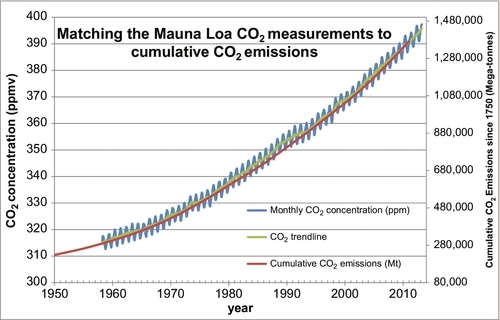
The preponderance of the evidence supports the theory that the rising CO2 levels in the atmosphere is being caused by the burning of fossil fuels, oil, coal, and natural gas. The principal data used to support this postulate has been an examination of the 13C isotope in the carbon molecules of coral growth. This evidence shows that the level of the 13C isotope in the coral has been decreasing over the past 100 years. Coal in particular has lower levels of the 13C isotope in its carbon molecules, leading one to conclude that the burning of coal is one of the causes of the rise in the CO2 levels. However, I have developed some more direct evidence linking the burning of fossil fuels to the atmospheric CO2 issue. I have taken the carbon dioxide emissions data of Boden, Marland, and Andres, shown plotted in Figure 4.6, and calculated the cumulative carbon dioxide emitted globally since 1750 and plotted it on the same plot as the Mauna Loa CO2 measurements, shown plotted in Figure 4.2. This combined plot is shown in Figure 4.7. The two plots line up very closely. This is very strong evidence that the carbon emissions from the fossil fuels is the main cause the for the rising CO2 levels in the atmosphere.
There is less evidence that this has caused global warming. Global warming is the concept that the rising CO2 level in the atmosphere is causing the current average temperature around the Earth to rise. This is based on rather complicated research done by Arrhenius and others in the nineteenth century which showed that CO2 is a greenhouse gas. Therefore higher levels in the atmosphere will cause warming. If we take the CO2 data shown in Figure 4.1 and plot it with the temperatures from the same period, we see a very close correlation. This is illustrated in Figure 4.8. Every time the temperature goes up, the CO2 levels rise in concert with it, and vice versa. Over the past 800,000 years these two parameters have been very strongly linked however the question remains as to which is cause and which is effect. We certainly have not been burning fossil fuels over that period. We have only been doing that in appreciable amounts for the past 100 years. If the data in Figure 4.8 is examined very closely, it can be seen that the temperature rises or falls first and the CO2 levels follow the temperatures up and down. So it is the global temperature which is the primary cause of the change in the CO2 level. The reason for this is: as the global temperature rises, CO2 dissolved in the ocean is vaporized from the ocean and increases the CO2 level in the atmosphere. The reverse happens when the Earth cools: CO2 from the atmosphere is dissolved in the ocean, decreasing the level in the atmosphere. These effects have caused the CO2 levels over the past 800,000 years to cycle between 180 and 280 ppm. Since the end of the last ice age (10,000 years ago) the CO2 level has remained relatively constant between 260 and 280 ppm as shown in Figure 4.9.
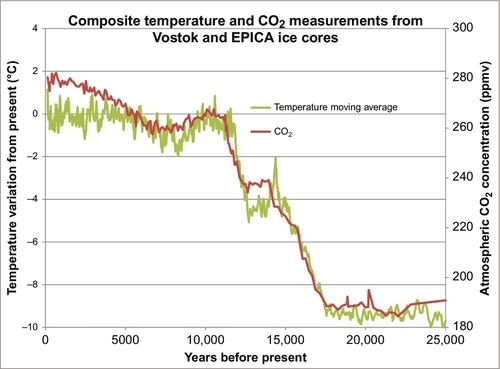
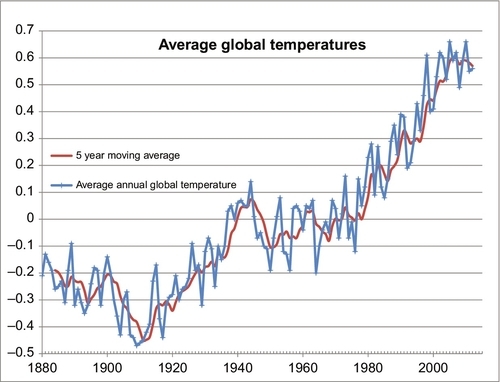
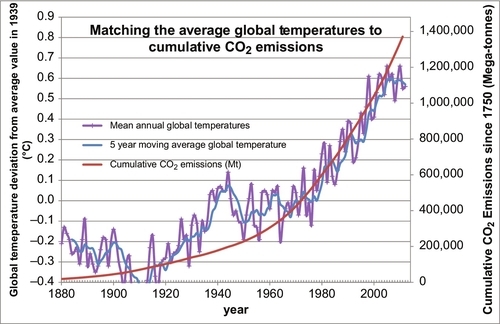
It can also be seen in Figure 4.9 that the global temperature varies more widely than the CO2 levels, but on average the CO2 levels tracked the temperatures as they moved upward. Compared to the last 1 million years we are currently living in a relatively warm period. However, compared to the last 500 million years we are currently living in a relatively cold period. Over the past 500 million years most of the time there were no polar ice caps and the sea levels were much higher than they are today. With those caveats in mind, Figure 4.10 shows the average global temperatures over the past 132 years using the temperature dataset measured and compiled by the NASA-Goddard Institute for Space Studies (GISS). Clearly the temperatures have been moving upward during that time, but is that rise being caused by the rising atmospheric CO2 levels, or vice versa? We only have reliable CO2 data from 1958 until the present. But Figure 4.7 demonstrates that there is a strong relationship between cumulative CO2 emissions and atmospheric CO2 concentrations. We have a reasonably reliable estimate of cumulative CO2 emissions since 1750 because we have kept track of how much fossil fuel was burned during that time. So the question now is, “Is there a strong and predictable relationship between cumulative CO2 emissions and average global temperatures?” This is answered in Figure 4.11 where the two datasets are overlain as before. While there is a weak correlation between the two, there are clearly other factors involved. From 1880 to 1910 the global temperature was decreasing. From 1910 to 1945 the temperatures rose more rapidly than could be predicted by cumulative CO2 emissions. Then, from 1945 to 1965 the temperatures actually fell, the Earth got colder, while the cumulative CO2 emissions continued to rise rapidly. From 1965 to 1997 the average global temperatures rose in a similar manner to the cumulative CO2 emissions, if we ignore the local temporal oscillations. But since 1997 the global temperatures have been relatively constant while the cumulative CO2 emissions have continued to rise rapidly. So the relationship between the average global temperatures and cumulative CO2 emissions is relatively weak. Discussion of the other factors that influence global temperatures is beyond the scope of this book, but solar activity and the resulting insolation are a major factor, as well as are particulates and sulfur dioxide emissions. But there are many other very influential factors, as well.
It is likely, however, that global warming will continue to be an issue in the future if the rising CO2, CH4, and N2O concentrations in the atmosphere are not abated. The solution to this problem is not to stop using fossil fuels, but to stop putting the CO2 and other greenhouse gases into the atmosphere. Instead, these gases should be captured at point sources and sequestered.
Coal
When coal is burned, it emits carbon dioxide, various oxides of sulfur dioxide (collectively known as SOx), various oxides of nitrogen (collectively known as NOx), as well as fine particulates of coal, ash, mercury, cadmium, and various other toxins. Because of these by-products, the emission limits for coal burning have been restricted for many years. This has forced the coal-powered industry to use capture technologies to prevent the SOx, NOx, ash, mercury, and cadmium from being released into the atmosphere. Once they are captured, they can be sold or sequestered in some manner. Prior to deploying these capture technologies, coal had a reputation as a dirty fuel. It was not only responsible for soot and ash raining on the countryside, but also for the acid rain that damaged rivers, soil, buildings and statues. Today most coal-powered plants are relatively clean and have little impact on the environment, except for the CO2 emissions. At the moment, no limits on CO2 emissions have been set; however, it is likely that limits will be eventually put in place at some time in the future.
Coal produces twice as much CO2 when burned as does natural gas for the same amount of energy generated. This is because coal has a much lower hydrogen to carbon (H:C) ratio than does methane (CH4). In methane, the H:C ratio is 4:1. For coal, the H:C ratio is less than 1:1.
There are various ways to capture CO2 from the flue gas of a power plant. Figure 4.12 shows a process diagram for the most common method in use today. In this process, the CO2 laden gas (often termed sour gas) is input to a contactor column, where it is contacted with an absorber, which strips the CO2 out of the gas. The sweetened gas then exits the top of the contactor column. The most common absorbing material used is monoethanolamine (MEA), although there are many different materials used and the process has many variations. The CO2 laden MEA is then directed to a stripping column, where the MEA is heated and the CO2 is driven off at the top of the stripping column. The regenerated MEA is then pumped across to the top of the contacting column ready for the next cycle. Using this technology, CO2 can be stripped out of flue gas from a power plant for about $50 per ton of CO2 recovered. It costs another $25 per ton to compress the CO2 and sequester it underground. This increases the cost of coal-fired or gas-fired electricity by about 30%. Some data on the cost of CO2 capture was published in 1999 by Professor Herzog from MIT. The table of data from his paper is reproduced here as Table 4.1.
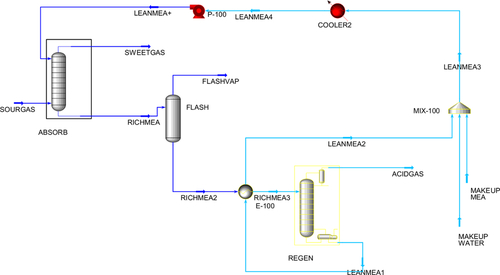
Table 4.1
Cost of CO2 Capture and Separation
| Cycle Technology | IGCC Today | IGCC 2012 | PC Today | PC 2012 | NGCC Today | NGCC 2012 | |
| Data Description | Units | Value | Value | Value | Value | Value | Value |
| Reference plant | |||||||
| Coe: capital | mill/kWh | 30 | 26 | 26 | 25 | 12 | 12 |
| Coe: fuel | mill/kWh | 10 | 9 | 10 | 10 | 18 | 17 |
| Coe: O&M | mill/kWh | 6 | 6 | 6 | 6 | 2 | 2 |
| Capital cost | $/kW | 1300 | 1145 | 1150 | 1095 | 525 | 525 |
| Net power output | MW | 500 | 500 | 500 | 500 | 500 | 500 |
| CO2 emitted | kg/kWh | 0.74 | 0.65 | 0.77 | 0.73 | 0.37 | 0.33 |
| Thermal efficiency (LHV) | 42.0% | 47.8% | 40.3% | 42.4% | 54.1% | 60.1% | |
| Heat rate (LHV) | Btu/kWh | 8124 | 7137 | 8462 | 8042 | 6308 | 5677 |
| Cost of electricity | ¢/kWh | 4.6 | 4.1 | 4.3 | 4.1 | 3.3 | 3.1 |
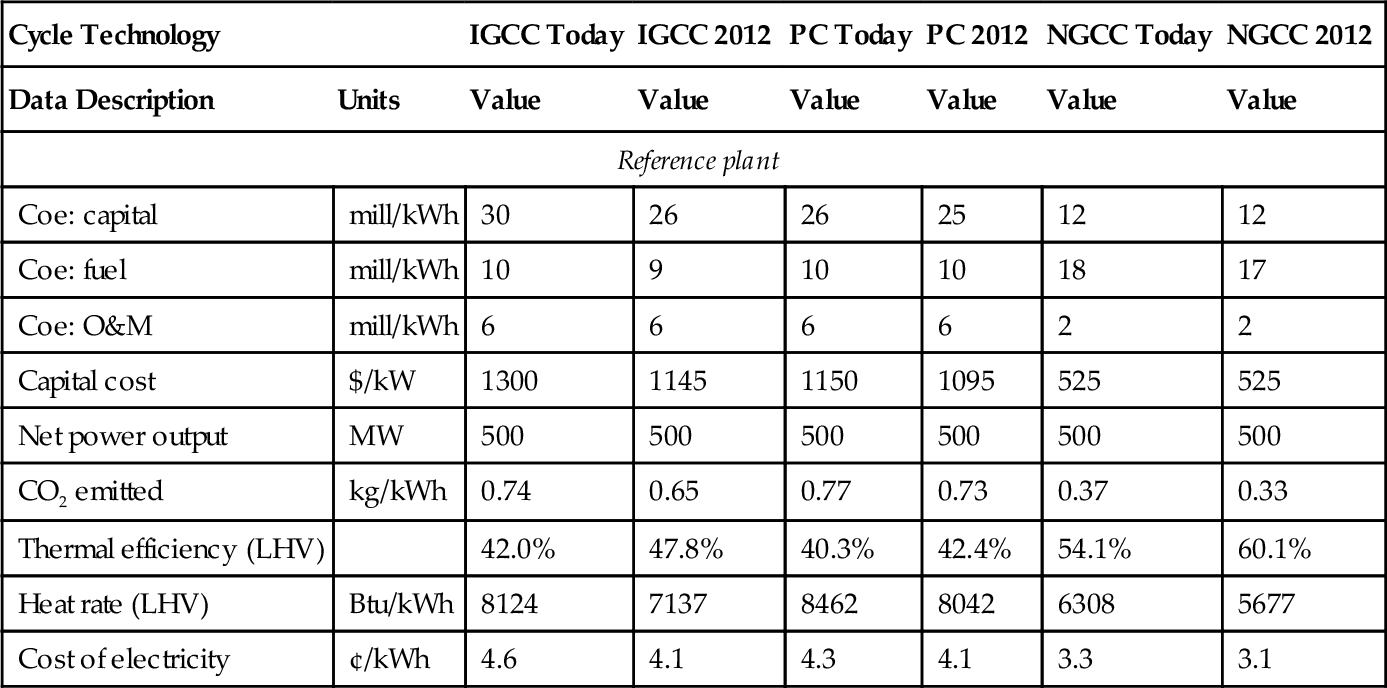
Herzog (1999)
Once it is captured, the CO2 can be sequestered in porous formations deep within the Earth. The technology for doing this is reviewed and discussed in Chapter 14. It is quite feasible using current technology to build a coal-fired power plant that has zero emissions. If all the CO2, NOx, SOx, mercuryand cadmium are capturedthe valuable products can be separated and sold. The rest can be sequestered underground along with the CO2. The technologies for capturing the waste products and sequestering them are collectively known as clean coal technologies. Such a zero emissions plant would still have an impact on the environment, but the impact would be moved to deep underground formations that do not affect our quality of life. The impact would be reduced considerably. This is further discussed in Chapters 13 and 14.
Oil
Oil has many of the same environmental impacts as coal. For oil, the H:C ratio is about 2:1, which means that it emits about two-thirds (2/3) the CO2 per unit of energy produced compared to coal. The emissions are 50% more than natural gas per unit of energy produced; however, because more oil is burned in the world than coal, oil often produces more CO2 than coal. Moreover, much of the oil is burned as transportation fuels, which are distributed moving sources of CO2. This means that it is very difficult to capture and sequester the CO2 being produced. Coal does not have this problem. As coal is burned in power plants, which are fixed point sources, the emissions can be captured and sequestered at the source. One way to overcome this problem with transportation fuels is to build electric- or hydrogen-powered cars, trucks, and trains. Airplanes would also have to be fueled by hydrogen. (The topic of hydrogen will be discussed in more detail in Chapter 15, but there are major technical difficulties with the development of a hydrogen-fueled economy.) Hydrogen is expensive, difficult to store and transport and its energy density on a per volume basis is one-sixth that of gasoline. The attraction with hydrogen is that, when burned, it only produces water; however, this may create another problem. Water vapor is a stronger greenhouse gas than CO2. If all transportation vehicles became hydrogen powered, the end result could be a problem that is as bad as or worse than the current CO2 problem.
Some oils, like some coals, have significant quantities of sulfur associated with them, and when burned they can produce SOx, as well as NOx. These pollutants are easily removed at the refinery so that most transportation fuels made from refined oil are today relatively clean burning.
Natural Gas
Natural gas is actually more abundant than oil and today is widely used both for space heating as well as to generate electricity. It can also be processed into transportation fuels such as gasoline, diesel, and jet fuel. For natural gas, the H:C ratio is about 4:1, which means that it emits about one-half (1/2) of the CO2 per unit of energy produced, compared to anthracite-coal. The emissions are three-fourths (3/4) of that of oil, per unit of energy produced. Consequently, natural gas is promoted as a clean-burning fuel that is better for the environment. The CO2 that is generated could be captured from the flue gas and sequestered in the same manner as from coal plants.
Some natural gas fields, like some oils and some coals, have significant quantities of sulfur associated with them, and if burned in their raw state they could produce SOx and NOx. These pollutants (such as hydrogen sulfide, carbon dioxide, and nitrogen) are required to be removed by processing at the production facilities in the field so that by the time they are compressed and put into a pipeline for transportation to the user, the gas will be free of all such pollutants. Consequently, when it is burned, the only pollutant it will produce is CO2.
Wind
Wind power is very popular amongst environmental activists because it is perceived as a clean, renewable energy source; however, it too has environmental impacts that cause concern to some people. The main environmental issues are materials of construction, destruction of the viewshed, noise and health effects. It also has an issue of unreliability (because the wind does not blow all the time), but this is not an environmental issue and will be discussed in more detail in Chapter 9.
Modern wind generators consist of large turbines that make significant noise in the low frequency range. This frequency ranges from the audible to the infrasonic frequencies. The noise is not more than that caused by busy highways, but to people living and working near them, it can be very disconcerting. In addition, people also feel that the noise in the inaudible infrasonic range causes health effects that are significant and not fully understood. Consequently, people do not want to live and work close to them. These effects are still being studied. On the other hand, if they are placed in remote areas away from people, others complain that they destroy the viewshed in otherwise pristine environments. The mitigation and solution to these complaints are not immediately obvious.
Some have also claimed that wind generators kill birds. While this is true, the environmental impact is quite minimal. Wind generators do kill about 0.4 birds per gigawatt-hour of electricity generated. This turns out to be a small number compared to the number that die as a result of automobile traffic, hunting, electric power transmission lines, high-rise buildings, and cats. In the United States, turbines kill about 100,000 birds per year, compared to 80,000 killed by aircraft, 60 million killed by cars, 100 million killed by collisions with plate glass in buildings, and 200 million killed by cats. The impact of wind turbines on birds is really negligible compared to these other hazards. The Peñascal Wind Power Project in Texas and the Altamont Pass Wind Farm in California are two projects that have had particular issues with bird mortality, but they have taken steps to minimize the hazard to the local bird populations.
Solar
Solar Energy, like wind power, is also very popular among people in environmental circles because it is perceived as a clean, renewable energy source. Solar power is unlikely to be anything more than a small niche player, but if it ever became large and widespread, its environmental impacts would become more obvious. Solar energy is very diffuse and to concentrate it into a more usable form requires large land areas. Whether photovoltaics or large solar collectors are used, they have to be spread over a large land area to generate enough energy to supply a large number of people. This can destroy the viewshed as well as whole ecosystems in pristine environments such as deserts. All of the plants and most of the animals that live in the ecosystem that gets covered by the solar collectors would die. Whole ecosystems would be wiped out. The other significant impact is that when installed on roofs of houses or other small buildings, trees have to be removed, not planted or inhibited in some way lest they decrease the collection of the solar energy.
Hydroelectric
Hydroelectric power is also a clean, renewable energy. Interestingly enough, when states such as California require that electric utilities provide 20-50% of their power from renewable sources, they will not allow hydroelectric power to be counted as renewable in the calculation. Ostensibly, this is because they recognize that it has some environmental impact. While this is true, as I have explained in this text, there are no environmentally benign energy sources.
To generate hydroelectric power, rivers have to be dammed and valleys have to be flooded. This has a clear environmental impact. The ecology of the entire river valley is altered forever. This particularly affects any anadromous fish (such as salmon, trout, sturgeon, and lamprey) that are born in the upper reaches of the river and move downstream to the ocean to mature and return to the river to spawn and die. The dam will disrupt their migration paths. The solution to this is to construct fish chutes beside the dam that allow the fish to still travel up and down the river, although many are not completely happy with this method. An example of these effects is illustrated by the Columbia River system in Northwest United States and discussed in Chapter 10.
Another well-known environmental impact is that when river valleys are flooded, the vegetation (particularly trees) that get flooded and die decay in an anaerobic environment, which produces methane. This methane finds its way into the atmosphere, where it acts as a powerful greenhouse gas. Some of the rise in atmospheric methane levels shown in Figure 4.5 is due to the construction of hydroelectric dams.
Nuclear
Nuclear power produces radioactive waste, which has to be sequestered. This is not an easy task, demonstrated by the controversy over the Yucca Mountain Nuclear Waste Repository. No one wants to live near a nuclear waste repository and no one wants nuclear waste being transported through their city to the repository. The nuclear industry, by necessity, has an excellent safety record, but three incidents in particular illustrate the public’s concern. These were the accidents at Three Mile Island in Pennsylvania, at Chernobyl in the Ukraine and the recent accident at the Fukushima facility in Japan. Accidents happen, and continued use of nuclear power will likely lead to further releases of radiation. This is discussed in more detail in Chapter 7.