Solar Power
Abstract
There is intense public interest in developing solar power for widespread use, but there are two major problems. First, the sun does not shine all the time, and, as a result, it cannot serve as a reliable energy source without reliable storage technology. More importantly, the cost of solar energy is still 10 times the cost of other energy sources, making it uncompetitive in the energy market. Surprisingly, solar power generation also has environmental impacts that are not fully appreciated. For instance, would people be happy if we had to cover the Mojave Desert with solar collectors? What if we cut down 50 million trees so that they would not shade the solar collectors on our roofs?
There is immense public interest in developing solar power for widespread use, but there are several major problems with this development. First, the sun does not shine all the time and so it cannot be a reliable source without reliable energy storage technology. Second, and more importantly, the cost is still 10 times the cost of other energy sources and so it is not cost competitive. The public likes solar energy because they perceive it to be cheap and clean with no environmental impacts. Surprisingly, this is not true; it does have environmental impacts that are not fully appreciated. For instance, would people be happy if we had to cover the Mojave Desert with solar collectors or if we cut down 50 million trees so they would not shade the solar collectors on our roofs? Just as hydroelectric power changes the ecology of the rivers that provide the power, solar collectors change the ecology of the areas where they are deployed.
In some respects, most of the energy used on earth is solar energy. The only exceptions are nuclear power and geothermal energy. Nuclear power originated in the creation of uranium in a supernova hundreds of millions of years ago, while geothermal energy comes from radioactive processes deep in the earth’s core. All fossil energy originally came from solar energy generated millions of years ago. Wind energy and hydroelectric energy also depend directly on solar activity. The sun shining on the earth creates the hot spots that cause the wind to blow. Solar activity also evaporates the water from the oceans to cause the rain to fall at higher elevations, where it is captured as potential energy and converted into electrical energy.
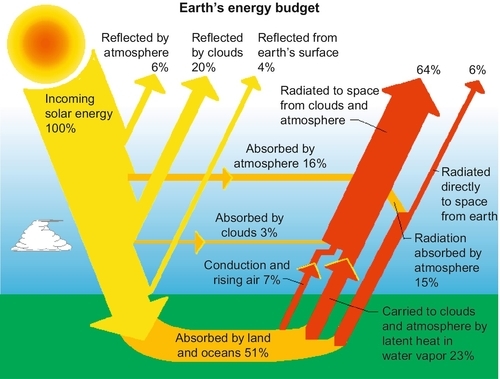
Every day the sun beams an average of 60,000 EJ of energy directly to the earth. If it did not receive this energy, the earth would die. Figure 8.1 illustrates what happens to this energy: 6% is reflected by the atmosphere; 20% is reflected by the clouds; 4% is reflected by the earth’s surface; 16% is absorbed by the atmosphere; 3% is absorbed by the clouds; and 51% is absorbed by the land and the oceans. Very little of the energy is actually captured. Most of what is absorbed is radiated back into space. Nevertheless, solar energy plays a crucial role in controlling the temperature of the earth. When solar insolation increases, the earth warms up and when it decreases the earth cools down. Solar insolation has the most significant impact on the earth’s temperature, much larger than all the greenhouse gases combined. A very small part of the sun’s energy is captured by plants and animals on the earth and used to support the growth of living organisms on the planet.
The total solar energy that reaches the upper atmosphere is 1367 W/m2. Of this, about 697 W/m2 reaches the earth’s surface and is absorbed by the land and the oceans. The other 670 W/m2 is intercepted by the atmosphere and reflected or absorbed and reradiated back into space. Not all of this energy is in a form that can be captured by photovoltaic (PV) technology. By the time it reaches the earth’s surface, the usable solar energy received averages about 300 W/m2. The diameter of the earth is 12,750 km (7920 miles). The surface area of the earth is 510 Tm2, of which 149 Tm2 is land and the other 361 Tm2 is ocean. The usable solar energy hitting the land area is 300 × 149 TW = 45 PW. The world uses about 500 EJ/year, which is 500/(365 × 24 × 3600) EW = 0.016 PW. A tiny fraction of the usable solar energy that is hitting the land mass of the earth could power the entire world. Put another way, if the 45 PW hitting the land was captured with 10% efficiency, it would take 0.35% of the land area to be used to capture enough solar energy to power the entire world. Of course, it is not as simple as that. Solar energy is very expensive. It is intermittent, unreliable and requires exotic materials. There are simply not enough of these materials to do the job.
Solar power technology attempts to capture some solar energy and convert it to electricity to power a portion of our lifestyle. Some solar energy can also be captured as heat energy and used to heat our houses, buildings and hot water. Capturing the vast energy of the sun has been the dream of scientists for millennia. Unfortunately, it is not an easy thing to do economically. Part of the reason for this is that solar energy is very diffuse and it costs a lot to concentrate it into usable forms.
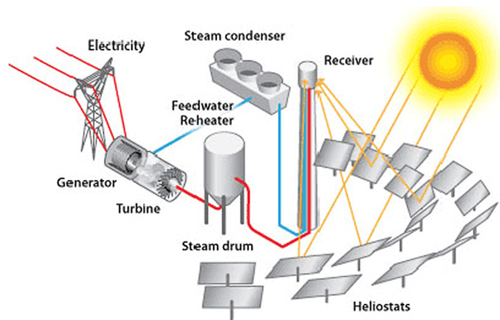
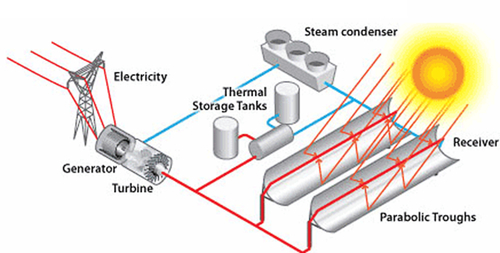
There are two main methods of directly capturing sunlight to be used as an energy source for electricity generation. The first is through the use of semiconductors to convert sunlight directly into electricity. This method is known as photovoltaic (PV) solar energy. The second method involves using mirrors to concentrate sunlight onto pipes or towers containing liquid material that is used to heat steam to drive a turbine to make electricity. This method goes by the name of concentrated solar power (CSP). Figure 8.2 shows one such facility while Figure 8.3 shows the schematic of a different design.
The basic PV installation, converting sunlight into direct current (DC) electricity, outputs DC electricity, which is used to charge a battery, which is then used to power DC loads such as lights or heating elements. The electrical grid, however, is alternating current (AC), which can be used to power lights and heating elements but also to run electric motors that drive fans and compressors. DC motors are more difficult and expensive to run as electrical motors, so it is easier to convert DC into AC using an inverter.
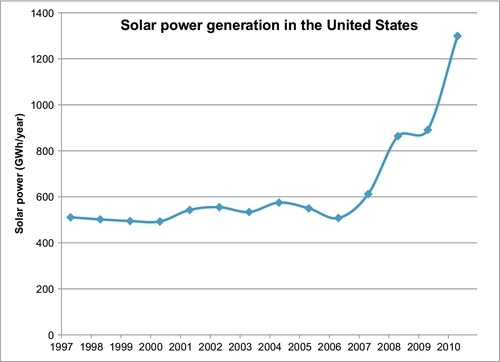
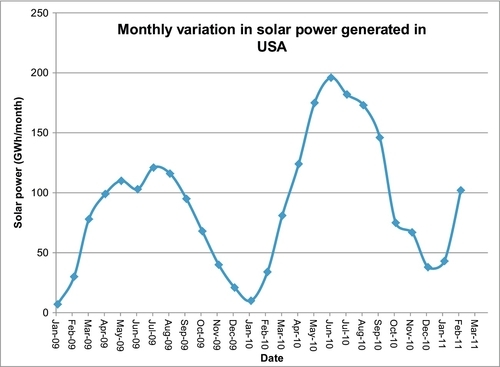
Figure 8.4 shows the growth in solar energy in the United States over the past 15 years. The production was very flat up until 2008, when a sharp rise occurred. Nevertheless, the solar power production is still very small. Figure 8.5 shows the monthly production over the 2 years from January 2009 to March 2011. This indicates that solar energy production decreases dramatically in the wintertime. The short winter days and the lower angle of the winter sun have a large effect on this, but later analyses suggest that the decrease is much larger than expected. In places such as Tucson, Arizona, and the Mojave Desert in California where the Solar Energy Generating Systems (SEGS) CSP plants are located, the decrease in winter solar radiation is not nearly as much as Figure 8.4 would suggest. The explanation for this is that some of the larger solar energy plants are deliberately shut down through the winter because they have recently been operated as daily summer peaking units.
Photovoltaics
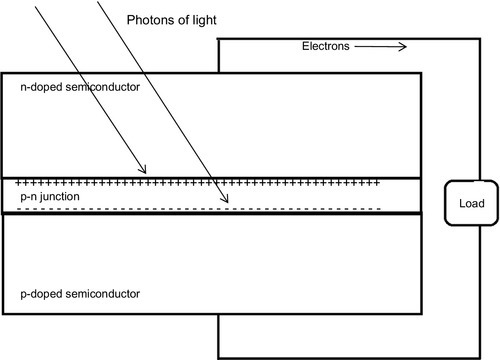
Solar PV cells work on the principle of the photoelectric effect. When a photon of light strikes a solar cell, its energy is transferred to an electron in the semiconductor material in the top layer. If enough energy is absorbed by the electron, it can escape from its normal position in the atom. In this process, the electron creates an empty spot where the electron used to be, which is termed the electron “hole.” Each photon of light with the right level of energy will free one electron and create one hole. The semiconductors and the junction between them create an electrical field that is strong enough to push the freed electron through the material and around an electric circuit to create an electrical current. This is illustrated in Figure 8.6.
Father and son scientists Antoine César Becquerel and Alexandre Edmond Becquerel discovered this PV effect in 1839, when Alexandre was only 19 (Antoine was 51). Alexandre, under the supervision of his father, was experimenting with a beaker containing an electrolyte and two metal electrodes and noticed that certain metals and solutions could produce small electric currents when exposed to light. They reported this discovery to the scientific community, but could not find a practical use for it. The Becquerels were part of a very famous family of French scientists, and Alexandre’s son, Henri, became even more famous than his father and grandfather when he codiscovered radioactivity along with Pierre and Marie Curie. Henri Becquerel was awarded the Nobel Prize in physics in 1903. The SI unit of radioactivity is named after him.
In 1877, American Charles Fritts improved on the Becquerels’ discovery using selenium as the semiconductor, separated by a very thin layer of gold. Fritts was able to generate electricity with an efficiency of about 1%. Albert Einstein’s landmark paper on the photoelectric effect in 1905 provided the theoretical framework that began to explain the PV phenomenon, which led to further improvements. By 1935, both selenium and copper oxide semiconductors were being used as light sensors in PV cells for use in photographic photometers. The first solar cell based on a semiconductor made from silicon was developed by Bell Laboratories’ Russell Ohl in 1941, and this led to substantially increased conversion efficiency. It was further improved and commercialized by Bell Laboratories in 1954. The Bell cells have since been widely used in satellite technology and space exploration.
The standard solar cell consists of three primary layers (see Figures 8.6 and 8.7). The top layer is made of a positively charged, electron-attracting, n-type semiconductor, while the bottom layer is made of a negatively charged, hole-attracting, p-type semiconductor. In between these layers is a doped semiconductive material called the p-n junction, which is a very thin single crystal layer that diffuses from p-type to n-type. An electric force field is created by the depletion of the electrons and holes at the p-n junction. This electric field provides the voltage needed to force the electrons to jump across the p-n junction and move through the semiconductors and around the loaded electric circuit (see Figure 8.6). The electron flow represents the electrical current driven by the voltage of the cell’s electric field. The product of the generated current (in amperes) and the generated voltage (measured in volts) constitutes the electrical power in watts. The power in watts multiplied by time in seconds gives the energy generated in joules.
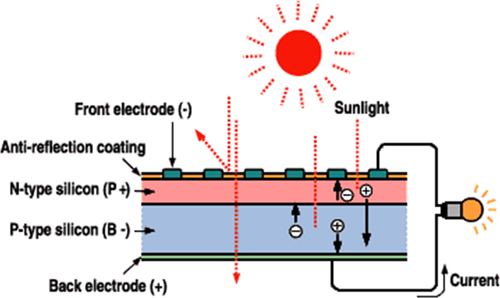
The solar cell also has a conducting layer on the top and bottom of the cell to collect the electrical current flowing into and out of the cell. The contact layer on the top face of the cell, where light enters, is designed to let light in; at the same time, it also conducts the electrons out. It is composed of a metal wire conductor arranged in a grid pattern, with enough wire to conduct the electrons away, but also with enough space between the wires to allow the light sensitive semiconductor to have access to the light source. The electrical contact layer on the bottom of the cell covers the entire bottom surface of the cell because it does not have to be transparent to the light. Covering the surface wire grid and the n-type semiconductor is an antireflective coating to reduce reflection losses and hold the wire grid in place.
The most common material used in solar cells has been single crystal silicon. Commercial solar cells made from single crystal silicon are currently limited to about 20% efficiency because they are most sensitive to infrared light. Solar radiation in this region of the electromagnetic spectrum is lower in energy than violet and ultraviolet light. The best research lab efficiency has been at the University of New South Wales (Australia) where their single crystal silicon solar cells have achieved efficiencies up to 25% (see Figure 8.8).
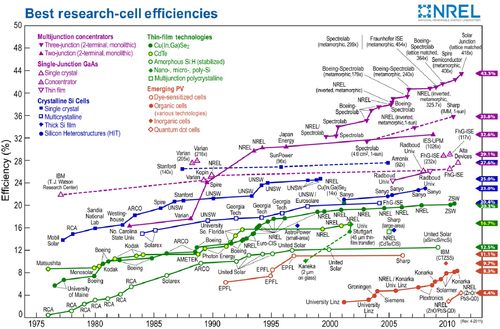
Polycrystalline solar cells are made by a casting process in which hot liquid silicon is poured into a mold and cooled, then sliced into very thin wafers. This process makes the solar cells significantly cheaper to produce than single crystal cells, but their commercial efficiency has been less than 15% due to internal resistance at the boundaries of the silicon crystals. The best research lab efficiency has been 20.4% (see Figure 8.8).
Amorphous silicon solar cells are made using silane (SiH4) gas to deposit silicon onto a transparent medium. This type of solar cell can be applied as a thin film to low-cost substrates such as glass or plastic. Thin film cells have a number of advantages: easier deposition and assembly; the ability to be deposited on inexpensive substrates; the ease of mass production; and high suitability to large applications. Given that amorphous silicon cells have no crystal structure at all, their efficiencies have been less than 10% due to internal energy losses. United Solar, however, has recently been able to achieve efficiencies of 12.5% with these types of solar cells.
A number of other materials can also be used to make solar cells and currently research programs have been investigating gallium arsenide, copper indium diselenide, copper gallium diselenide, and cadmium telluride. Newer, high-tech solar cells have also achieved improved energy conversion efficiency by incorporating two or more layers of different materials with different wavelength sensitivities. Top layers are designed to absorb higher energy photons while allowing lower energy photons through to be absorbed by the layers beneath. Double-junction cells are already commercially available and triple-junction cells have achieved efficiencies up to 43.5% in the laboratory using concentrators. In this process, large lenses are used to concentrate the light onto a small solar cell, greatly increasing their efficiency.
Concentrated Solar Power
CSP installations use mirrors to concentrate sunlight onto pipes containing a working fluid such as steam or Therminol. The working fluid is heated by the concentrated solar energy which drives a heat engine such as a steam turbine, which generates electricity.
The total installed capacity of CSP plants in the world in 2011 was about 1.5 GW, mostly located in the United States and Spain. While Spain has 582 MW, the United States has 507 MW of capacity. 1.5 GW is about the size of one medium size power plant burning coal or natural gas, so the installed capacity is still very small. There is also another 17.5 GW of CSP projects under development worldwide, of which 8.7 GW is in the United States, 4.5 GW in Spain and 2.5 GW in China.
There are four common CSP forms in use: parabolic troughs, dish stirlings, linear fresnel reflectors, and solar power towers. These systems usually use tracking systems to allow the concentrating mirrors to follow the sun across the sky and maintain the maximum energy. The different designs produce different operating temperatures and varying thermodynamic efficiencies due to the differences in the way that they track the sun and focus light.
The most common type of CSP is the parabolic trough, which consists of a linear parabolic reflector that concentrates light onto a pipe containing the working fluid positioned along the reflector’s focal line. The parabolic reflector follows the sun during the daylight hours by single axis tracking. The SEGS plants in California, Nevada Solar One near Boulder City, Nevada and Plataforma Solar de Almería's SSPS-DCS plant in Spain use this technology.
Figure 8.3 illustrates the parabolic trough system used at the SEGS Plants in California. This is the largest system of solar power plants in the United States. The SEGS units use patented synthetic oil (called Therminol) as the working fluid in the pipes at the focal point of the parabolic units. There are nine SEGS units, but the ownership was split when the original owners, LUZ International, went bankrupt in 1991. Seven of the units, SEGS III-IX, are now co-owned and operated by NextEra Energy (formerly FPLEnergy). SEGS I and II were sold to Sunray Energy Incorporated, but are now owned and operated by Cogentrix Solar Services. The working fluid used in these plants, Therminol, is a synthetic oil and as such is highly flammable. This led to a disaster in February 1999, when a 900,000 gallon Therminol storage tank exploded at the SEGS II plant in Daggett, CA and caused extensive damage.
Currently, the SEGS units are operated as peaking units, which means that they do not operate all the time. On hot summer days when the generating capacity of the units is at its peak, the plants are turned on to satisfy the increased demand for electricity to run air conditioners in California. Table 8.1 details some of the history of operation from 1996-2002 when the units were operated year round.
Table 8.1
Operational Data for the Nine SEGS Solar Power Plants
| Plant | Year Built | Location | Net Turbine Capacity (MW) | Field Area (m2) | Oil Temperature (°C) | Gross Solar Production of Electricity | |
| average 1998-2002 (MWh) | Capacity Factor (%) | ||||||
| SEGS I | 1984 | Daggett | 14 | 82,960 | 307 | 16,500 | 13.45 |
| SEGS II | 1985 | Daggett | 30 | 165,376 | 316 | 32,500 | 12.37 |
| SEGS III | 1986 | Kramer Jct. | 30 | 230,300 | 349 | 68,555 | 26.09 |
| SEGS IV | 1986 | Kramer Jct. | 30 | 230,300 | 349 | 68,278 | 25.98 |
| SEGS V | 1987 | Kramer Jct. | 30 | 250,500 | 349 | 72,879 | 27.73 |
| SEGS VI | 1988 | Kramer Jct. | 30 | 188,000 | 391 | 67,758 | 25.78 |
| SEGS VII | 1988 | Kramer Jct. | 30 | 194,280 | 391 | 65,048 | 24.75 |
| SEGS VIII | 1989 | Harper Lake | 80 | 464,340 | 391 | 137,990 | 19.69 |
| SEGS IX | 1990 | Harper Lake | 80 | 483,960 | 391 | 125,036 | 17.84 |
| Totals | 354 | 2,290,016 | 654,544 | 21.11 | |||
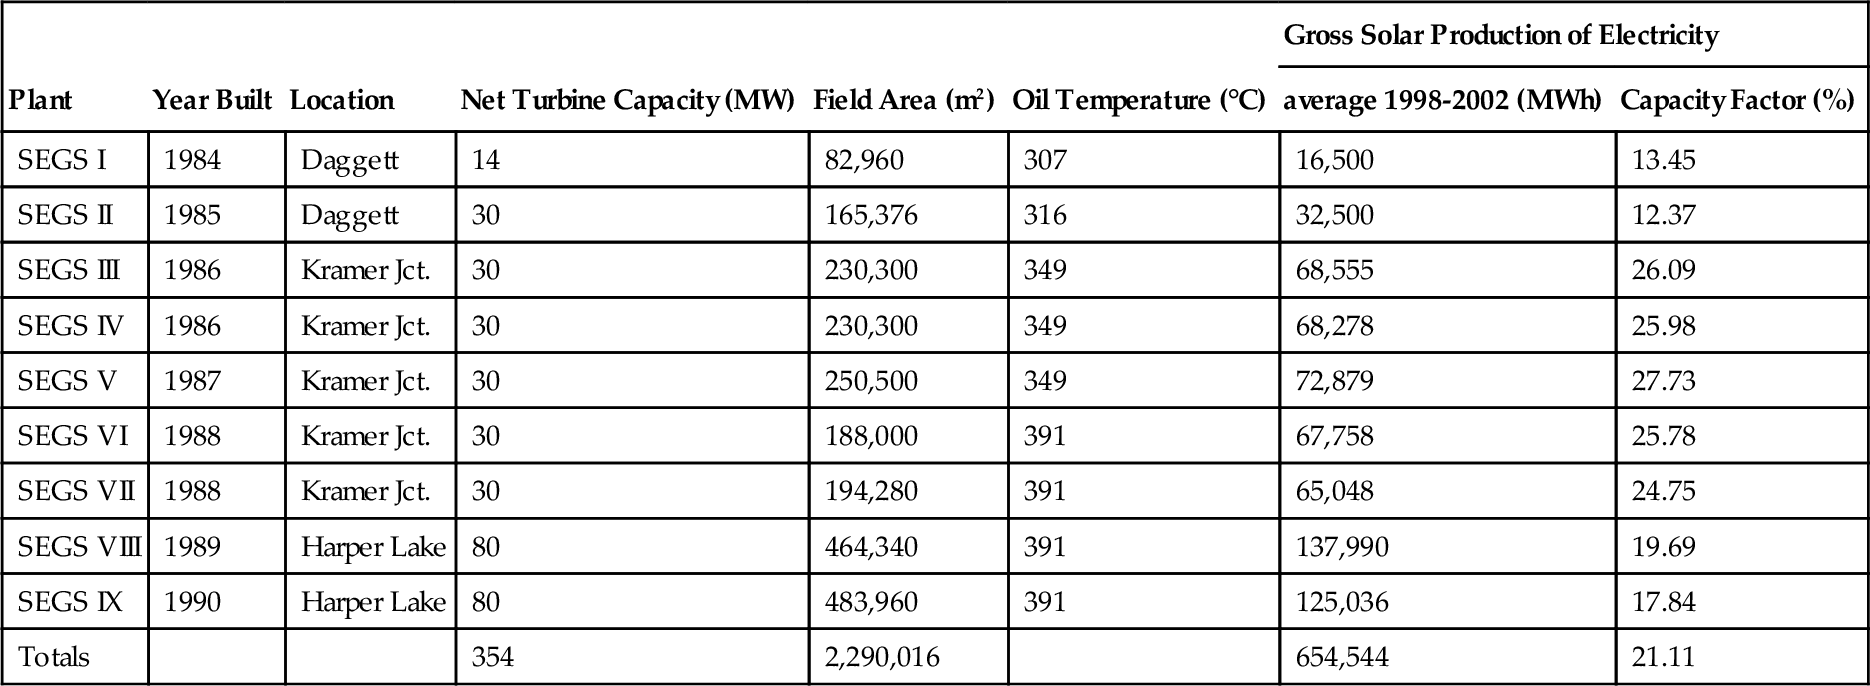
The data shows a capacity factor of 21% on average during this time. This, however, is somewhat misleading because seven of the units (III-IX) were operated at night and on cloudy days by supplementing the steam turbines with natural gas supplied energy. The true capacity factor from solar energy is probably closer to the 13%, seen at the SEGS I and II units.
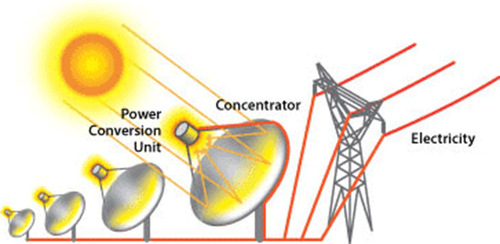
A Dish-Stirling System consists of a stand-alone parabolic reflector that concentrates sunlight onto a receiver positioned at the reflector’s focal point (Figure 8.9). The dish reflector tracks the sun along two axes. The working fluid in the receiver is heated up to the optimal temperature and then used by the Stirling engine to generate power. Dish engine systems eliminate the need to transfer heat to a boiler by placing a Stirling engine at the focal point. The University of Nevada Las Vegas, the Australian National University in Canberra and the Sandia National Labs have pilot projects using this technology. A commercial application of this technology has been approved for construction by Stirling Energy Systems Solar Two, LLC (SES Solar Two, LLC) in Imperial County, California. The California Energy Commission provided the following details on this project:
The proposed Imperial Valley Solar/SES Solar Two project would be a nominal 750-megawatt (MW) Stirling engine project, with construction planned to begin either late 2009 or early 2010. Although construction would take approximately 40 months to complete, renewable power would be available to the grid as each 60-unit group is completed. The primary equipment for the generating facility would include the approximately 30,000, 25-kilowatt solar dish Stirling systems (referred to as SunCatchers), their associated equipment and systems, and their support infrastructure. Each SunCatcher consists of a solar receiver heat exchanger and a closed-cycle, high-efficiency Solar Stirling Engine specifically designed to convert solar power to rotary power then driving an electrical generator to produce grid-quality electricity. The 6500 acre project site is located on approximately 6,140 acres of federal land managed by the Bureau of Land Management (BLM) and approximately 360 acres of privately owned land. The site is approximately 100 miles east of San Diego, 14 miles west of El Centro, and approximately 4 miles east of Ocotillo, California.
The project will be constructed in two phases. Phase I of the project will consist of up to 12,000 SunCatchers configured in 200 1.5-MW solar groups of 60 SunCatchers per group and have a net nominal generating capacity of 300 MW. Phase II will add approximately 18,000 SunCatchers, expanding the project to a total of approximately 30,000 SunCatchers configured in 500–1.5-MW solar groups with a total net generating capacity of 750 MW.
The Applicant has applied for a ROW grant for the Project Site from the Bureau of Land Management (BLM) California Desert District. Although the Project is phased, it is being analyzed in this Application for Certification as if all phases will be operational at the same time.
The project would include the construction of a new 230-kV substation approximately in the center of the project site, and would also be connected to the SDG&E Imperial Valley Substation via an approximate 10.3-mile, double-circuit, 230-kV transmission line. Other than this interconnection transmission line, no new transmission lines or off-site substations would be required for the 300-MW Phase I construction. The full Phase II expansion of the project will require the construction of the 500-kV Sunrise Powerlink transmission line project proposed by SDG&E. Within the Project boundary, Phase I requires approximately 2,600 acres and Phase II requires approximately 3,500 acres. The total area required for both phases, including the area for the operation and administration building, the maintenance building, and the substation building, is approximately 6,500 acres. The 230-kV transmission line required for Phase I would parallel the Southwest Powerlink transmission line within the designated right-of-way (ROW). A water supply pipeline for the project would be built on the approved Union Pacific Railroad ROW. Since the proposed project does not have a steam cycle, the primary water use would be for mirror washing.
A solar power tower (Figure 8.2) consists of an array of dual axis tracking reflectors (heliostats) that concentrate light on a central receiver on the top of a tower which contains the working fluid. This fluid is heated to the optimal temperature and then used as a heat source for power generation in a turbine. The Solar Two in Daggett, California and the Planta Solar 10 (PS10) in Sanlucar la Mayor, Spain (see Figure 8.2) use this technology. eSolar’s 5-MW Sierra SunTower located in Lancaster, California is the only CSP tower facility currently operating in North America, but Rice Solar Energy recently had a 150 MW solar tower unit approved for construction in Riverside County in California. The California Energy Commission provided the following details on this project:
Rice Solar Energy, LLC, (RSE) a wholly owned subsidiary of SolarReserve, LLC, proposes to construct, own, and operate the Rice Solar Energy Project (RSEP or project). The RSEP will be a solar generating facility located on a privately owned site in unincorporated eastern Riverside County, California. The proposed project will be capable of producing approximately 450,000 megawatt hours (MWh) of renewable energy annually, with a nominal net generating capacity of 150 megawatts (MW).
The RSEP will be located in an unincorporated area of eastern Riverside County, California. Land surrounding the project site consists mostly of undeveloped open desert that is owned by the federal government and managed by the U.S. Bureau of Land Management (BLM).
The proposed facility will use concentrating solar power (CSP) technology, with a central receiver tower and an integrated thermal storage system. The RSEP's technology generates power from sunlight by focusing energy from a field of sun-tracking mirrors called heliostats onto a central receiver. Liquid salt (The salt is a mixture of sodium nitrate, a common ingredient in fertilizer, and potassium nitrate, a fertilizer and food additive. These mineral products will be mixed onsite as received directly from mines in solid crystallized form and used without additives or further processing other than mixing and heating.), which has viscosity and appearance similar to water when melted, is circulated through tubes in the receiver, collecting the energy gathered from the sun. The heated salt is then routed to an insulated storage tank where it can be stored with minimal energy losses. When electricity is to be generated, the hot salt is routed to heat exchangers (or steam generation system). The steam is then used to generate electricity in a conventional steam turbine cycle. After exiting the steam generation system, the salt is sent to the cold salt thermal storage tank and the cycle is repeated. The salt storage technology was demonstrated successfully at the U.S. Department of Energy-sponsored 10-MW Solar Two project near Barstow, California, in the 1990s.
According to the applicant, this unique CSP technology offers several important benefits. Because liquid salt has highly efficient heat transfer and storage properties, it is used as the heat transfer medium in the cycle. Natural gas heating is therefore not required for startup or for operating stability during routine cloud cover. Second, the stored energy in the salt can be extracted upon demand and produce electricity even when there is no sunlight. Finally, the output from the RSEP will produce a stable electricity supply, compensating for potential impacts on the electricity grid from other intermittent energy sources having less predictable operating characteristics.
The solar facility will have the following key elements:
• A large circular field of mirrors (heliostats) that reflect the sun’s energy onto a central receiver tower
• A conventional steam turbine generator to produce electricity
• Insulated tanks to store the hot and cold liquid salt heat transfer fluid, and
• An air-cooled condenser (ACC) to eliminate water consumption for cooling the steam turbine exhaust
There is also another 370 MW solar tower installation being planned for the Ivanpah Dry Lake, in San Bernardino County, California, on federal land managed by the Bureau of Land Management. The owners are Solar Partners LLC. The details on this project are as follows:
The proposed project includes three solar concentrating thermal power plants, based on distributed power tower and heliostat mirror technology, in which heliostat (mirror) fields focus solar energy on power tower receivers near the center of each heliostat array. Each 100-MW site would require approximately 850-acres (or 1.3 square miles) and would have three tower receivers and arrays; the 200-MW site would require approximately 1,600-acres (or 2.5 square miles) and would have 4 tower receivers and arrays. The total area required for all three phases would including the administration building/operations and maintenance building and substation and be approximately 3,400-acres (or 5.3 square miles). Given that the three plants would be developed in concert, the proposed solar plant projects would share the common facilities mentioned above to include access roads, and the reconductored transmission lines for all three phases. Construction of the entire project is anticipated to begin in the first quarter of 2009, with construction being completed in the last quarter of 2012.
In each solar plant, one Rankine-cycle reheat steam turbine receives live steam from the solar boilers and reheat steam from one solar reheater located in the power block at the top of its own tower. The reheat tower would be located adjacent to the turbine. Additional heliostats would be located outside the power block perimeter road, focusing on the reheat tower. Final design layout locations are still being developed. The solar field and power generation equipment would be started each morning after sunrise and insolation build-up, and shut down in the evening when insolation drops below the level required to keep the turbine online.
Each plant also includes a partial-load natural gas-fired steam boiler, which would be used for thermal input to the turbine during the morning start-up cycle to assist the plant in coming up to operating temperature more quickly. The boiler would also be operated during transient cloudy conditions, in order to maintain the turbine on-line and ready to resume production from solar thermal input, after the clouds pass. After the clouds pass and solar thermal input resumes, the turbine would be returned to full solar production. Each plant uses an air-cooled condenser or “dry cooling,” to minimize water usage in the site's desert environment. Water consumption would therefore, be mainly to provide water for washing heliostats. Auxiliary equipment at each plant includes feed water heaters, a deaerator, an emergency diesel generator, and a diesel fire pump.
Electricity would be produced by each plant's Solar Receiver Boiler and the steam turbine generator. The heliostat mirrors would be arranged around each solar receiver boiler. Each mirror tracks the sun throughout the day and reflects the solar energy to the receiver boiler. The heliostats would be 7.2-feet high by 10.5-feet wide (2.20-meters by 3.20-meters) yielding a reflecting surface of 75.6 square feet (7.04 square meters). They would be arranged in arcs around the solar boiler towers asymmetrically.
Each solar development phase would include:
• A natural gas-fired start-up boiler to provide heat for plant start-up and during temporary cloud cover
• An air-cooled condenser or “dry cooling,” to minimize water usage in the site's desert environment
• One Rankine-cycle reheat steam turbine that receives live steam from the solar boilers and reheat steam from one solar reheater located in the power block at the top of its own tower adjacent to the turbine
• A raw water tank with a 250,000 gallon capacity; 100,000 gallons to be used for the plant and the remainder to be reserved for fire water
• A small onsite wastewater plant located in the power block that treats wastewater from domestic waste streams such as showers and toilets, and
• Auxiliary equipment including feed water heaters, a deaerator, an emergency diesel generator, and a diesel fire pump.
Solar Efficiency of CSP Installations
The theoretical efficiency, η, of the conversion to electricity of the solar energy received can be determined from the theory of thermal radiation and from Carnot’s principle deduced from the second law of thermodynamics (see Chapter 3). In these systems, the solar insolation is first converted into heat and collected by the receiver with efficiency, ηreceiver. The heat is then converted into work with the thermodynamic efficiency of which the maximum possible is given by the Carnot efficiency ηcarnot. Hence, the total efficiency, η = ηreceiver × ηcarnot.
For a solar receiver providing the heat source at temperature TH and the heat engine rejecting heat to a heat sink at temperature TL (the atmosphere is usually the heat sink, so let TL = 300 °K), the Carnot efficiency was shown in Chapter 3 and appendix A to be:
The receiver efficiency can be calculated from the Stefan-Boltzmann law for thermal radiation, but to simplify the equations you must also assume the following: perfect optics (ηoptics = 1); the collecting and reradiating areas are equal; and, the absorptivity and emissivity of the collector and receiver are perfect. The receiver efficiency can then be calculated from:
Hence the total theoretical efficiency, η, is given by:
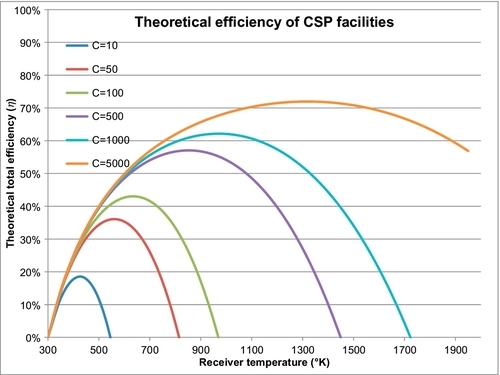
Where σ = Stefan-Boltzmann constant = 56.704 nW/(m2K4). For I = solar insolation, let us assume an optimistic 500 W/m2; and C = concentrator magnification. From Equation 8.3, it is obvious that the efficiency is a nonlinear function of the receiver temperature, TH. The higher the receiver temperature, the higher the Carnot efficiency; however, the receiver efficiency will be lower. The efficiency actually becomes zero at two points: the temperature where the Carnot efficiency is zero and the temperature where the receiver efficiency is zero. The Carnot efficiency is zero when TL = TH. This occurs at night when the sun is not shining and the receiver source temperature reduces to the atmospheric sink temperature. The receiver efficiency reduces to zero when σTH4/IC = 1. This occurs when the receiver has become so hot that all the solar energy that it is receiving is being reradiated back into the atmosphere. This is the maximum temperature possible for the receiver because all of the thermal energy the receiver is getting is being reradiated and none can be transmitted to the heat engine. At this temperature, the receiver efficiency reduces to zero. This is illustrated in Figure 8.10, which shows the theoretical efficiency as a function of the receiver temperature, TH, and the concentrator magnification, C. The higher the concentrator magnification (C), the higher the maximum efficiency that occurs at some optimum temperature, Topt. If the receiver is allowed to exceed this temperature, the efficiency of energy conversion will decline again because the receiver has become too hot and is losing too much energy from reradiation.
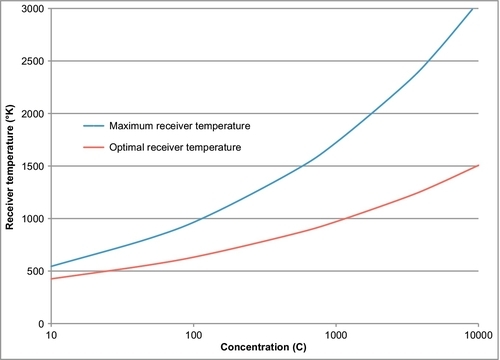
The maximum achievable receiver temperature, when the efficiency is zero, is given by:
The optimal operating temperature is determined by differentiating Equation 8.3 with respect to the operating temperature, TH, and setting the derivative to zero.
This leads to the following equation for the optimal temperature, Topt:
This equation (8.5) can be solved numerically to find the optimal temperature, Topt. A plot of the maximum temperature (Equation 8.4) and the optimum operating temperature (Equation 8.5) as a function of the magnification parameter, C, is shown on a semilog scale in Figure 8.11. Figure 8.10 implies that large solar efficiencies are feasible using these CSP facilities. In practice, however, these theoretical efficiencies are not achievable because of other inefficiencies in the optics, the absorptivity, the emissivity and the thermal inefficiencies of the heat engine. In fact, the thermodynamic efficiency of the heat engine is usually about 40% and the receiver efficiency is less than this, giving efficiencies in the range of less than 20%. Equation 8.3 and Figure 8.10 demonstrate the concept of the optimal operating temperature for CSP plants. In practice, Figure 8.10 can be used as a guide to search for the actual optimal temperature. Note that the data on the SEGS plants in Table 8.1 shows the working fluid is Therminol and the operating temperature is 391 °C (664 °K). The magnification parameter (C) is not given for these plants, but using the analysis above, an optimum temperature of 664 °K is consistent with C = 130.
Selected Location Studies
The U.S. NREL also records solar radiation data that allows one to determine the electricity generated by solar cells at locations around the United States and the world. Solar cells do not generate much electricity at large latitudes (northern or southern) in the wintertime because of the shortness of the days and the low angle of the sun. Much higher generation can be achieved at the same locations in the summertime. Locations at the equator can achieve relatively constant generation all year round, only being diminished on cloudy or rainy days. The larger the latitude, the larger the discrepancy will be between winter and summer generation. Of course, there is also a diurnal variation every day. Solar cells generate electricity only when the sun is shining and not at all at nighttime.
The next series of graphs shows the electricity generated from a PV system at selected locations using solar cells as a function of the month of the year. The assumed PV system is a single silicon crystal array with a collecting area of 35 m2 (377 ft2). This corresponds to a PV array that can theoretically generate 4 kW under optimal conditions. It also assumes that the solar radiation is converted to DC with a conversion efficiency of 11% and is then converted to AC with an efficiency of 77%. The overall efficiency of solar conversion is approximately 8%. You can also assume that the solar arrays track the sun with a dual axis system. A dual axis system is the most efficient way to maximize the solar energy that is harnessed. Fixed angle systems would harness lower energy amounts than those shown here.
Figures 8.12 through 8.17 show the results of the analysis for six cites in the western hemisphere arranged in order from Whitehorse (the capital city of the Yukon Territory in Canada) in the north, to Belem, Brazil, in the south. Whitehorse, which has latitude of 60.7°N, has very short days of low angle sun in the winter and so generates very little electricity in the winter months. In the long days of summer, it can generate more solar electricity than the tropical cities of Fort-de-France on the Caribbean island of Martinique, or Belem, which is situated at the mouth of the Amazon River in Brazil. Fort-de-France, at a latitude of 14.6°N and Belem, 1.4° south of the equator, both have relatively constant daily generating capacity all year round, but are more affected by the wet tropical climate than the length of the day or the solar radiation received. Table 8.2 summarizes the total annual electricity generated in the six locations along with the other city parameters. Note that of these six cities, Tucson is the best place to generate solar-powered electricity, partly because of its more southerly latitude but also because of its dry climate.
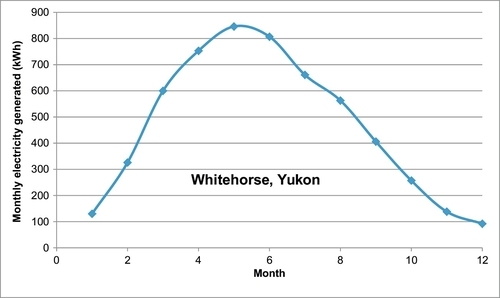
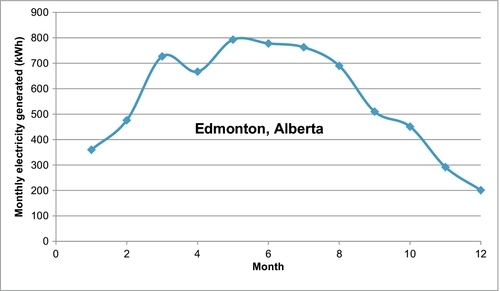
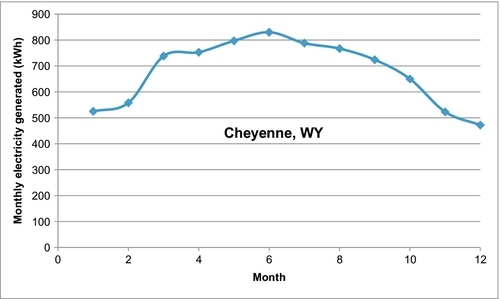
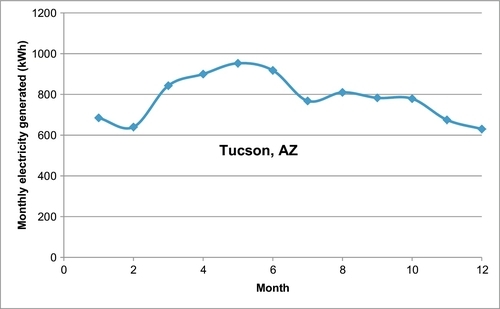
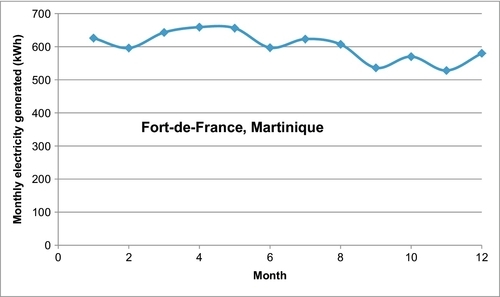
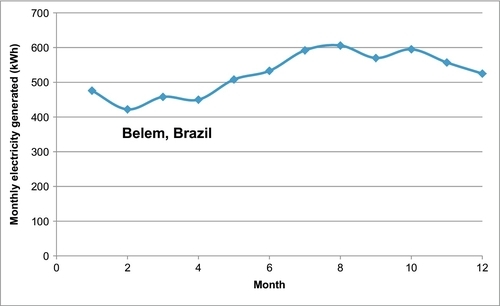
Table 8.2
Comparison of Six Cities for Photovoltaic Electricity Generation
| City | Latitude, °N | Longitude, °W | Elevation, ft | Average Solar Radiation, W/m2 | Total Annual AC Energy, kWh |
| Whitehorse, YK | 60.72 | 135.07 | 2306 | 210 | 5578 |
| Edmonton, AB | 53.31 | 113.58 | 2346 | 254 | 6708 |
| Cheyenne, WY | 41.15 | 104.82 | 6142 | 307 | 8125 |
| Tucson, AZ | 32.12 | 110.93 | 2556 | 384 | 9383 |
| Fort-de-France, M | 14.6 | 61.01 | 13 | 295 | 7221 |
| Belem, BR | − 1.38 | 48.48 | 52 | 261 | 6292 |
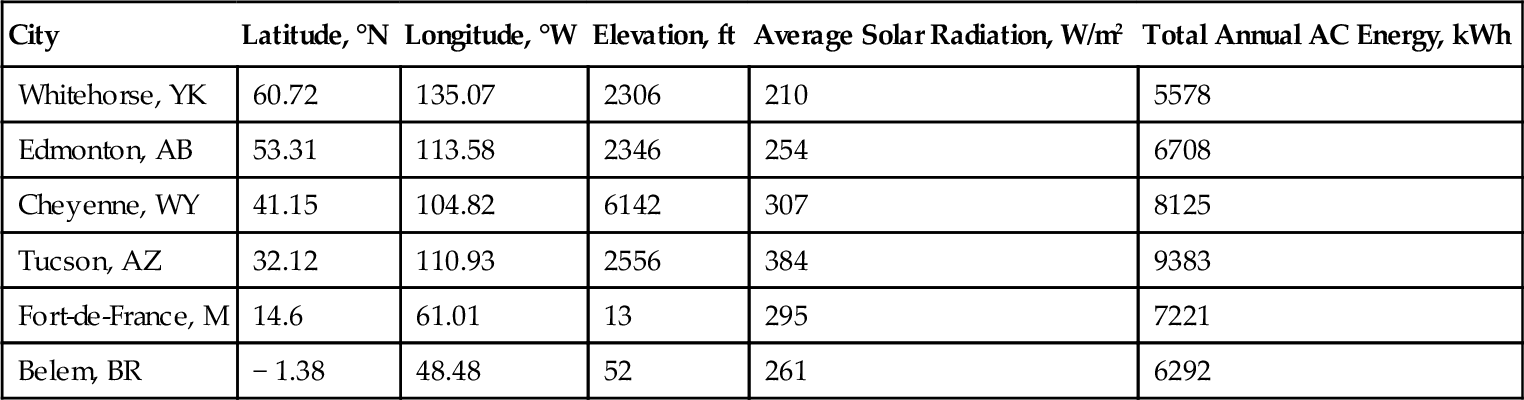
Looking at Figures 8.15-8.17, it is not easy to explain the monthly variation seen in the U.S. solar energy production shown in Figure 8.4. Solar production in the United States in the winter declines to a small fraction of the summer production value. Given that most of this production is coming from the southwest of the United States suggests that the winter decline should not be so large. The reason is that the large SEGS units in California are now used as peaking units in the summer and are largely shut down in the winter. Table 8.2 also shows the average solar radiation received in each of the six cities by a dual axis sun tracking PV module in W/m2. If single axis systems or fixed tilt systems are used, the solar energy captured will be less than this.
Environmental Issues
Solar energy is perceived as being environmentally friendly. It burns no fuel, it has minimal operating costs and there are no emissions. It is therefore perceived as having no impact on the environment. Because of the principle that I adopted in Chapter 1, this cannot be true. There are some environmental impacts in the manufacture and construction of the PV materials for PV installations. The same is true for solar thermal units. These impacts can be discounted as far less than the impacts of a coal burning plant; however, the big impact of a large solar installation (whether PV or CSP) is that it requires a lot of land. A 1-GW CSP facility requires at least 6000 acres of land while a 1-GW PV facility requires over 12,000 acres of land. Compare this to a 1-GW coal-fired or nuclear power plant, which requires about 600 acres of land. A 1-GW natural gas facility requires less than 300 acres. For solar installations, unlike wind power, land has to be dedicated to the harness of the energy. Moreover, if deployed in pristine environments, the ecology of that environment will be changed forever. Plants and animals that previously relied on the sun’s warmth and energy will be covered over and die. Because of the large land area required, there is also a visual impact. No matter where they are placed, solar installations will be noticed and will alter the visual landscape, the so called view-shed.
While solar power’s contribution to the energy mix remains small, these impacts will not be noticed. Solar power is likely to remain small because of the economic issues discussed in the next section. If some large breakthrough were made to make solar power more economic and the reach of solar power exploded into very large installations, the environmental impact would become more apparent. In that circumstance, just as people complain now about hydroelectric installations and are starting to complain about wind farms, so too will there be significant objections to solar power if it ever became successful. This is because you cannot extract energy from the environment without having an impact on the environment. Energy is part of the environment. These environmental impacts are covered in more detail in Chapter 4.
Economics
At its summit on April 4–7, 2011 in New York, Bloomberg New Energy Finance estimated that the capital cost of solar PV electricity generated from large, solar PV installations is $1.80 per watt and further predicted that the price would decline to $1.50 per watt by the end of 2011. From this, the installed cost can be estimated at $3-$4 per watt, or at least $3000 per kilowatt, allowing for installation costs. The capital cost of CSP plants is about the same as this. If a capital cost of $3000 for a 1-kW panel is amortized over 20 years at an interest rate of 5%, the payment would be $240 per year. In 1 year the 1-kW solar panel can generate about 876 kWh of electricity, assuming that over 1year the panel can generate electricity at about 10% of the maximum possible. This allows for the fact that the maximum possible electricity is generated only at noon in the middle of summer. On average on winter days, it only generates 50% of the electricity that it does on summer days. The cost of the electricity, assuming no fuel costs and negligible operating costs, is $240/876, or 27.4c per kWh. This is more than 10 times the cost of electricity generated from coal, nuclear, natural gas or hydroelectric and 5–8 times the cost of wind power. It also does not take into account any land costs, maintenance costs or electricity storage costs. CSP facilities produce power at about the same cost as PV systems. CSP systems were previously a little cheaper than PV systems but the costs of both have now equalized due to improvements in the manufacture of PV systems.
To avoid storage costs, most solar power generators prefer to sell any excess power they generate when the sun is at its peak back to the utility grid. The utilities do not like to buy this power because they have no control over the quantity and quality of the power they are getting. The utility has to balance the power available on the grid according to the demand. When demand is higher, they have to switch in more generating capacity; when demand reduces, they have to switch off the units. Solar (and wind) power that does not have energy storage facilities has to be added to the grid when it is generated. The utility has no control over how much they are getting or when or if it contains voltage fluctuations.
Political pressure has forced the utilities to buy back all the excess power that solar generators produce. As long as this power remains small, they can use their other generators to balance the load. The question remains: what tariff should the utility pay to the solar generator? The utility can buy electricity from other generators for the wholesale cost (which is often less than 2c/kWh), which they then sell to the consumer for the retail cost (which is 7c-12c per kWh) depending on the location and the customer size. The average cost for residential customers is now 12c/kWh, while large industrial customers pay about 7c/kWh. This is not an unreasonable mark-up because the electric utility supplies the distribution network which has to be capitalized and maintained. They also must include a reasonable profit in their cost to the consumer. If they are forced to buy back electricity from the consumer, they would like to pay the same < 3c/kWh cost that their other suppliers charge. Initially, however, they were forced to allow the solar generators to treat the electrical grid as a storage bin, putting power in when they had excess and taking it out again when they needed it. Whether or not an individual consumer is able to exactly balance their peaks and valleys, this arrangement effectively means that the solar power generators are selling the electricity to the utility for the retail cost. This represents an additional subsidy to the solar power generators. The utility has to make up this extra cost by raising its retail charges to all consumers. As long as solar energy remains small, this is not a big imposition. If for some reason the solar generation capacity was increased substantially, this would raise electricity rates for all consumers. Even this sweet deal, however, is an insufficient subsidy to make solar power cost effective because solar energy costs more than retail costs to generate. Consequently, many U.S. states and many countries have adopted special “feed-in tariffs” for solar generators. These rates vary widely from about 20 c/kWh up to 80 c/kWh. In the Australian state of Victoria, the rate paid to solar generators for small systems (up to 5 kW), the feed-in-tariff, is A60 c/kWh.
In 2011, the Australian dollar was about equal to the U.S. dollar. In the Canadian province of Ontario, the Renewable Energy Standard Offer Program, introduced in 2006 with the passage of the Green Energy Act, allowed residential homeowners in Ontario with small roof-top systems (less than 10 kW) to sell the energy they produce back to the grid at C42¢ per kWh, while buying power from the grid at C8¢ per kWh. Obviously this C42 c/kWh rate was still too low to make it worthwhile because in March 2009 the feed-in-rate for small solar panel installations was increased to C80¢/kWh. This gives one an idea of the cost of electricity from small roof-top systems—it is 30-40 times the cost of conventional power. The additional cost is subsidized by the electricity consumer with increased retail rates.
The Andosol-I Solar Energy plant, a relatively large 50-MW parabolic trough plant in Spain, receives a feed-in-tariff of €0.27/kWh (38.6 c/kWh) from the utilities in Europe. This plant cost €300 million ($425 million) to build so its capital cost can be also amortized at 5% over 20 years to give a payment of $21.25 million/year. Assuming a capacity factor of 15%, the 50-MW plant should be able to generate 65.7 GWh/year. Dividing the $21.25 million/year into the 67.5 million kWh/year gives 32.3c/kWh. This is the estimated cost of the electricity, and so they can make a profit from the feed-in-tariff of 38.6 c/kWh. This is, however, 20 times the cost of other electric sources.
The Future of Solar Energy
Solar energy has started to grow but until the costs are substantially reduced it will remain a very small component of the world and the U.S. energy picture. Even though the cost has been substantially reduced over the past 50 years, it still remains a very expensive energy source. The PV effect has been known since 1839 and, despite extensive research efforts since then, solar power is still very expensive. It does not seem likely that further research efforts will make the breakthroughs that will lead to the commercialization of solar power in the foreseeable future. There is a lot of solar power waiting to be harnessed if such a breakthrough could be made; however, even if there was a way to make solar power viable, it is to be expected that this cannot be done without having a significant impact on the environment.