
Coal and Clean Coal Technologies
Abstract
Coal was once the largest source of energy in the world, and it still holds second place behind oil. Moreover, in terms of the energy reserves tied up in coal, it is far and away the number one potential source in the world. Consequently, coal will likely play a major role in the future energy supply. But coal suffers from the deficit that it produces twice as much carbon dioxide as natural gas per unit of energy generated. The solution to these increased carbon emissions is clean coal technologies that capture all the undesirable waste products and sequester them underground, so that the carbon materials do not pollute the atmosphere and lead to global warming. Coal is also a reliable source of energy that can be cranked up or turned down as the demand changes.
Coal was once the largest source of energy in the world. While it no longer holds the number one position, it still maintains second place behind oil and just ahead of gas. Moreover, in terms of the energy reserves tied up in coal, it is far and away the number one source of energy reserves in the world. In fact, the U.S. state of Wyoming alone has more energy in their proved coal reserves than Saudi Arabia has in oil. Consequently, coal will likely play a major role in future energy supply.
Coal is a reliable source of energy that can be cranked up or turned down as the demand changes. Coal produces electricity at a lower cost compared to all of the other fuel sources, except natural gas. For example, 91% of Wyoming’s electricity is produced from coal, resulting in the cheapest retail electricity prices in the nation at 6.1 cents per kilowatt-hour (¢/kWh) (2009 prices). In comparison, New York gets just 10% of their electricity from coal and their average price is 15.5 ¢/kWh. On a national level, the average price of electricity is 9.8 ¢/kWh, with the residential sector paying the highest price at 11.5 ¢/kWh. Coal is a cheap and abundant source of energy; however, if it is burned without controls, it can have the most severe impact on the environment.
The environmental impact of coal is perhaps its greatest weakness or deficit. Coal produces twice as much carbon dioxide as natural gas per unit of energy generated. It can also produce a lot of other pollutants ranging from fly ash, mercury, sulfur dioxide to nitrous oxide, as well as several others. The solution to this problem is the use of clean coal technologies. These technologies capture the undesirable waste products and sequester them underground or convert them to useful products so that they do not pollute the atmosphere and lead to global warming. To ensure a positive outlook for coal, efforts need to be made to reduce its environmental impact to acceptable levels.
World Coal Production
The proved reserves, annual production, exports and reserve life of the countries with the 15 largest coal reserves in the world are shown in Table 13.1. The United States has the largest reserves at 237 billion tons (237 Gt). The total proved coal reserves in the world are 861 Gt. To put this into perspective, each ton of coal has the same energy content as three to four barrels of oil (depending on the rank and energy content of the coal and the specific gravity and energy content of the oil). 237 billion tons of coal is the energy equivalent of about 800 billion barrels of oil. Contrast that with the Saudi Arabian (who has the world’s largest oil reserves) proved oil reserves of 263 billion barrels and it becomes clear that the United States and the world have a lot of coal.
Table 13.1
Largest Coal Reserves and Producers (2010)
| Rank | Country | Reserves (Gt) | Production (Mt/year) | Reserve Life (years) | Exports (Mt/year) |
| 1 | USA | 237.30 | 984.6 | 241.0 | 54.8 |
| 2 | Russia | 157.01 | 316.9 | 495.5 | 118.7 |
| 3 | China | 114.50 | 3240.0 | 35.3 | 34.8 |
| 4 | Australia | 76.40 | 423.9 | 180.2 | 261.7 |
| 5 | India | 60.60 | 569.9 | 106.3 | 2.3 |
| 6 | Germany | 40.70 | 182.3 | 223.3 | 0.5 |
| 7 | Ukraine | 33.87 | 73.3 | 462.1 | 6.3 |
| 8 | Kazakhstan | 33.60 | 110.8 | 303.2 | 23.3 |
| 9 | South Africa | 30.16 | 253.8 | 118.8 | 66.9 |
| 10 | Colombia | 6.75 | 74.4 | 90.7 | 68.7 |
| 11 | Canada | 6.58 | 67.9 | 97.0 | 29.0 |
| 12 | Poland | 5.71 | 133.2 | 42.9 | 13.2 |
| 13 | Indonesia | 5.53 | 305.9 | 18.1 | 237.1 |
| 14 | Brazil | 4.56 | 5.5 | 832.7 | 0.0 |
| 15 | Greece | 3.02 | 68.5 | 44.1 | 0.0 |

Data Source: BP
The coal reserves shown in Table 13.1 represent only the proved reserves. There is a lot more coal in the United States and the world that remains unproven because the owners have no need to invest resources in proving up more coal. They already have plenty of coal resources to satisfy their current needs. For example, on the western half of the north slope of Alaska, there are an estimated 4 trillion tons of coal, equivalent to at least 12 trillion barrels of oil. None of that coal is ever counted in the U.S. coal reserve picture because there is no infrastructure in place to mine and transport that coal to market. The full extent of the coal has not been properly delineated with exploration probes.
The largest producer of coal in the world is China, which produces more than three times the amount of coal as the second largest producer, the United States. The coal production in China is mostly used domestically to power its rapidly expanding economy and its massive domestic demand, which in some respects is also a product of the world’s largest population. The largest exporters of coal are Australia and Indonesia, which are only the fourth and sixth largest producers in the world. The majority of coal produced in both Australia and Indonesia is exported to Asia, particularly Japan, South Korea, and China. China also exports some of its own coal production as well (but it only exports 1% of its domestic production while importing 7% of its domestic demand). The total world production of coal in 2010 was 7273 Mt/year, but only 13% (943 Mt) was exported to other countries. This means that 87% of the world’s coal production is used indigenously. This fact is likely to change in the future as a stronger world import/export trade develops.
The reader should also look at the reserve life column in Table 13.1. Most coal producers have large reserve lives, indicating there is significant potential for increased coal production around the world. The only exception to this is China and Indonesia, who have ramped up their production for different reasons. It is likely that each of them can increase their reserves with a program of exploration and delineation.
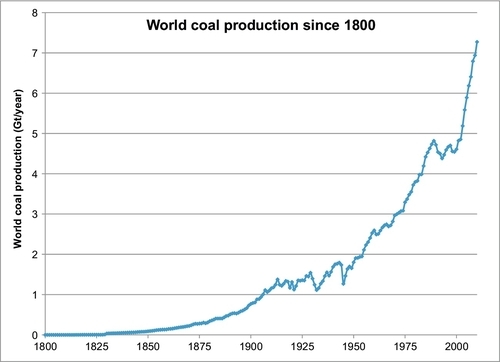
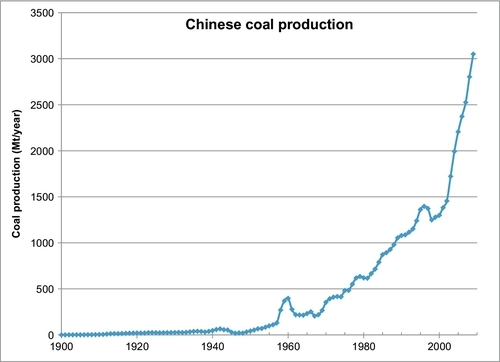
Figure 13.1 shows the history of coal production in the world since 1800. In Chapter 1, the reader learned that coal was the energy source that fueled the industrial revolution in the nineteenth century and that by 1910 it had overtaken biomass (particularly wood) as the prime energy source in the world. The data source used to plot Figure 13.1 was compiled by Professor David Rutledge of the California Institute of Technology. The total cumulative production of coal from 1800 until the present time has been 316 billion tons of coal (or 316 Gt) with current production more than 7 Gt/year. The growth rate has been steady since 1800 with two periods of reduced growth from 1920 to 1945 and more recently from 1990 to 2000. Since the turn of the twenty-first century, coal production has resumed its strong growth, primarily due to rapid expansion in China and Indonesia.
Current proved reserves in the world are 861 Gt, and combined with the 316 Gt already produced, this represents an ultimate coal recovery of 1177 Gt. It should be noted that this represents the minimum ultimate recovery because there is probably a lot more coal that can be proved up if the need arises.
With so much energy tied up in coal reserves, you would expect that coal has many years of production of the current reserves before it peaks and begins to decline. Professor Rutledge (whose data set is plotted in Figure 13.1) published an analysis of his data in 2010 using probit and logit transforms to determine that the total expected cumulative coal production will only be 680 Gt, leaving only 364 Gt of reserves still to be produced. He did not calculate the date for the peak production, but he did estimate that 90% of the world’s coal reserves would be depleted by 2070, leaving it with a less important future. Essentially, Professor Rutledge is saying that he does not believe that the reserves published by the world’s current coal producers will ever be produced. He believes that the current estimate of future production of at least 861 Gt (remember this is only proved reserves) is overestimated.
To back up his claim, Rutledge points to an estimate of future British coal production made by geologist Edward Hull in 1861 who calculated “an available quantity of 79,843 million long tons of coal (81 Gt), which if divided by 72 million long tons (the quantity produced by the United Kingdom in the year 1859), would last for no less than 1100 years.” For his assessment, Hull included seams with a thickness of 2 ft. or more, down to a depth of 4000 ft. Hull’s estimates were later increased by the UK Royal Commission on Coal Supplies, which in 1871 counted seams down to a thickness of one foot and arrived at 149 Gt of minable coal. Production in the United Kingdom actually peaked in 1913 at 292 Mt/year. British coal mines have mostly been depleted and so far have produced 27 Gt of coal, much less than Hull’s 81 Gt or the Royal Commission’s 149 Gt. In retrospect, both Hull’s numbers and the Royal Commission’s numbers were not good estimates of future UK coal production because it is not economic to mine one-foot or two-foot coal seams down to a depth of 4000 ft.
A separate analysis of future world coal production was made by Patzek and Croft in 2010. These researchers concluded that,
The global peak of coal production from existing coalfields is predicted to occur close to the year 2011. The peak coal production rate is 160 EJ/year, and the peak carbon emissions from coal burning are 4.0 Gt C (15 Gt CO2) per year. After 2011, the production rates of coal and CO2 decline, reaching 1990 levels by the year 2037, and reaching 50% of the peak value in the year 2047. It is unlikely that future mines will reverse the trend predicted in this business-as-usual scenario. (Patzek and Croft, 2010)
These two forecasts are quite surprising given the large reserves of energy tied up in coal. Consequently, it is necessary in this chapter as well as Appendix B to examine the world coal production data of Rutledge using the Hubbert theory (shown in Appendix B) to see what it forecasts.
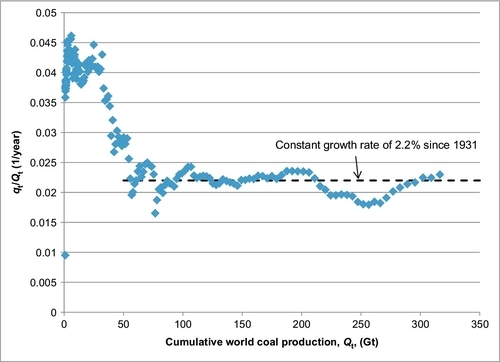
In Figure 13.2, the coal production rate (shown in Figure 13.1) is divided by the cumulative coal production and the result is plotted versus the cumulative coal production (for the mathematically minded, the plot is qt/Qt V Qt). This plot shows that since 1931 the growth rate in coal production has been fairly constant at 2.2%. This plot is also a key plot used in Hubbert’s model for predicting future production. The fact that the growth rate has been constant for many years suggests that the coal production rate is not about to peak and is likely to continue with this growth rate for many more years. This is discussed in more detail in Appendix B.
In Appendix B, the nonlinear regression method is also used to fit Rutledge’s data to Hubbert’s model and obtain the forecast shown in Figure 13.3. The red line in this chart is a plot of the Hubbert model and the blue points are the Rutledge data points. The parameters obtained from nonlinear regression and used to plot Hubbert’s model are:
![]()
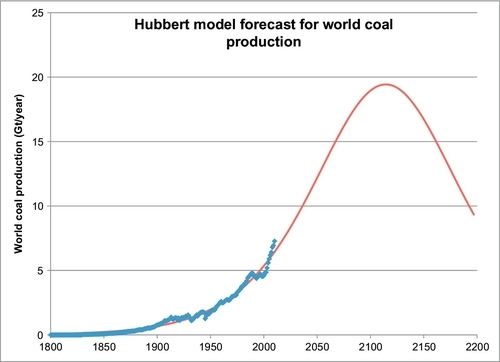
The values for the parameters a and b are not highly important, but are merely shown here for completeness. The value for Qmax, is the ultimate cumulative coal production. Its value, 3529 Gt, is well in excess of the 1177 Gt estimated above for the current proved reserves plus the past cumulative production. It is also much more than Rutledge’s estimate of 680 Gt. It is, however, not an unreasonable number given that there has been no real effort to establish just how much coal exists in the world and what can be economically produced. It was previously mentioned that 4000 Gt of coal is known to exist on the north slope of Alaska. Russia also has the Tungus and the Lena coal deposits, which are similarly large unproven and undeveloped coal deposits in central Siberia. There could also be other similarly large coal deposits located elsewhere in the world.
The timing for the peak coal production is calculated in Appendix B to occur in the year 2115. This estimate has an accuracy limited by the model fit of the data, which is about 15%. The peak could realistically occur anywhere from 2070 to 2160.
In Chapter 5, it was explained that when making forecasts for world production of any resource, such as coal, too much faith should not be placed in the backside of the curve. Once you hit the peak, or as you approach the peak, the resulting shortages will drive up the price of coal and change the dynamics of the forecast.
If a more conservative approach is taken, you could easily use the current proved reserves number (861 Gt) and the recent sharp increase in world coal production to make a forecast based on those numbers. This results in a peak world production of 17 Gt/year with the peak occurring in 2044. This is probably not as realistic a forecast as the one in Figure 13.3.
U.S. Coal Production
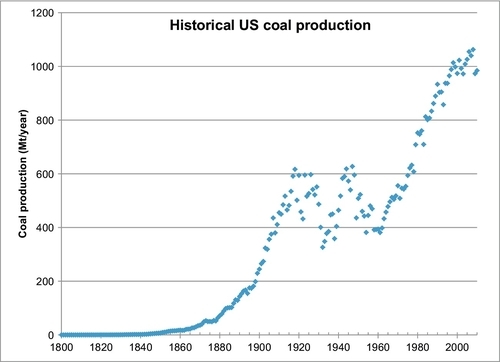
The United States is the second largest coal producer in the world and also has the largest coal reserves at 237.5 billion tons (Gt); however, it was not always that way. From 1880 until 1918, the United States experienced rapid expansion of the coal mining industry. From 1918 until 1960, the coal industry was in the doldrums, with periods of decline and recovery followed by more decline. Most of the production came from underground mines in the Appalachian regions of Kentucky and West Virginia. Life in these underground mines was tough and many miners contracted health problems such as black lung and other respiratory diseases, as well as lung cancer.
Modern underground mines have been made much safer by better ventilation and very stringent Occupational Safety and Health Administration (OSHA) and Mine Safety and Health Administration (MSHA) regulations. Around 1970, the Clean Air Act introduced much tougher air emission standards which led to the development of surface mines in the western United States, particularly in the Powder River Basin of Wyoming. The Powder River Basin coal is a lower rank (sub-bituminous) coal that has higher moisture content, but also much lower sulfur content. The lower rank means that it contains less energy than anthracite or bituminous coals, but it also contains much less sulfur. Consequently, it is much easier to comply with the Clean Air Act with Powder River Basin coal than with the eastern U.S. coals. Today, most of the U.S. production comes from the Powder River Basin, where massive open cut mines easily extract huge amounts of coal. The top 10 coal-producing states in the United States are shown in Table 13.2. The largest coal-producing state is Wyoming, which produces more coal than the next 6 states combined.
Table 13.2
Top Coal Producing States in the United States
| 1 | Wyoming | 391,027 |
| 2 | West Virginia | 124,378 |
| 3 | Kentucky | 97,359 |
| 4 | Pennsylvania | 52,589 |
| 5 | Montana | 35,815 |
| 6 | Indiana | 32,340 |
| 7 | Texas | 31,830 |
| 8 | Illinois | 30,610 |
| 9 | North Dakota | 27,161 |
| 10 | Colorado | 25,639 |
Based on 2009 Production in Mega-Tons (Mt).
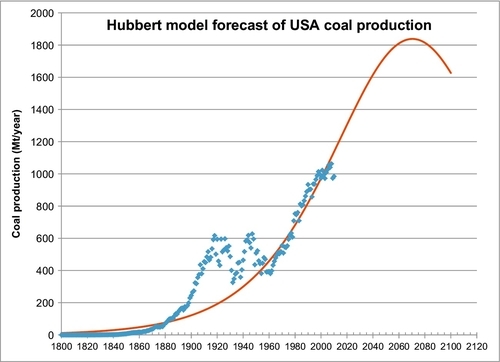
The historical U.S. production is shown in Figure 13.4. Since 1997, it has been relatively constant at approximately 1 billion tons per year (1 Gt/year).
To forecast future coal production for the United States, the familiar Hubbert model is used and shown in Figure 13.5. The only way to fit the data was to use the same nonlinear regression technique that was applied to the world coal production data; however, Qmax is fixed at 308 Gt. This number was obtained by adding the current proved reserves of 237.5 Gt plus the total cumulative production to date of 70.5 Gt. The regression technique determined the other two parameters of the Hubbert model to be a = 651.4 and b = 0.02387 per year. Figure 13.5 is a forecast of the future production of the current proved reserves (237.5 Gt), but this production could be increased if the proved reserves are increased. The forecast peak rate is 1.84 Gt/year, which occurs in 2070.
Australian Coal Production
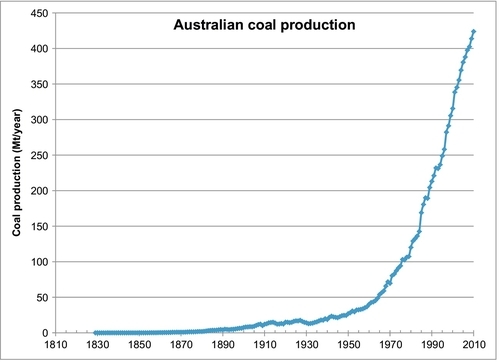
Australia is the world’s largest exporter of coal, and it is useful to look at their production growth. Figure 13.6 shows that growth was relatively slow until about 1950 when they were producing 27 Mt/year. Production has grown rapidly since then, and in 2010, they produced 424 Mt of coal. The majority of this coal production comes from the Bowen Basin in Queensland. This coal is mostly shipped to Asia, particularly Japan, Taiwan, and South Korea, whose economies are powered by Australian coal. 75% of Australian coal production is exported and the other 25% is used to generate electricity and to make steel. 85% of Australia’s electricity is generated from their indigenous coal production.
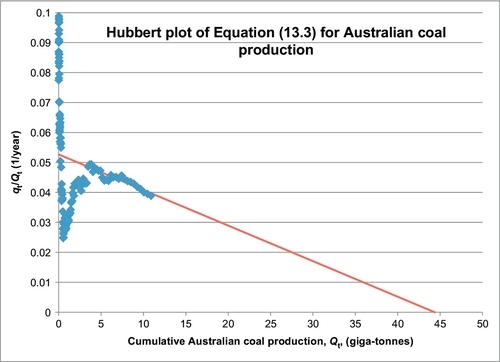
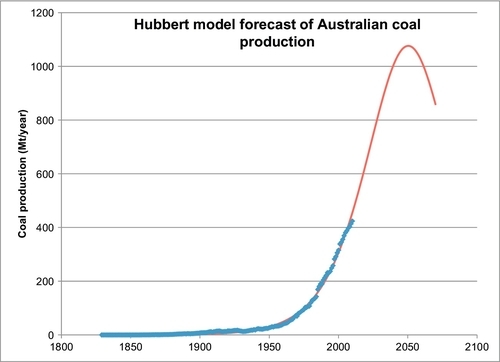
The Hubbert model is employed to forecast Australia’s future production in the same manner as was done for the world and U.S. coal production. There is one exception: there is first an attempt to forecast their ultimate production, Qmax, using the plot of Equation B.3 of Appendix B. This plot is shown in Figure 13.7, which shows that the recent production data can be extrapolated to an ultimate cumulative of 44.4 Gt of coal. This cannot be correct because their current proved reserves plus their historical production add up to 87.3 Gt of coal. The extrapolation in Figure 13.7 is probably unreliable because the Hubbert model trend has not been properly established yet. Accepting the 87.3 Gt value for Qmax, and applying the same nonlinear regression technique that was applied to the world coal production data, a forecast for Australian coal production was obtained and is shown in Figure 13.8. The regression technique determined the other two parameters to be a = 57991 and b = 0.05268 per year. Figure 13.8 is essentially a forecast of the future production of their current proved reserves (76.4 Gt). The forecast peak rate is 1.07 Gt/year, which occurs in 2050.
Chinese Coal Production
China overtook the United States as the world’s largest coal producer in 1985, as China was beginning a vast economic expansion. Coal was its fuel of choice to power this economic miracle. It now produces more than three times as much coal as the United States and the expansion continues unabated. It has, however, less than half the proved reserves of the United States. If its coal mining is to continue its rapid expansion, new reserves will have to be found quickly. Its coal production history is shown in Figure 13.9, and the Hubbert model forecast of its future production is shown in Figure 13.10. The parameters used in the forecast were:
![]()
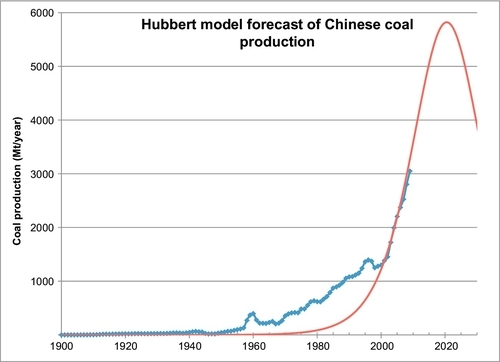
168.68 Gt represents its ultimate cumulative production, made up of its cumulative production to date (54.18 Gt) plus its published proved reserves (114.5 Gt). The other two parameters (a and b) were determined by fitting its recent rapid growth to the Hubbert model. The parameter b shows that its production growth has been 13.8% per year, which is also a growth rate of 6% of its cumulative production. If this rapid production growth continues, it will peak at 5.8 Gt/year in 2021. From there, it will begin a rapid decline and will have to switch to other fuel sources or ramp up its coal imports to similarly high levels. If there are people reading this book who would like to become very rich, mining coal, then exporting it to China could be one way to do it.
China is already the world’s largest coal importer; however, after 2021, its local production will have peaked and, therefore, it will be importing even larger quantities of coal. If you expect that rising coal prices will generate new reserves for China, remember that Australian coal production will not peak until 2050, American coal production will not peak until 2070 and world coal production will not peak until 2115. It will be much cheaper for China to begin rapidly increasing its coal imports soon to make up for the looming shortfall in its production.
Although China does export 1% of its coal production to its neighbors, it is already importing about 7% of its coal consumption (200 Mt/year) primarily from Australia and Indonesia. This level of dependency on coal imports is rising rapidly. These two largest coal exporters, Australia and Indonesia, had supply disruptions in 2010 that led to blackouts throughout China and record imports from nontraditional suppliers. Queensland, the main coal-producing state in Australia, experienced massive floods that largely halted Australian coal exports for months, and Indonesia had heavy rains, limiting its production as well. Following these weather disruptions, Northeast China experienced a bitterly cold winter, demanding historically high levels of coal to heat millions of homes and power hundreds of thousands of factories. As a result, there was high demand for coal on the international market. Since 2010, the highest prices paid internationally for coal have been in Asia, particularly China. Even though China is the world’s largest coal producer and it is only importing 7% of its domestic coal demand, in 2010 it overtook Japan as the world’s largest coal importer. China will be the primary driver of an expanding coal import/export market.
The United States is currently exporting 1–2 Mt/year to China, and there is a proposal to build two further ports in Washington aimed at exporting an additional 100 Mt/year of Powder River Basin coal to China. This will likely become a common occurrence as the United States and other countries compete for the expanding Chinese market.
Health, Safety, and Environmental Issues in Coal Use
Coal mining in underground mines has long been recognized as being arduous work, liable to injury and disease. Consequently, stringent regulations have been implemented that require dust suppression, ventilation, and respiratory protective equipment for modern underground mines. Nevertheless, even today there are still increased health and safety hazards. Coal dust has been a serious problem in mining, causing coal workers’ pneumoconiosis, or “black lung disease,” and chronic obstructive pulmonary disease. While this has been largely eradicated, diesel fuel particulate exposures still occur in underground mines because of diesel-powered mobile equipment that is used primarily for drilling and hauling coal. Diesel particulates pose a risk of lung cancer. Coal miners are also exposed to safety hazards that include explosions and cave-ins, as well as the usual dangers associated with the heavy machinery that is used today.
Environmentally, the burning of coal has been responsible for many environmental hazards. If burned in an uncontrolled environment, coal puts out many air pollutants ranging from sulfur dioxide to nitrous oxide, mercury, arsenic, and coal ash. These emissions are now strongly regulated to prevent them from being emitted to the atmosphere. Coal also emits twice as much carbon dioxide per unit of energy produced than does natural gas and 25% more than oil. This emission is now recognized as a potential cause of global warming, and consequently regulations on carbon dioxide emissions are likely to be implemented in the future. As of 2011, this has not yet been done but USA has recently restricted the carbon dioxide emissions from new coal fired power plants, which caused the planned construction of several new coal fired power plants to be cancelled.
Clean Coal Technologies
When coal is burned, the carbon in the coal becomes carbon dioxide; the sulfur in the coal becomes sulfur dioxide; and the nitrogen in the coal, and a little of the nitrogen in the air used to burn the coal, become various oxides of nitrogen. Normally, these chemicals are all released into the atmosphere. The solution to this pollution is to capture these undesirable emissions and sequester them. The collection of technologies that do this is called clean coal technologies. Up until now, the approach to solving these problems has been to capture the emissions after they have been generated. Electrostatic precipitators capture the coal ash and soot particles, while scrubbers are used to capture the sulfur and nitrogen compounds. A better approach is to gasify the coal first to generate syngas (a mixture of hydrogen and carbon monoxide) and then separate out the gaseous components. They can then be used to not only generate electricity, but also to make liquid fuels, petrochemicals and fertilizers, among other things.
All clean coal technologies begin with the coal gasification process. In a coal gasifier, the coal is reacted with steam and oxygen to produce syngas products (hydrogen and carbon monoxide) as well as small amounts of methane and carbon dioxide. There are six principal reactions that take place at relatively high temperatures (2000-3000 °F):
![]()
![]()
![]()
![]()
![]()
![]()
The main gasification reaction between coal and steam is an endothermic reaction. This means that for every kilo-mole of reactant or product, 131 MJ/kmol of energy must be input to the reacting system. This energy comes from the oxidation reactions, which is why it is necessary to input oxygen into the reacting chamber (the gasifier). The oxidation reactions are exothermic; when the coal reacts with the oxygen, energy is released.
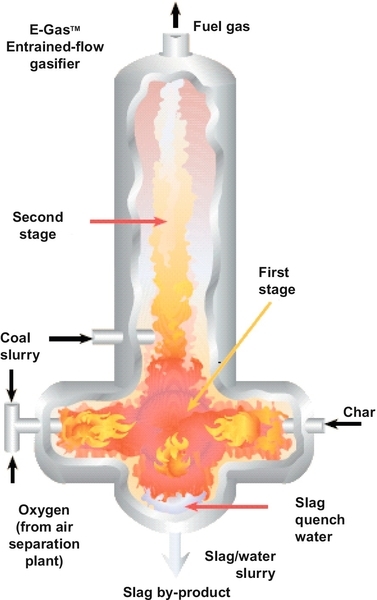
There are many commercial gasifiers available, and Figure 13.11 is one example that is produced and marketed by ConocoPhillips. In this gasifier, coal is fed into two left-hand ports as coal slurry, a mixture of finely ground coal and water. Oxygen is mixed in with the coal slurry before being pumped into the gasifier. This gasifier operates at 2500 °F. The reaction chamber is kept at that high temperature by the exothermic oxidation reactions. If the temperature falls below 2500 °F, the oxygen feed rate is increased, and vice versa. The water content in the feed has the opposite effect. The higher the water content, the lower the chamber temperature, and vice versa. The ash in the coal does not react, but the temperature is high enough to melt the ash and it flows to the bottom of the reacting chamber. It is then resolidified with quenching water and it falls out of the bottom of the chamber as slag. Any unreacted coal is separated from the product gas and returned to the right-hand port of the gasifier in the form of char.
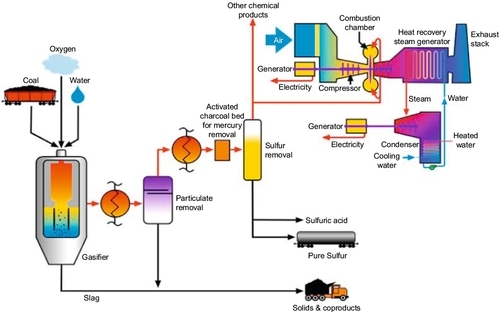
The most efficient way to make electricity from syngas is by using an integrated gasification combined cycle (IGCC) plant, as shown in Figure 13.12. After the syngas exits the gasifier, it undergoes some cleaning processes, after which it is sent to a gas turbine where it is burned to generate electricity. The hot exhaust gas from the gas turbine is also used to heat water into steam, which is also used to generate more electricity in a steam turbine. It is called a combined cycle process because electricity is generated in both the gas turbine cycle and the steam turbine cycle. It is also possible to capture all the carbon dioxide from the exhaust gas using an amine capture plant (see Figure 4.12).
An alternative for capturing the carbon dioxide is to burn the syngas in a pure oxygen environment in the gas turbine, which will then produce an exhaust gas that is mainly carbon dioxide and water vapor. The water vapor can be condensed out of the carbon dioxide by cooling the exhaust gas to produce a carbon dioxide stream that is ready for use or sequestration. Using this type of technology, it is possible to construct a coal-fired power plant that has zero emissions. All of the potential pollutants are captured and either used in other ways or sequestered underground. Figure 13.13 shows a schematic of a zero-emissions IGCC plant that was devised at the University of Wyoming by me and my colleagues (John Ackerman, David Bell, and Morris Argyle).
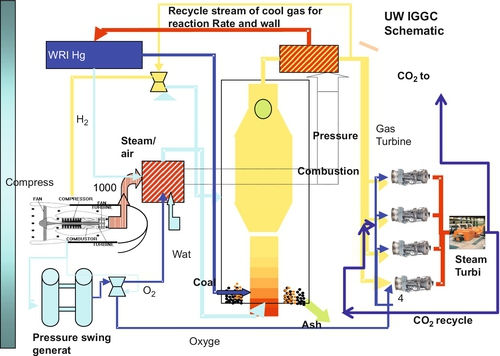
The zero-emissions IGCC plant shown in Figure 13.13 is a particularly simple design that is much cheaper to build. In this process, the mercury in the coal is removed at the beginning of the process using a simple heating method that was developed at the Western Research Institute. This design also avoids expensive syngas treatments because no separation of syngas compounds is required between the gasifier and the turbine. No cooling or treatment, other than particulates removal, is required. The exhaust is primarily CO2 and water. The water is removed by cooling and condensation. A compressor is used to produce compressed air for the process flow streams: the air cycle machines that are used to boost O2/H2O pressure to the gasifier and the pressure swing O2 generators. The gas turbines not only drive the electric generation units, but the hot exhaust is used to produce heat for steam generation that is used in the steam turbine. The CO2 from the exhaust is recycled as carrier gas in the gas turbines, which improves the thermodynamic efficiency of the process.
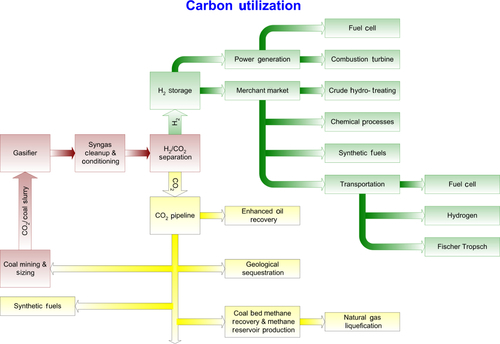
The U.S. Government had proposed to investigate an upgraded IGCC design called FutureGen, whose process flowsheet is shown in Figure 13.14. In the FutureGen project, the carbon monoxide in the syngas would be converted into carbon dioxide using the water gas shift reaction. This reaction produces more hydrogen; the result is that extra hydrogen is generated, leaving the product stream as hydrogen and carbon dioxide. The carbon dioxide is then separated from the hydrogen to produce both a pure hydrogen stream and a pure carbon dioxide stream. The hydrogen is burned in the gas turbine to produce electricity (Figure 13.15). The advantage of this system is that the pure hydrogen stream could be used for other hydrogen-based applications, as shown in Figure 13.16. Chapter 15 will discuss hydrogen applications in more detail. The carbon dioxide is sent for sequestration or to be used for enhanced oil and gas recovery applications. This is also depicted in Figure 13.16.
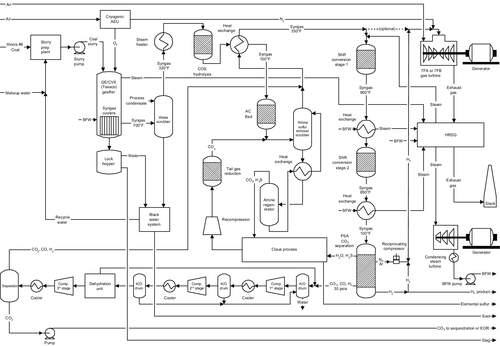
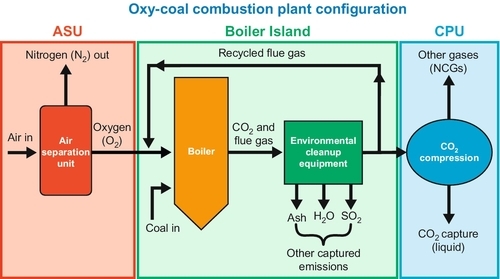
After the FutureGen project depicted in Figure 13.14 was abandoned, a FutureGen 2.0 was redesigned in 2011 as a purely carbon capture and storage project. In this project, a $1.3 billion retrofit of an existing power plant is proposed, adding oxy-combustion to the plant to produce a mostly pure CO2 exhaust stream which is sequestered underground. The modified process schematic diagram for FutureGen 2.0 is shown in Figure 13.15. This project had not been approved at the time of writing.
Coal to Liquids Technologies
Coal can be made into liquid fuels, such as gasoline diesel and jet fuel, quite readily. This has been done many times in the past and is likely to occur again in the future. Technology has come a long way since the first coal-derived liquid fuel (a synthetic crude oil) was produced through direct liquefaction in the early 1900s.
In 1925, Franz Fischer and Hans Tropsch used an indirect liquefaction process, which still bears their name, to produce suitable transportation fuels such as diesel and gasoline. Germany had 25 liquefaction plants that, at their peak in 1944, produced 125,000 barrels of fuel per day and provided 90% of the nation’s fuel needs. During World War II when Germany was cut off from its oil supplies, it ramped up the production of liquid fuels from coal to provide fuel for the war effort. When South Africa operated under its apartheid policy from 1948 to 1994, it became isolated from the world economy and no one would export oil to it. It also began to make liquid fuels from coal. As a consequence of that era, the South African company, SASOL, is now the world leader in Coal to Liquids (CTL) technology. SASOL developed its own commercial process to produce transportation fuels (gasoline and diesel) using syngas produced by the gasification of coal. SASOL has produced more than 750 million barrels of synthetic fuels from coal since 1980. It continues to do so today, although it now imports oil and oil products.
It is cheaper to convert natural gas to liquid fuels (see Chapter 6), but the world has a lot more coal than natural gas. As the world begins to run short of oil, coal will be converted into liquid fuels in ever increasing quantities.
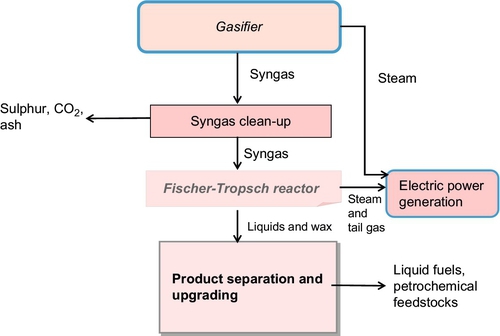
Coal can be converted into liquid fuel using several liquefaction processes which can be divided into two general categories. The first category, indirect liquefaction, is a multistep procedure that first requires the gasification of coal to produce syngas. This process is shown schematically in Figure 13.17. The syngas from the gasifier is converted to liquid fuel via two methods: the Fischer-Tropsch process or the Mobil process. In the Fischer-Tropsch process, which is much more common, the syngas is first cleansed of impurities and subjected to further chemical refinement to produce a sulfur-free diesel or gasoline. The initial syngas can be derived from coal alone or from a coal/biomass mixture. The process is the same when biomass is included, but the amount of CO2 emitted during the process decreases as the proportion of biomass increases. In the less-common Mobil process, the syngas can be converted to methanol, which is subsequently converted to gasoline via a dehydration sequence. Indirect liquefaction of coal using the Fischer-Tropsch process produces a significant amount of CO2 that is removed from the fuel as a necessary step during the final stages of the process. This CO2 must then be sequestered.
The second category, direct liquefaction, requires creating a chemical reaction of the coal at high temperatures with hydrogen gas using a catalyst to produce a liquid fuel. Direct liquefaction usually produces lower-quality liquid fuel that is more expensive to upgrade to make it comply with U.S. fuel standards. Although the process was used in Germany and is being used in China, it is not a viable option for meeting the U.S. liquid fuel requirements.
In terms of economics, coal-based liquid fuel becomes viable when the price of oil exceeds $50 per barrel, which is the case today. To fund a CTL plant, this price needs some guarantee or the risk becomes too high. This is because of high front-end expenditures—a 10,000 barrel-a-day plant could cost $750 million or more to construct.
Not included in the above estimate is the cost of sequestering the captured CO2, which would increase the price of the end product by a projected $5 per barrel. The imposition of a strict carbon cap and trade regime would also raise the cost of fuel produced with CTL technology because of the CO2 emissions associated with it. While there is significant uncertainty, a recent study by Rand Corporation estimated that CTL production plus carbon storage could produce fuel at a cost of anywhere from $1.40 to $2.20 per gallon or more by 2025. With current oil prices exceeding $80 per barrel, CTL is currently an economically attractive alternative, and there is a likelihood of CTL plants being built in the near future.
Proponents of using coal-based liquid fuel for the transportation industry say that it would help the United States achieve energy independence. Currently, the United States consumes nearly 20 million barrels of liquid fuel for transportation each day and imports almost 40% of its feed stocks. The 237 billion tons of proved recoverable coal that the country has in its reserves could be used to replace some of this imported oil. If the United States doubled its current coal production to 5 million tons per day and diverted the extra 2.5 million tons per day to make transportation fuels, this would displace about 4.5 million barrels of imported oil per day. Other benefits of CTL fuel cited by proponents are that it can be used to make gasoline, diesel, and jet fuel. Plants designed for indirect CTL processes can also be easily converted to hydrogen fuel cell production plants if fuel cell technology becomes more viable (see Chapter 15).
Opponents of CTL technology point out that the synthetic fuel derived from coal produces additional CO2 as a byproduct. If the CO2 removed from the fuel during the refinement process is not sequestered, the quantity of CO2 released by extracting, refining and burning coal-based liquid fuel is 25% more than the amount emitted by conventional oil. Even with carbon sequestration, the emissions benefits over conventional fuel appear negligible at best, though there is significant debate over the true impact. While some studies have found CTL produces greater emissions than conventional fuel, even with sequestration, the recent Rand study found no difference between CTL and petroleum emissions. A Department of Energy study found that CTL emissions with sequestration were actually 5-12% lower.
Underground Coal Gasification
The coal gasification process can be conducted underground, and this process has an interesting and varied history. In the gasification process, the coal is reacted with steam and oxygen to produce syngas. If this is done with the coal remaining in-situ, it has many cost advantages. First, the coal does not have to be mined. Second, the gasification equipment does not have to be built. Finally, it can be applied to deep coal seams that are uneconomic to mine. Consequently, underground coal gasification (UCG) is cheaper than gasifying mined coal.
Although UCG was first proposed by a British engineer named William Siemens in 1868, much of the process development occurred in the Soviet Union in the 1930s. This was partly due to Russian chemist Dmitri Mendeleev who had heard Siemens’ proposal in London in 1868 and further developed the idea over the next 30 years. Mendeleev was a very famous chemist who, among other things, invented the periodic table of the elements. Others were also working on developing Siemens’ idea and in 1910 patents on UCG were granted to an American engineer named Anson Betts for “a method of using unmined coal.” The first experimental work on UCG was planned to start in 1912, in Durham, England, under the leadership of 1904 Nobel Chemistry Prize winner William Ramsay. His project was to inject air and steam into an injection well and produce syngas out of a production well. He was unable to commence the project before the beginning of World War I and the project was abandoned after that.
Vladimir Lenin became familiar with Mendeleev’s ideas, and during Russia’s communist revolution in 1917, he promised the coal workers that he would develop the UCG process so that they would not have to venture underground to mine coal again. This promise was never totally fulfilled, but a considerable amount of research was conducted by the Soviet Union to make the process feasible and several projects were implemented there in the 1930s. Modern health and safety regulations in many nations, however, had greatly improved working conditions in underground mines, and the Soviet Union continued to operate these underground mines despite Lenin’s earlier promises.
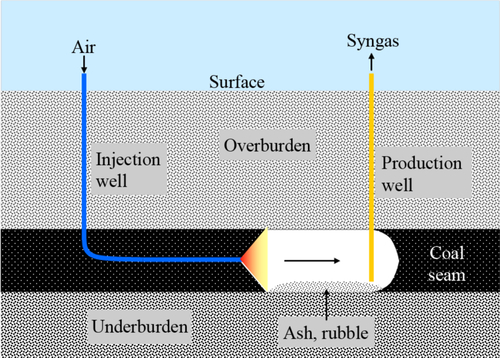
The UCG process is illustrated in Figure 13.18. An injection well is drilled into the coal seam and preferably horizontally along the coal seam. This intersects a vertical production well some distance away. Oxygen and steam are injected into the first well and initiate the coal gasification process. The resulting syngas is produced in the second well.
Besides the Soviet Union, this process has been tested in China at Ulanchap, in Australia at Chinchilla and Kingaroy, and in Wyoming at Hoe Creek. Tests at Hoe Creek, in northeastern Wyoming, showed that groundwater contamination is a potential problem. In an above-ground gasifier, the production of coal tars can be avoided by operating at sufficiently high temperatures. In UCG, regardless of the cavity temperature, a temperature gradient will form at the wall and coal will pyrolyze to form coal tar, a complex mixture of hydrocarbons that is potentially carcinogenic. Part of the problem at Hoe Creek was that the cavity pressure was too high, which forced some of the gas and tar into the surrounding formation. The test was conducted in a shallow seam, and when the cavity roof collapsed, water from a shallow freshwater aquifer mixed with the tar-contaminated coal and rock. Water contamination issues can be reduced by gasifying at a pressure less than the hydrostatic pressure. Water will tend to flow into the gasification cavity, flushing coal tars into the gasification zone and towards the production well. This strategy has been successfully demonstrated at Linc Energy’s Chinchilla test in Australia. Groundwater contamination, however, appears to have killed Cougar Energy’s UCG pilot project at Kingaroy, Australia. The state of Queensland’s environmental authority shut it down in July 2010 after the project’s gas-production well ruptured and Cougar reported trace levels of benzene and toluene in groundwater at the site. Cougar contested the shutdown and issued a statement in July 2011 asserting that “there have been no concerns with water quality in local water bores.”
Another problem with UCG is that the coal seam roof can collapse as coal is removed. This is also a potential problem in underground mining, but some control techniques such as roof bolting, are not available when there are no miners underground. If uncontrolled, roof collapse could lead to a loss of gas seal and provide a path for the mixing of contaminated and fresh water. Roof collapse can be controlled, in part, by choosing coal seams with sufficient overburden strength and thickness. In the conventional room and pillar mining technique, pillars of unmined coal are left to help support the roof. In UCG, the equivalent technique is to limit the cavity cross-sectional area to limit the unsupported roof span and to space the cavities so that walls remaining between the cavities support the roof. If the UCG seam is much deeper than an overlying freshwater aquifer, there is less likelihood that a roof collapse will lead to significant intermixing of the fresh and contaminated water.
UCG is likely to become more widespread in the future because it has the potential to gasify coal more cheaply and to access unminable coal seams.
The Future of Coal
There is considerable opposition to expanded coal use because it is perceived as a dirty fuel that has caused a lot of air pollution in the past. Nevertheless, coal production is increasing anyway and is likely to continue to increase. This is because the largest energy reserves in the world are tied up in coal resources. As the world needs and demands ever increasing energy supplies, coal reserves will be developed and burned in some form. The fact that coal can be converted into liquid and gaseous fuels and petrochemicals and fertilizers makes it a very useful energy resource, and it will be utilized. Moreover, the development of clean coal technologies is likely to dampen opposition to coal use.
China is currently the world’s largest producer and consumer of coal, and its production is likely to peak in the next 10 years. As its production peaks, its coal imports will rise rapidly and drive a thriving international trade in coal. As well as being the world’s largest producer and consumer of coal, China is also the world’s largest importer of coal. Their current coal imports, however, are miniscule compared to their production and consumption.
China is currently importing 200 million tons of coal per year, but it is currently consuming 3.5 billion tons per year. By 2030, it could be importing as much as 5 billion tons per year at a cost of $500 billion/year. The immediate beneficiaries of this trade would be their closest current suppliers, Australia and Indonesia. The largest coal reserves though are in the United States, and it is likely that the United States will also be a significant supplier to the world coal trade, especially China. Given that the United States has a large trade deficit with China, supplying coal to the large potential demand in China makes sound economic sense. Russia also has large proven coal reserves and even larger unproven coal resources and, given its proximity to China, Russia will also be a likely participant in a booming coal trade.
The United States also has the potential to use its large coal resources to decrease its crippling oil import bill. Doubling its coal production to 5 million tons per day (1.825 billion tons per year) and diverting the extra 2.5 million tons per day to make transportation fuels would displace about 4.5 million barrels of imported oil per day.