
Chapter 55. Advanced Analysis Tools
Writing code is just one part of the developer life. There are so many other aspects to consider in producing high-quality applications. For example, if you produce reusable class libraries, you must ensure that your code is compliant with Common Language Specification, and this requires deep analysis. Another key aspect is performance. If you produce a great application with the most desired functionalities but with poor performance, perhaps your customer will prefer a faster and less-consuming application even if this has a minor number of features. Continuing from its predecessors, Visual Studio 2012 offers a number of integrated tools for analyzing code and performance to improve your applications’ quality. In this chapter, you learn how to use Visual Studio 2012’s integrated analysis tools for writing better applications.
Visual Studio Supported Editions
Analysis tools are available only in some Visual Studio 2012 editions. To complete tasks explained in this chapter, you need at least Visual Studio 2012 Premium or Visual Studio 2012 Ultimate (which is required for IntelliTrace).
Introducing Analysis Tools
Visual Studio 2012 offers the following analysis tools, which can help you produce high-quality applications:
• Code Analysis—analyzes code for compliance with Microsoft coding rules.
• Code Metrics—returns statistic results and analyzes code maintainability according to specific indexes.
• Code Clone Detection—a new tool that helps you discover code duplicates in certain development scenarios.
• Profiler—analyzes application performance and suggests solutions for problems.
• IntelliTrace—formerly known as Historical Debugger, which keeps track of every single event and exceptions that happen during the entire application’s lifetime.
In this chapter, you learn to use the listed tools for improving quality in your code.
Performing Code Analysis
Earlier in this book, you learned about Common Language Specification (CLS). These are a set of common rules and guidelines about writing code that can be shared across different .NET languages favoring interoperability and is considered well designed for the .NET Framework. In some cases, it can be hard to ensure all your code is CLS-compliant, especially when you have large projects with tons of lines of code. To help you write better and CLS-compliant code, Microsoft integrated directly inside Visual Studio 2012 a code analysis tool that analyzes compiled assemblies for non-CLS compliant code and reports suggestions and solutions for solving errors. The good news is that in Visual Studio 2012 the code analysis tool is available for Professional, Premium, and Ultimate editions (in Visual Studio 2010 it was available only in the Ultimate edition and for other editions you had to download an external tool called FxCop). You can also customize the code analysis process by setting specific rules. Before examining available rules, it is a good idea to create a simple project for demonstrating how code analysis works by creating a new class library project in Visual Basic 2012. When the code editor is ready, rename the Class1 file to HelperClass and write the code shown in Listing 55.1, which attempts defining a CLS-compliant class, but makes several violations to the Microsoft rules, to which solutions are given later in this section.
Listing 55.1. Writing a Simple Non-CLS-Compliant Class Library
<CLSCompliant(True)>
Public Class HelperClass
Private CustomField As String
Public Property customResult As String
'Just a demo function
Public Function doubleSum(ByVal FirstValue As Double,
ByVal SecondValue As Double) As Double
Return FirstValue + SecondValue * 2
End Function
End Class
For rules, it is worth mentioning that Microsoft divides guidelines in writing code into the rules summarized in Table 55.1.
Table 55.1. Microsoft Code Analysis Rules
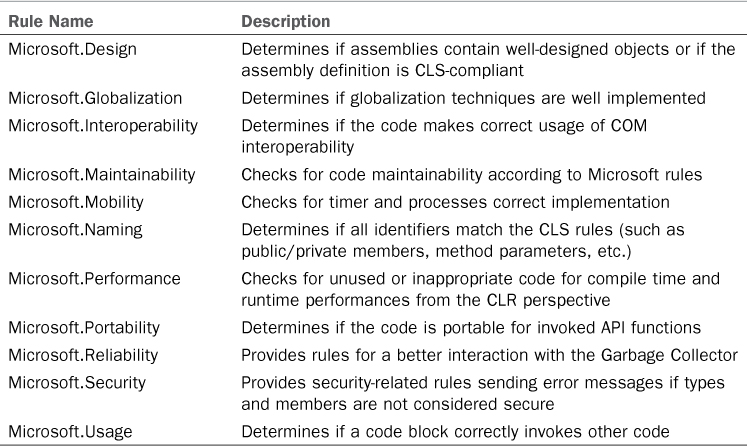
Performing code analysis does not require all the mentioned rules to be checked. You can specify only a subset of preferred rules or specify the complete set. To specify the rules sets involved in the code analysis, follow these steps:
1. Open My Project and click the Code Analysis tab. Figure 55.1 shows the designer.
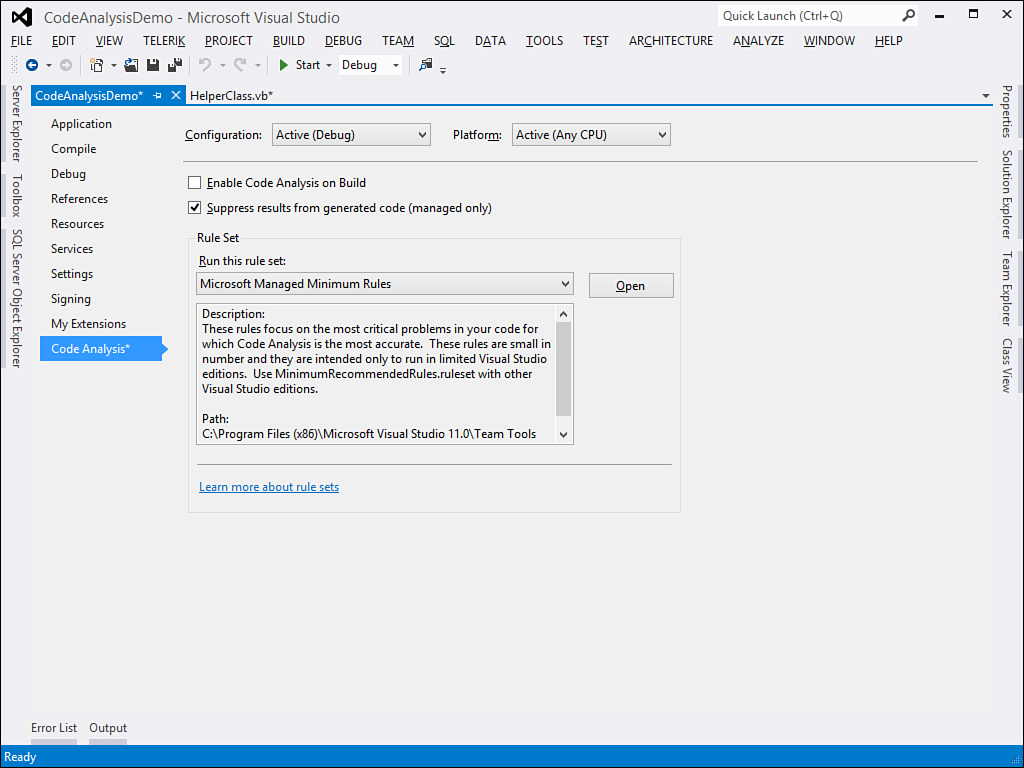
Figure 55.1. The Code Analysis designer.
2. Expand the Run this rule set combo box. You get a list of available rules sets with an accurate description for each set. By default, the offered set of rules is Microsoft Managed Minimum Rules. Replace it by selecting Microsoft All Rules that includes all sets listed in Table 55.1 and that is the most accurate. To get detailed information on each rule set, click Open. Figure 55.2 shows how you can browse rules available in the selected set, getting summary information for each rule, and specifying how you want to get help on violations (for instance, online or offline).
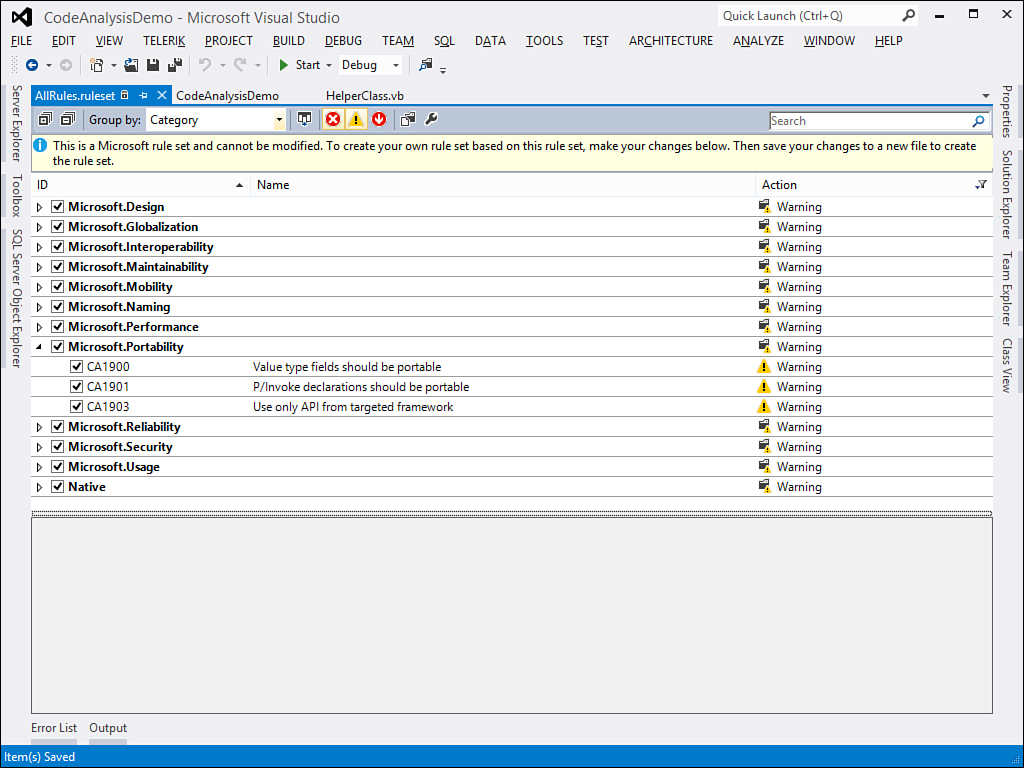
Figure 55.2. Browsing rules sets.
3. Select the Analyze, Run code analysis command and wait for a few seconds until the building and code analysis process is completed. When ready, Visual Studio shows a report listing all violations to coding rules encountered in the project. This report is shown in Figure 55.3. Notice that in Visual Studio 2012 the list of violations is shown inside a tool window called Code Analysis. This is different from the past, in which Visual Studio 2010 list was shown in the Error List window.
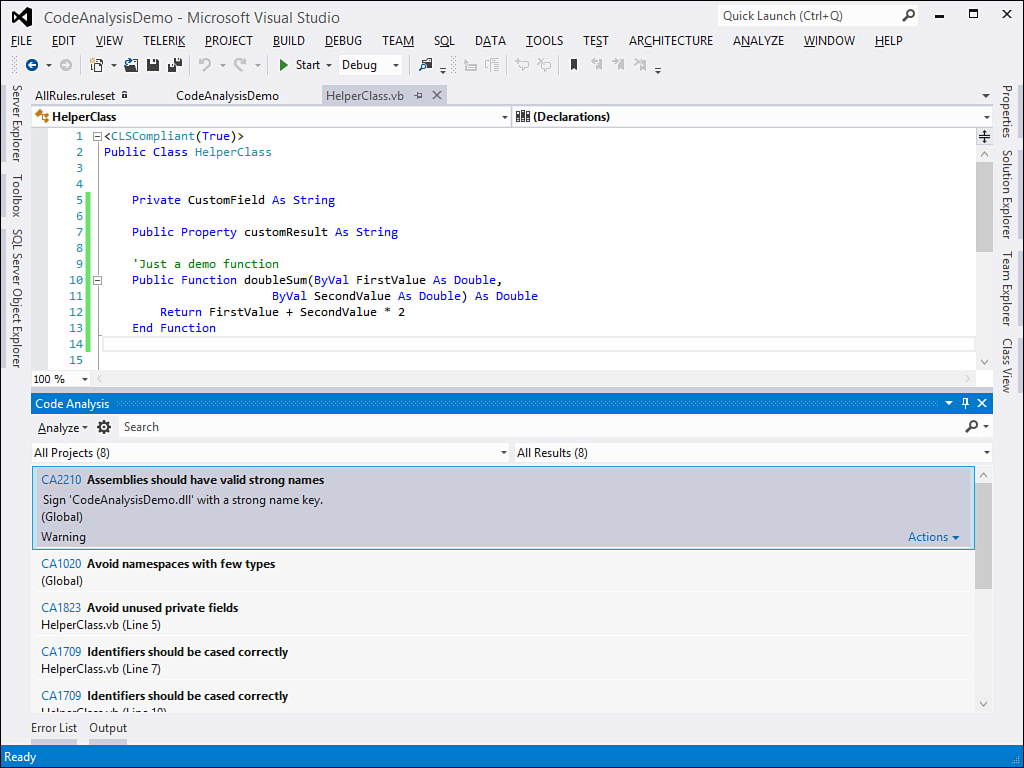
Figure 55.3. Report from the code analysis tool.
Each violation message includes the violation ID and a description that can help you fix the error. In most cases, violations are interpreted by the IDE as warnings, but in the code analysis designer you can modify this behavior by setting what violations must be notified as breaking errors. Assembly-level violations do not include the line of code to be fixed, whereas code-level violations do. In this case, you click the error message so the line of code to be fixed will be highlighted.
Getting Error Help
There are hundreds of Microsoft rules, so summarizing all of them in this book is not possible. You can get detailed information on each violation (and on each solution) by selecting the error message and then by pressing F1.
We can now begin fixing violations. It is worth mentioning there can be situations in which violations cannot be fixed due to particular scenarios. For example, the first violation in our example (CA1020) indicates that we should merge the current type into an existing namespace because a well-formed namespace contains at least five members. Due to our demo scenario, we can ignore this violation that is nonbreaking.
In situations you know an error is nonbreaking due to a particular context, you can tell the code analysis engine to ignore an error by right-clicking the error message and then selecting Suppress Message. If you choose to suppress the message in the source code file, Visual Studio will decorate the line of code with a SuppressMessage attribute whose parameters are an identifier that represents the set of rules in which the error falls and the name of the rule. You can also choose the Suppression File option, which will generate a code file called GlobalSuppressions.vb and is a repository for all suppression messages. Notice that this choice is mandatory in the case of error messages that are not strictly related to fixing code.
The next error message (CA2210) indicates that the assembly must be signed with a strong name. I described strong names and provided instructions to add a strong name file to the library in Chapter 50, “Understanding the Global Assembly Cache.” I named the strong name file as TestCode.pfx providing the TestCode password. The next violation (CA1014) requires the assembly to be marked as CLS-compliant. To accomplish this, click the Show all files button in Solution Explorer, expand My Project and add the following line to the AssemblyInfo.vb file:
<Assembly: CLSCompliant(True)>
The next violation (CA1824) indicates that a neutral-language resource should be supplied to the assembly. Because you have the AssemblyInfo.vb file already open, write the following line:
<Assembly: NeutralResourcesLanguageAttribute("en-US")>
You could set this property via the Assembly Information dialog box from the Application tab in My Project. With this step, all assembly level violations were fixed. Now it is time to solve code-level violations. The CA1823 violation suggests there is a field named CustomField that is never used and because of this, should be removed to improve performance. Now, remove the following line of code:
Private CustomField As String
The next step is to solve three CA1709 violations, which are all about members naming. We need to replace the first letter of the doubleSum method with the uppercase and the first letter of both arguments with lowercase. This is translated in code as follows:
Public Function DoubleSum(ByVal firstValue As Double,
ByVal secondValue As Double) As Double
Naming Conventions
Naming conventions were discussed in Chapter 7, “Class Fundamentals.” Refer to that chapter for details about methods, method arguments, and properties.
There is another naming convention violation to be fixed on the customResult property that must be replaced with CustomResult. The last required fix is on performance (CA1822 violation). The code analysis tool determines that the DoubleSum method never invokes the class constructor; therefore, it suggest to mark the method as Shared or to invoke the constructor. In this particular situation, the method can be marked as Shared like this:
Public Shared Function DoubleSum(ByVal firstValue As Double,
ByVal secondValue As Double) As Double
In this particular case, we do not need an instance method. For your convenience, all edits are available in Listing 55.2 (except for assembly level edits).
Listing 55.2. Fixing Errors Reported by the Code Analysis Tool
<CLSCompliant(True)>
Public Class HelperClass
'Private CustomField As String
Public Property CustomResult As String
Public Shared Function Sum(ByVal firstValue As Double,
ByVal secondValue As Double) As Double
Return firstValue + secondValue
End Function
End Class
If you run the code analysis tool again, you can notice that only the CA1020 design rule is still reported (the one on merging types into an existing namespace we decided not to fix due to our particular scenario). The code analysis tool is a helpful instrument, especially if you are a libraries developer. Microsoft has a Code Analysis Team with a blog where you can find more information at http://blogs.msdn.com/fxcop. Remember you can easily retrieve detailed information on violation errors and fixes directly from within Visual Studio.
Calculating Code Metrics
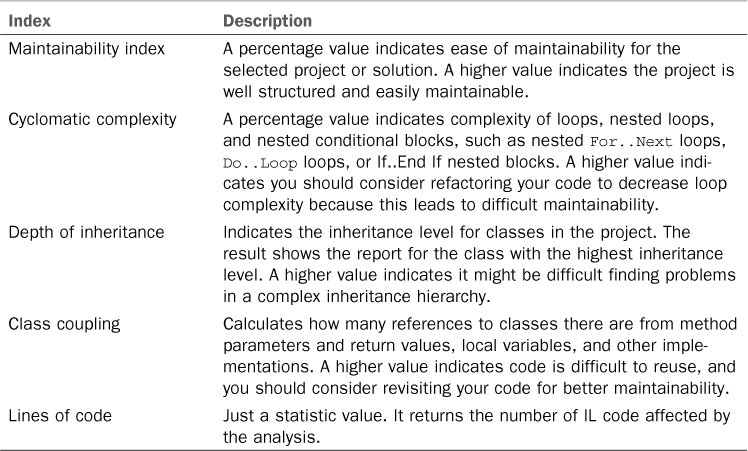
Code metrics is an interesting tool that analyzes a project or a solution and provides results about the ease of maintainability according to specific indexes. To use the tool, go to the Analyze menu by selecting the Calculate Code Metrics command or right-clicking the project name in Solution Explorer and then selecting the same-named command. The tool calculates code metrics according to the indexes summarized in Table 55.2.
Table 55.2. Code Metrics Analyzed Indexes
To understand how it works, in Visual Studio 2012 open the SnippetCompilerVSPackage sample project described in the previous chapter. Next, run the Code Metrics tool by selecting the Analyze, Calculate Code Metrics for solution command. After a few seconds, you get the report shown in Figure 55.4.
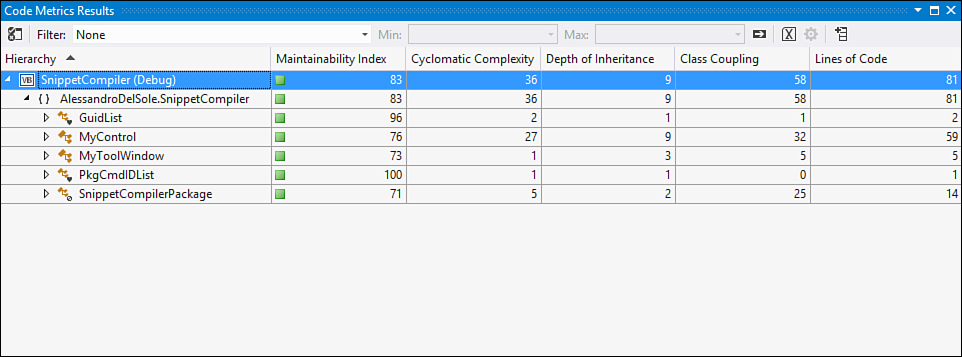
Figure 55.4. Calculating code metrics for the specified project.
As you can see from the report, the project has a maintainability index of 83, which is quite good. Values from 80 to 100 are the best range for maintainability. Visual Studio shows a green symbol if the index is good or a red one if the maintainability index is poor. You can expand the SnippetCompiler item to see how the global result is subdivided for each class and for each class member. The global Cyclomatic Complexity index is 36, which is a reasonable number for our kind of project. Depth of Inheritance index is 9, which is also reasonable, meaning one or more class is inheriting from another class that inherits from another one (the third one is System.Object). This is an absolutely acceptable value in this particular scenario, especially because it involves a user control that, by its nature, has a deep inheritance hierarchy. The Class Coupling index is a little too high. It is determined by the SnippetCompilerPackage class, so this class has a lot of references to other classes. Particularly, if you expand this class you can notice the problem is the Initialize method that makes calls to a lot of objects. Obviously, not necessarily a high index indicates problems. In this code example, a high value is acceptable because all invocations are required to make the Visual Studio package work. However, in a reusable class library, a high value should need attention and code refactoring.
Exporting to Excel
If you need to elaborate the code metrics results, you can export the analysis report to Microsoft Excel. This can be accomplished with the Open List in Excel button on the Code Metrics Result tool window.
Code Clone Detection
It is common to have an application that is under development for a long time. In this kind of situation, you might have millions of lines of code and you might forget you had already written a procedure or code snippet to solve a particular problem. So you create a duplicate. Visual Studio 2012 introduces a new tool called Code Clone Detection with the goal of helping developers find code snippets that are equal or very similar. To understand how this new tool works, open the SnippetCompiler project created in the previous chapter. Then enter the MyControl.xaml.vb code file and create a make a copy of the Compile method, rename the copy as CompileCloned. When ready, select Analyze, Analyze Solution For Code Clones. Visual Studio starts searching for cloned code and the result is shown in the Code Clone Analysis Result window, which is represented in Figure 55.5.
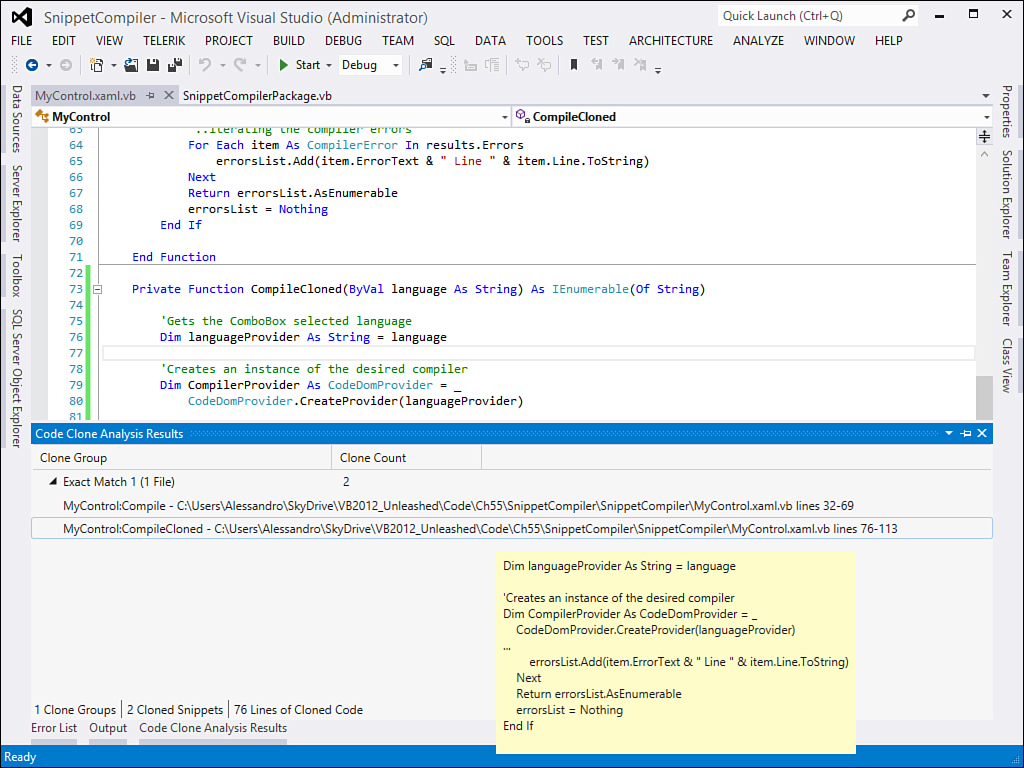
Figure 55.5. Finding exact code clones.
Visual Studio will group code clones by their relevance and will show the number of clones for each group, including the line numbers that have been detected as cloned. If you pass with the mouse pointer over an item, a tooltip shows an excerpt of the code. As you can see in this case, Visual Studio shows the Exact Match message because clones are exactly the same. Of course, Visual Studio is powerful enough to identify clones of code snippets too. To demonstrate this, rename some variables in the CompileCloned method and rearrange variable declarations. If you run the Code Clone Detection tool again, you will see that Visual Studio still recognizes clones, but this time the message is Strong Match. This means the clones are not exactly the same but are very similar (see Figure 55.6).
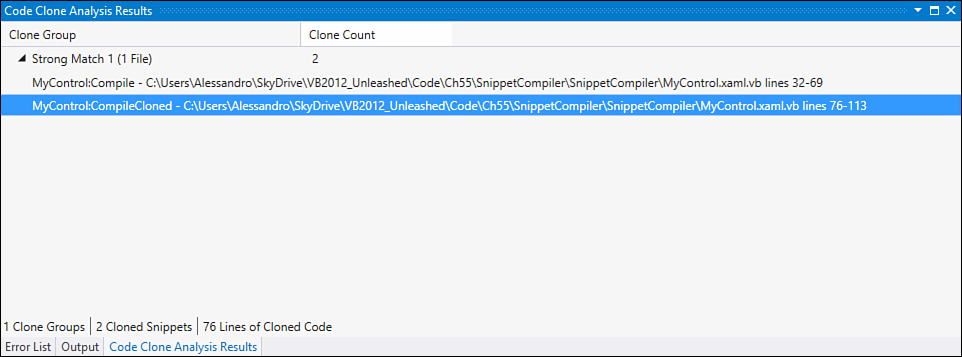
Figure 55.6. Finding similar code clones.
If you select two or more clones in the results window and right-click the selection, you can click the Compare command to have a visual comparison of code clones as demonstrated in Figure 55.7.
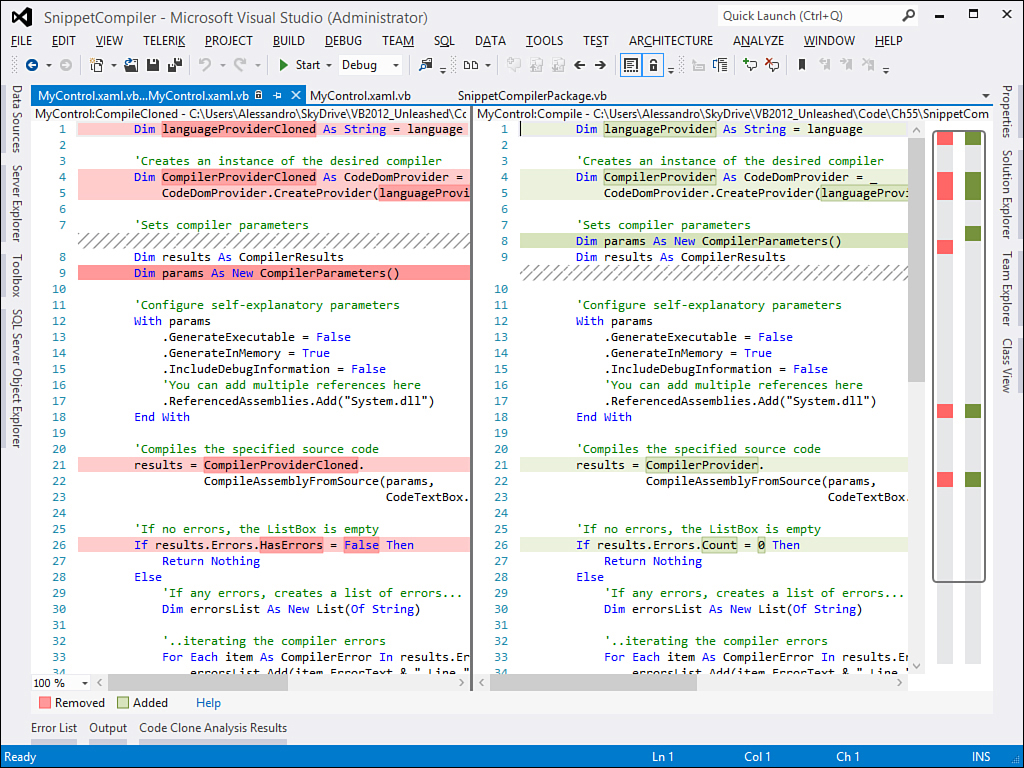
Figure 55.7. Comparing code clones.
As you can see, the IDE highlights with different colors the lines of code it has recognized as changed if compared to the original code. Following is a list of useful information about code detection:
• Visual Studio can find clones only longer than 10 lines of code.
• Type declarations are not analyzed, only methods and properties definitions.
• Because code clones often results from copying some code from a location to another one, the tool discovers additions of lines, deletions, and rename actions.
In this chapter, you saw an example of code clone inside the same code file, but the tool searches throughout the entire solution. This tool is particularly useful for code refactoring and when updating the code due to a long development time.
Profiling Applications
Performances are a fundamental aspect in development. An application with slow performances can discourage customers, even if it has the coolest user interface or features. Visual Studio offers an integrated profiling tool that uses the WPF-based user interface of Visual Studio while also offering great organization for the collected information layout. To understand how the profiler works, we need a test project. Now, create a new console application in Visual Basic. The best way for understanding how the profiler can improve your productivity is to consider the simple example of strings concatenation both using String objects and StringBuilder ones. In the main module of the console application, write this simple code:
Module Module1
Sub Main()
ConcatenationDemo()
Console.ReadLine()
End Sub
Sub ConcatenationDemo()
Dim testString As String = String.Empty
For i = 0 To 100000
testString += "I love VB 2012"
Next
End Sub
End Module
The preceding code creates a big concatenation of String objects. To analyze performance, we now need to start the profiler. Select the Analyze, Launch Performance Wizard command. This launches the step-by-step procedure for setting up the profiler running against your project. Figure 55.8 shows the first dialog box in the wizard, where you can select the most appropriate profiling technique according to your needs.
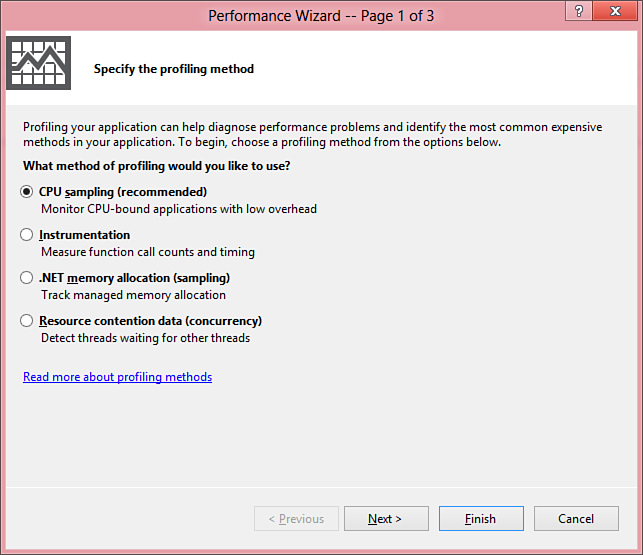
Figure 55.8. Selecting the profiling technique.
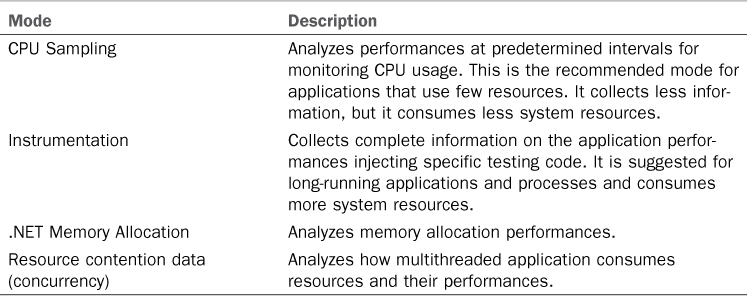
There are several available profiling modes, which are described in Table 55.3.
Table 55.3. Available Profiling Modes
Leave unchanged the default CPU-sampling option and click Next. The second dialog box allows selecting the executable to be analyzed. As you can see from Figure 55.9, you can choose one of the executables resulting from the current solution or an external executable. Select the current executable (the default option) and continue.
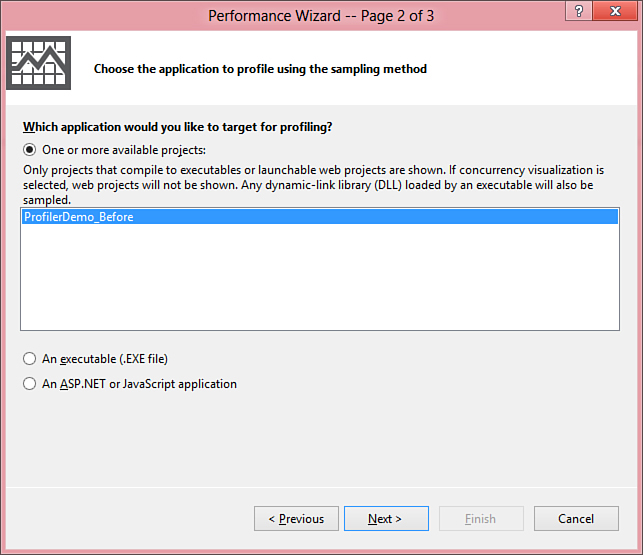
Figure 55.9. Selecting the executable to be analyzed.
The last dialog box in this wizard is just a summary. Uncheck the one check box available so the Profiler will not be launched when you click Finish (see Figure 55.10).
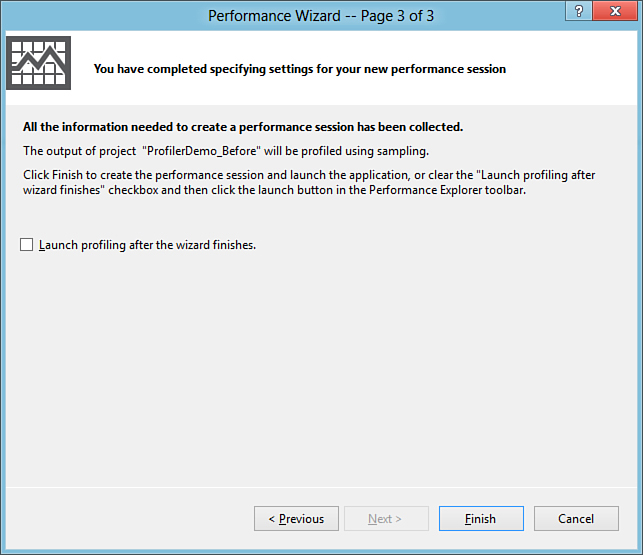
Figure 55.10. Setting up the Profiler completed.
You might want to leave the flag on the check box to automatically launch the Profiler if the default settings are okay for you, but in this particular scenario we need to make a couple of manual adjustments. When the wizard shuts down, the Performance Explorer tool window appears in the IDE. Because the sample application does not stress the CPU intensively, we need to set a smaller value for the CPU Sampling intervals. To accomplish this, follow these steps:
1. In the Performance Explorer window, right-click the ProfilerDemo_Before item.
2. Select the Properties command from the popup menu.
3. In the ProfilerDemo_Before Property Pages dialog box, select the Sampling node on the left and then replace the default value in the Sampling Interval text box with 120000. This will let the profiler collect data at smaller intervals of CPU clock cycles. This small value is appropriate for small pieces of code like the current example, but you could leave unchanged the default value in real-world applications.
4. Click OK to close the dialog box and then right-click the ProfilerDemo_Before item in Performance Explorer. Finally, click Start Profiling from the pop-up menu. This will launch the Profiler.
If it is the first time you run the Profiler Visual Studio, it requires your permission for upgrading driver credentials to let the Profiler access system resources for monitoring purposes. Give your permission when the appropriate dialog box appears. Visual Studio runs your application with an instance of the Profiler attached. During all the application lifetime, Visual Studio will look like Figure 55.11, showing a work-in-progress message.
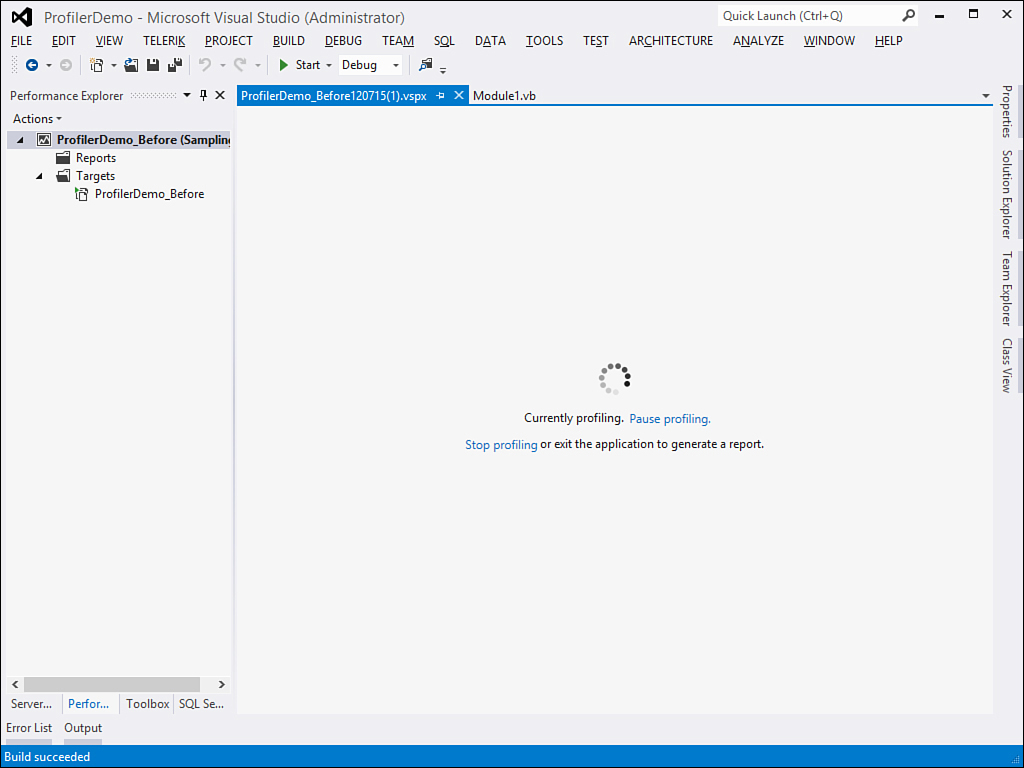
Figure 55.11. The profiler is currently running.
The application will be analyzed unless you terminate it. The profiler monitors performances at specific intervals to collect detailed information. When ready, close the application. This detaches the profiler instance. The profiler will now generate a report about the analysis. Figure 55.12 shows the report.
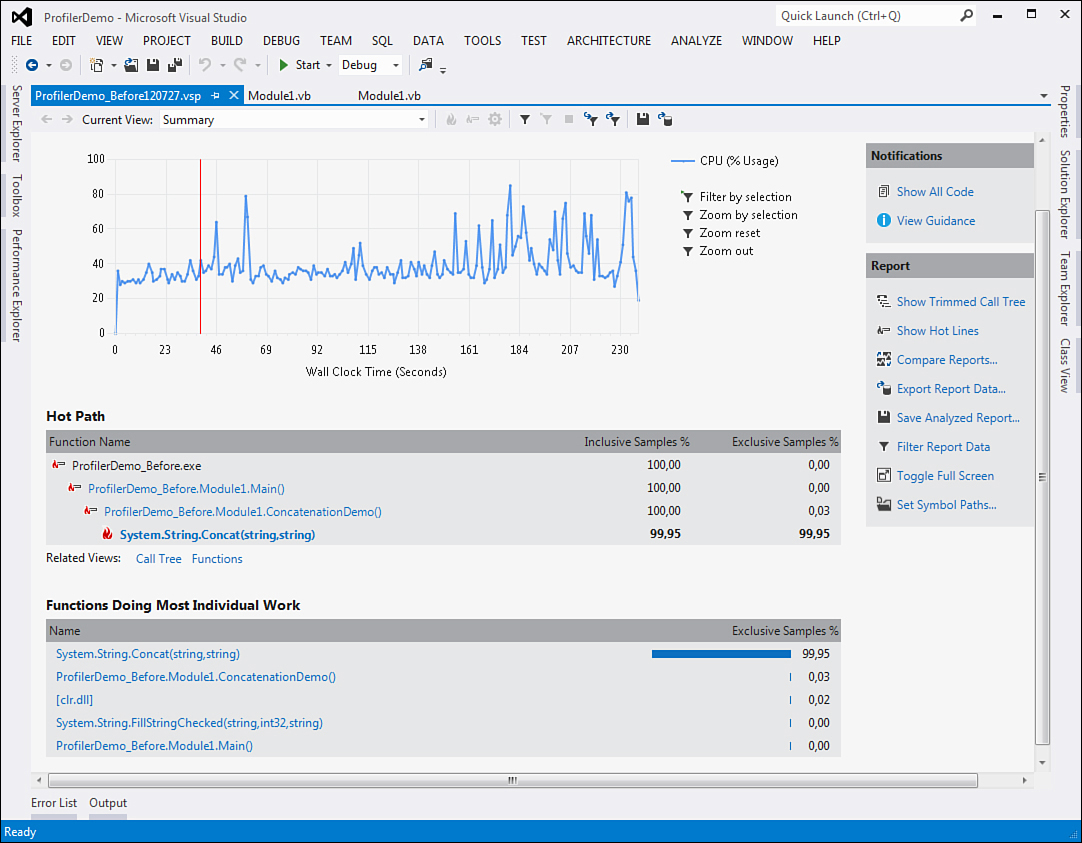
Figure 55.12. The analysis report produced by the profiler.
On the top of the report is a graph showing the CPU usage at monitored intervals. In the center of the screen is the Hot Path summary, which shows the most resources consuming function calls and their hierarchy. The analyzed executable has a global impact of 100%, which is a high value and can be negative for performances. Notice how the ConcatenationDemo method makes invocations to String.Concat. This is the function doing the most individual work, as evidenced in the Hot Path view and in the Functions Doing Most Individual Work graph. It has a 99.95% impact meaning there is some work to do to improve performances. By default, the profiler report shows results for your code, but not for code invoked at a lower level by and within the CLR. Fortunately, you can also analyze deeper function calls by clicking the Show all code link in the upper right. Figure 55.13 shows how behind the scenes the sample code invokes the System.String.wstrcpy system function that also has a high impact.
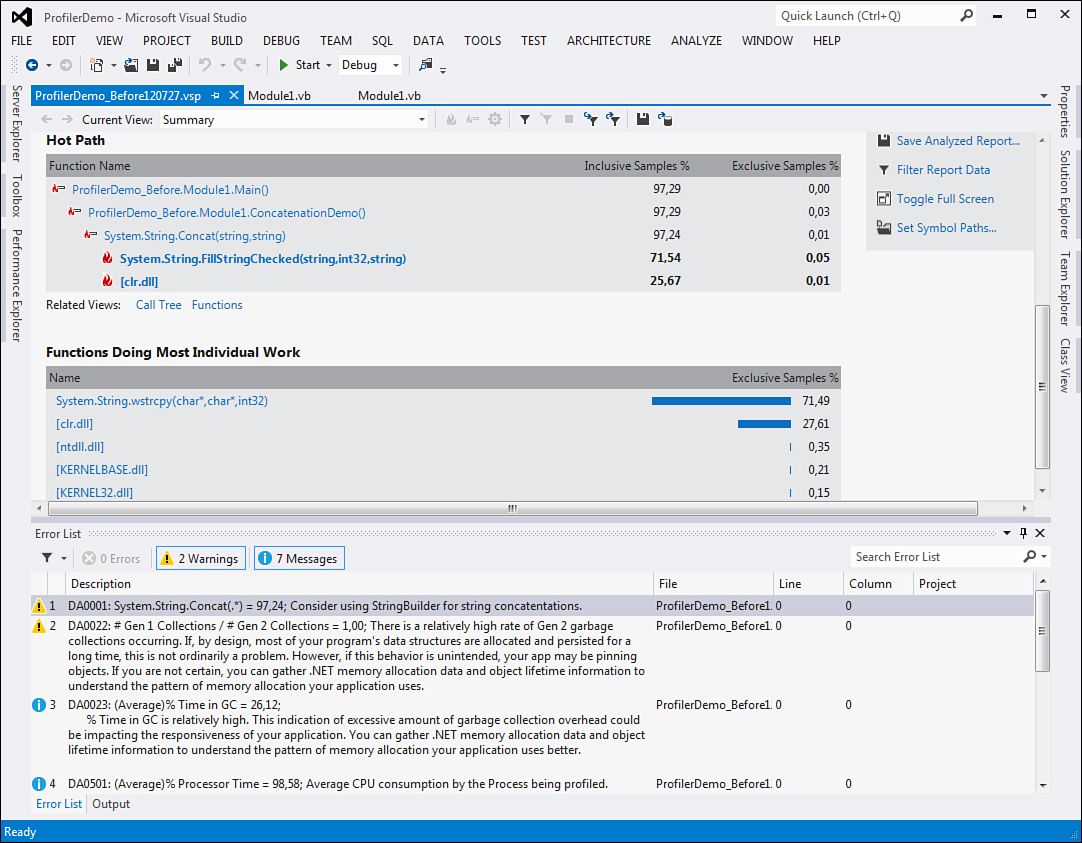
Figure 55.13. The Profiler can show system calls and their resource consumption.
The Current View combo box enables viewing lots of other useful information, such as processes involved in profiling, function details, lines of code most consuming, and marks. For marks, you can check out intervals and related CPU usage percentage, as shown in Figure 55.14.
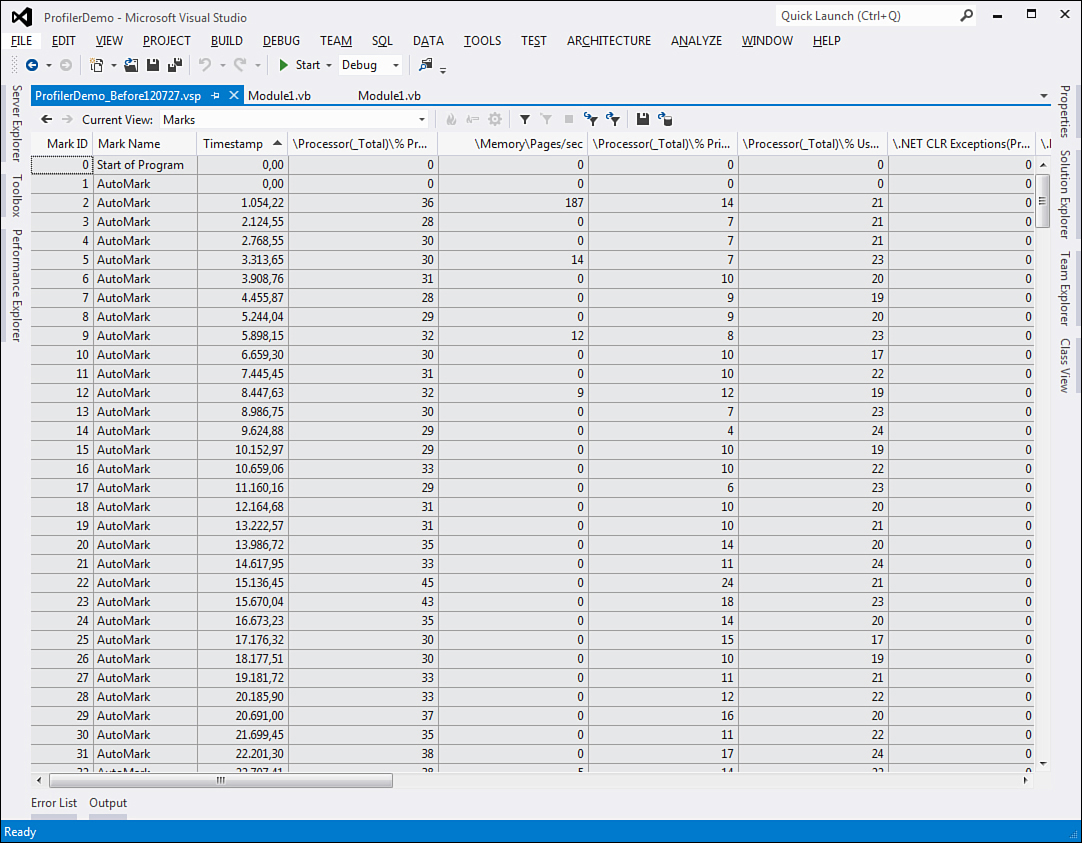
Figure 55.14. Checking intervals and CPU usage.
The report is saved as a .vsp file, which can be useful for later comparisons. You can export the report to Microsoft Excel or as XML data (Export Report Data command). There is other good news. If you check out the Error List window (see Figure 55.13), you notice a warning message saying the invocation to String.Concat has a very high impact and you should consider using a StringBuilder for string concatenations. Therefore, in several cases Visual Studio can detect the problem and provide the appropriate suggestions to fix it. Following this suggestion, replace the application code as follows:
Module Module1
Sub Main()
ConcatenationDemo()
Console.ReadLine()
End Sub
Sub ConcatenationDemo()
Dim testString As New Text.StringBuilder
For i = 0 To 100000
testString.Append("I love VB 2012")
Next
End Sub
End Module
Now follow the same steps described before about setting the value for the CPU Sampling clock cycles to 120000 for the current project. Then run the Profiler again via the Analyze, Profiler, Start Profiling command. You will immediately notice that your edit will dramatically speed up the application execution. And after a few seconds, Visual Studio 2012 generates a new report, represented in Figure 55.15.
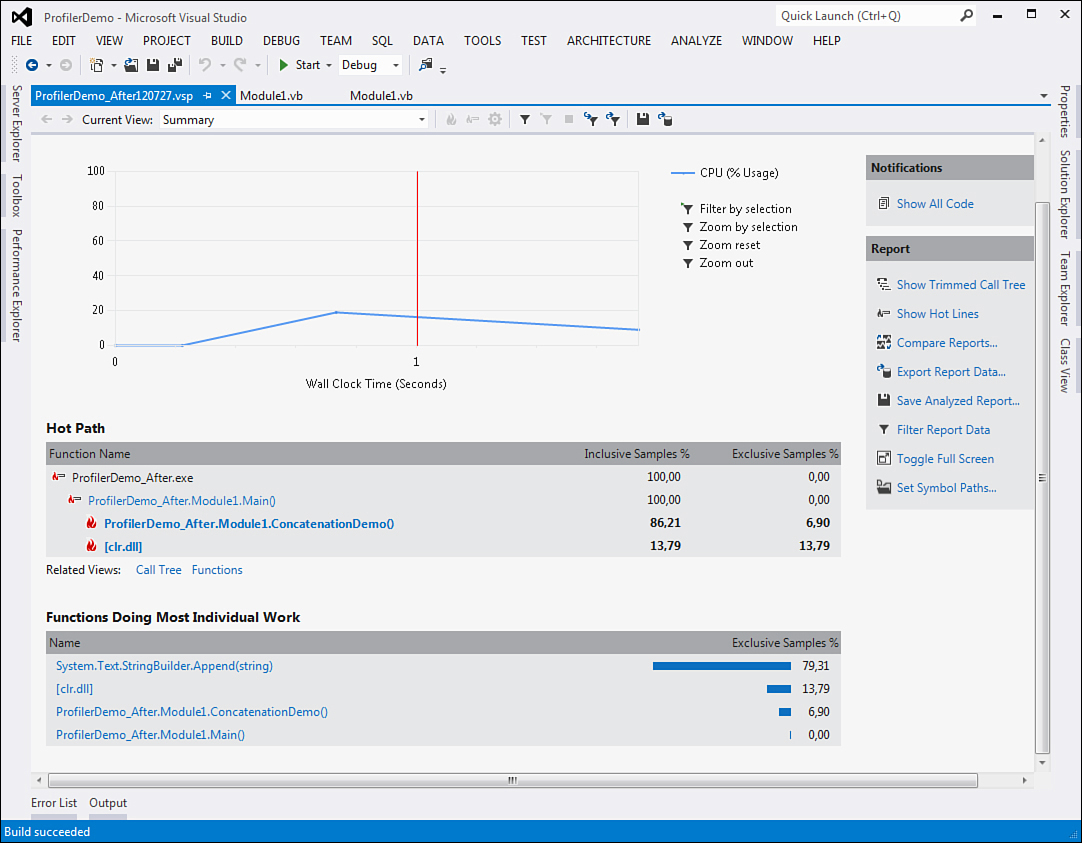
Figure 55.15. The new report after code improvements.
The usage of StringBuilder reduced the amount of CPU usage from 99.95% to 79.31% for the string concatenation operation. This means our edits improved the application performances, as demonstrated by the Error List window that is now empty. To get a better idea of what happened, you can compare the two generated reports. Right-click one of the available reports in the Performance Explorer tool window and select Compare Performance Report. In the appearing dialog box, just browse for the second report and click OK. Figure 55.16 shows the result of the comparison.
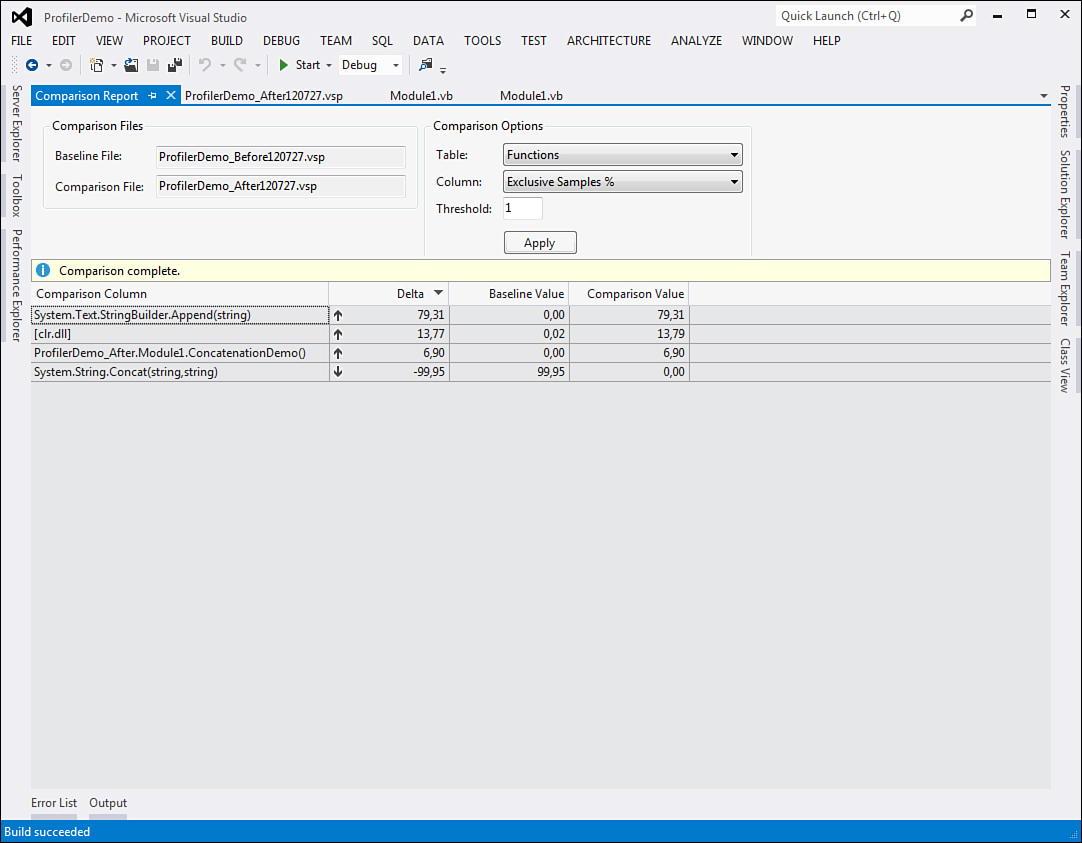
Figure 55.16. Comparing two performance reports.
The Delta column indicates the difference between the old value and the new one. The Baseline column indicates the value in the old analysis, whereas Comparison indicates the value in the new analysis. In this specific example, the bad string concatenation operation made by using the String.Concat function passed from a bad state to a good one due to the usage of a StringBuilder instance. The profiler is a good friend in your developer life and it is suggested to profile applications every time you can. The Visual Studio 2012 profiler offers the opportunity of profiling multithreaded applications, which is useful against parallel programming techniques.
Profiling External Executables
The Visual Studio profiler is not limited to solutions opened in the IDE, but it can be successfully used for profiling standalone executables. With regard to this, the profiler not only allows analyzing .NET applications, it also allows profiling applications built on the Win32 architecture. To demonstrate how this works, close the solution opened in Visual Studio (if any) ensuring nothing is available in Solution Explorer. Now start the Performance Wizard following the steps shown in the previous section until you get the result shown in Figure 55.8. The next step is selecting the An executable (.EXE file) option. When this is selected, you need to specify an executable to analyze. Just for demo purposes, select the executable generated in the previous example. Figure 55.17 shows how to accomplish this.
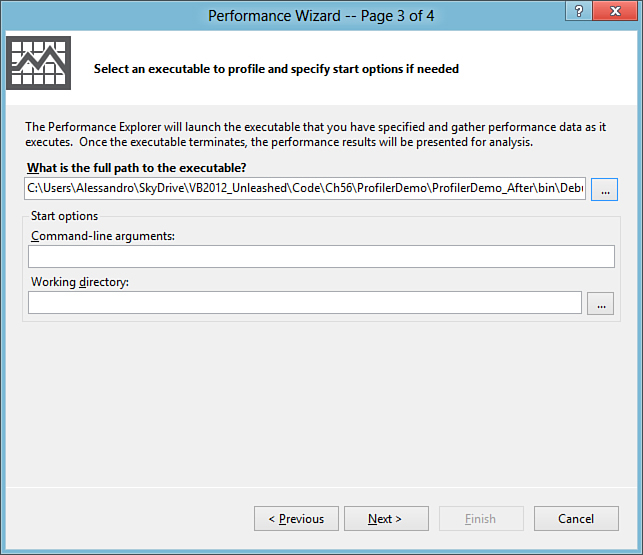
Figure 55.17. Selecting a standalone executable.
After completing this wizard, Visual Studio launches the specified executable with an instance of the profiler attached. When completed, Visual Studio generates a report, as shown in the previous section. In this particular case, you get nothing but the same profiling results with it being substantially the same application. In all other cases, you get specific analysis results for the selected executable. The Error List continues to show warning or error messages related to the application performance providing the appropriate suggestions when available. Of course, improving performance requires having the source code for the executable analyzed.
Historical Debugging with IntelliTrace
Edition Note
The IntelliTrace debugger is available only with the Visual Studio 2012 Ultimate edition.
One of the most important tools in Visual Studio 2012 is IntelliTrace, initially known as the historical debugger. This tool was first introduced with Visual Studio 2010 and can improve your debugging experience because it can record and navigate every event occurring during the application lifetime, such as events and failures including information on specific threads. IntelliTrace is fully integrated with the code editor and with the rest of the IDE functionalities, such as Call Stack and Locals tool windows so it can provide a complete debugging environment. The tool is capable of recording (to a file, too) and debugging the following:
• Application events, such as user interface events or application exceptions
• Playback debugging, which allows deep debugging over specific events occurred before and after a particular code block
• Unit test failures
• Load test failures and build acceptances test
• Manual tests
In this section, you learn how to use IntelliTrace to debug application events, exceptions, and unit test failures. Before showing IntelliTrace in action, it is a good idea to set its options in Visual Studio.
IntelliTrace Options
There are many options for customizing IntelliTrace’s behavior. You set its options via the usual Tools, Options command and then selecting the IntelliTrace item. Figure 55.18 demonstrates this.
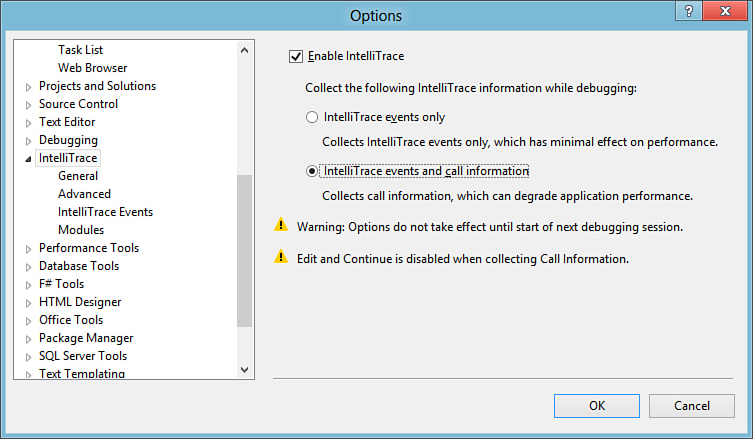
Figure 55.18. Setting general options for IntelliTrace.
IntelliTrace is enabled by default. The default behavior is that IntelliTrace will collect events only, but for this discussion select IntelliTrace Events and Call Information to get complete information on the code calls, too. This kind of monitoring is the most expensive in terms of system resources and should be used only when necessary. It offers a high-level view of what happens during the application lifetime. You have deep control over application events that IntelliTrace can keep track of. Select the IntelliTrace Events item. You see a list of .NET elements, such as ADO.NET, Data Binding, and Threading. For each of them you can specify particular events you want to be traced. For example, the Gesture events collection enables specifying user interface events such as button clicks, shown in Figure 55.19.
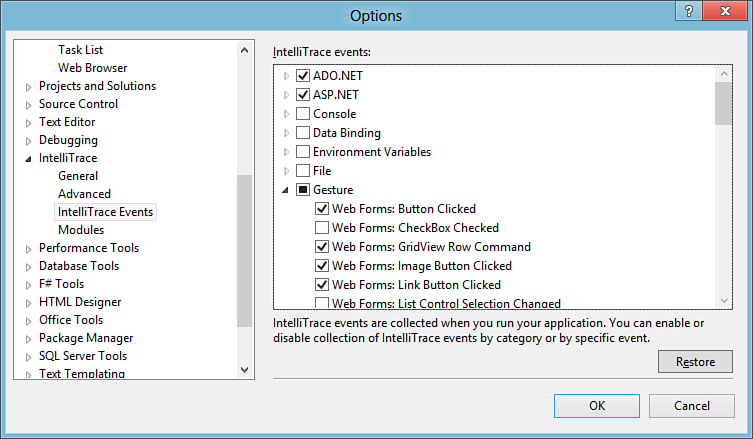
Figure 55.19. Selecting events to be tracked by IntelliTrace.
The Advanced and Modules items enable you to respectively specify locations and size for logs and which .NET modules must be tracked other than the current application. For this demonstration, leave the default settings unchanged. At this point, we need a sample application to see IntelliTrace in action.
Creating a Sample Application
The goal of this section is to illustrate how IntelliTrace can save you time by tracking events and exceptions with detailed information that can help you to understand what the problem is. According to this, creating a client WPF application can be a good example. To demonstrate both application events and exceptions, we can place a button that invokes a method attempting to open a file that does not exist. After creating a new WPF project named (IntelliTraceDemoApp) with Visual Basic, in the XAML code editor, write the code shown in Listing 55.3.
Listing 55.3. Setting Up the User Interface for the Sample Application
<Window x:Class="MainWindow"
xmlns="http://schemas.microsoft.com/winfx/2006/xaml/presentation"
xmlns:x="http://schemas.microsoft.com/winfx/2006/xaml"
Title="MainWindow" Height="350" Width="525">
<Grid>
<Grid.RowDefinitions>
<RowDefinition />
<RowDefinition />
</Grid.RowDefinitions>
<Button Name="OpenFileButton" Width="100" Height="50"
Content="Open file" Grid.Row="0"/>
<TextBox IsReadOnly="True" Name="FileTextBox"
Grid.Row="1"/>
</Grid>
</Window>
On the Visual Basic code-behind side, write the code shown in Listing 55.4, which handles the Button.Click event and tries to open a text file.
Listing 55.4. Writing the Failing Visual Basic Code Before Running IntelliTrace
Class MainWindow
Private Sub OpenFileButton_Click(ByVal sender As System.Object,
ByVal e As System.Windows.RoutedEventArgs) _
Handles OpenFileButton.Click
Me.FileTextBox.Text = OpenFile()
End Sub
'Just for demo purposes
'Consider dialogs implementation in real life apps
Private Function OpenFile() As String
'Attempting to open a fake file
Return My.Computer.FileSystem.
ReadAllText("C:Alessandro.txt")
End Function
End Class
Now that we have a sample project that will voluntarily fail at runtime, it is time to see how to catch problems using IntelliTrace.
Tracking Application Events and Exceptions with IntelliTrace
Run the demo application and click the button to cause an exception. The application breaks because the specified file is not found. The IntelliTrace tool window appears inside Visual Studio 2012, showing a list of events you can see in Figure 55.20.

Figure 55.20. IntelliTrace in action, showing occurred events.
Filtering Results
You can filter information by category and by thread. Use the upper combo box to select which kind of events category you want to check out (for example, Console, ASP.NET, ADO.NET, and so on) and which specific thread you want to get tracking information for, respectively.
As you can see, IntelliTrace is not just a debugger showing errors or places where errors occurred. It is a powerful tool capable of tracking every single event occurring during the entire application lifetime—meaning that you could even use IntelliTrace to keep track of events without errors. In the current example, notice how the first tracked event is the application startup. There are other events tracked. Click the Gesture event to get information on this kind of event. IntelliTrace informs you the user clicked the OpenFileButton control, which is of type System.Windows.Controls.Button and whose content is Open File, also showing the thread description and ID. This is a predictable event, but as you can imagine you can keep track of all events. For instance, when data-binding is performed on a data-bound control, when the user selects an item from a ListBox, or when the application attempts to make a particular action. This can produce a huge amount of information you can analyze later. To get information on the exception thrown, click the exception item. Visual Studio shows the full error message and the line of code that caused the exception. When you click this item, the line of code will automatically highlight in the code editor for your convenience. IntelliTrace offers the capability of checking the entire tree of function calls (just in case you enable call information). In a few words, this feature keeps track of every single function call made by the runtime during the application lifetime. To show this, click the Show Calls View button in the IntelliTrace toolbar. Figure 55.21 shows an example, pointing to the place where the user clicked the button.
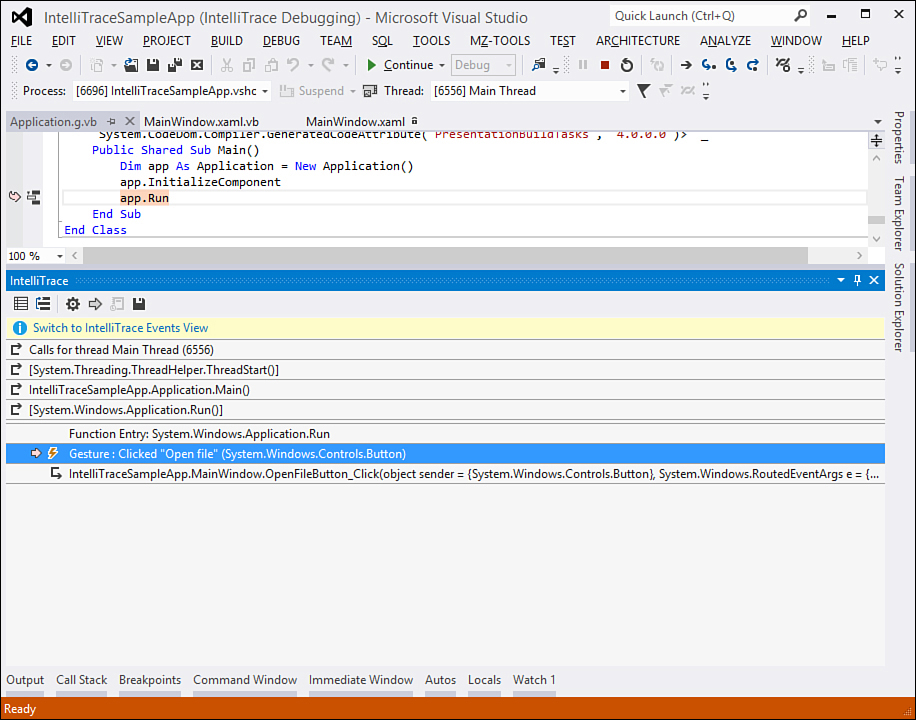
Figure 55.21. Showing functions call tree with IntelliTrace.
The sample figure shows the first function call that is a call for starting the main thread. The next functions are calls that the CLR makes to run the application and initialize it. The list is complete, also showing calls made during the rest of the application lifetime until it broke because of the exception. You can easily browse calls using the vertical scroll bar on the right.
Analyzing IntelliTrace Logs
When the application is running with the debugger attached, IntelliTrace records everything happening. (This is the reason you might notice a small performance decrease when you select the events and call recording option.) These recordings are saved to log files available in the C:ProgramDataMicrosoft Visual Studio11.0TraceDebugging folder and can be analyzed directly from within Visual Studio. To accomplish this, follow these steps:
1. In Windows Explorer, open the C:ProgramDataMicrosoft Visual Studio11.0TraceDebugging folder.
2. Double-click the last log file related to your application. Notice that log file names all begin with the application name, but you can open the most recent according to the date modified value.
Visual Studio opens the log file showing a result similar to what you see in Figure 55.22.
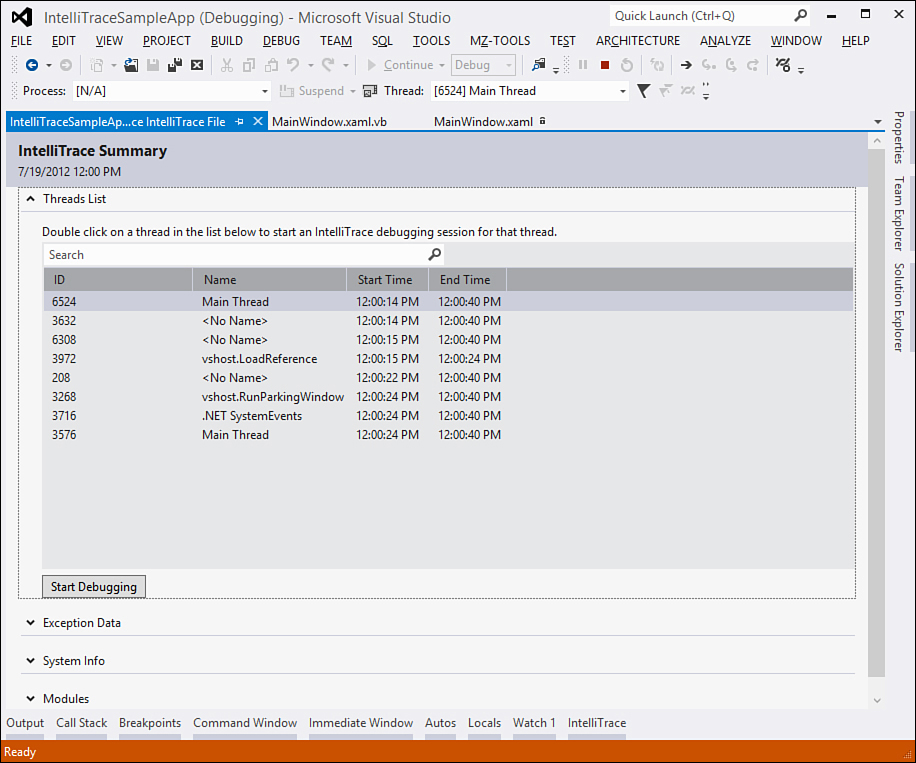
Figure 55.22. Analyzing IntelliTrace logs.
Logs contain lots of information. For example, you can understand at what time a specific thread was tracked and can start debugging from a given thread. In addition, information on exceptions will also be shown. You can check about system information and modules involved in the tracking process (this information is placed at the bottom of the page).
Using IntelliTrace for Unit Tests
IntelliTrace is not limited to tracking the application lifetime but can be used for unit tests and understanding what is behind failures. This particular scenario is discussed in Chapter 56, “Testing Code with Unit Tests, Test-Driven Development, and Code Contracts,” which provides an overview of unit testing and test-driven development.
Generating Dependency Graphs
Another interesting tool in Visual Studio 2012 is the Dependency Graph generation. This feature enables you to generate a WPF-based, graphical browsable view of dependencies between objects in your projects. Dependency graphs can be generated at assembly level (including all types), namespace level (including only types from a given namespace), or at class level. To demonstrate this feature, create a new console project and add the following items:
• An Entity Data Model mapping the Customers, Orders and Order_Details tables from the Northwind database (see Chapter 26, “Introducing ADO.NET Entity Framework,” for a recap).
• A new class named Helper, with the purpose of offering a simple method that returns a collection of order details based on the order identifier. The code for this class is shown in Listing 55.5.
Listing 55.5. Demo Class to Be Mapped into the G Graph
Imports System.Data.Objects
Public Class Helper
Public Shared Function GetOrderDetails(ByRef context As NorthwindEntities,
ByVal orderID As Integer) As _
ObjectQuery(Of Order_Detail)
Dim result = From det In context.Order_Details
Where det.Order.OrderID = orderID
Select det
Return CType(result, Global.System.Data.Objects.
ObjectQuery(Of Global.DependencyGraphDemo.Order_Detail))
End Function
End Class
Now select the Architecture, Generate dependency graph, For Solution command. After a few seconds, the new graph will be available inside Visual Studio 2012. You can then expand items and check for their dependencies with other objects, as represented in Figure 55.23.
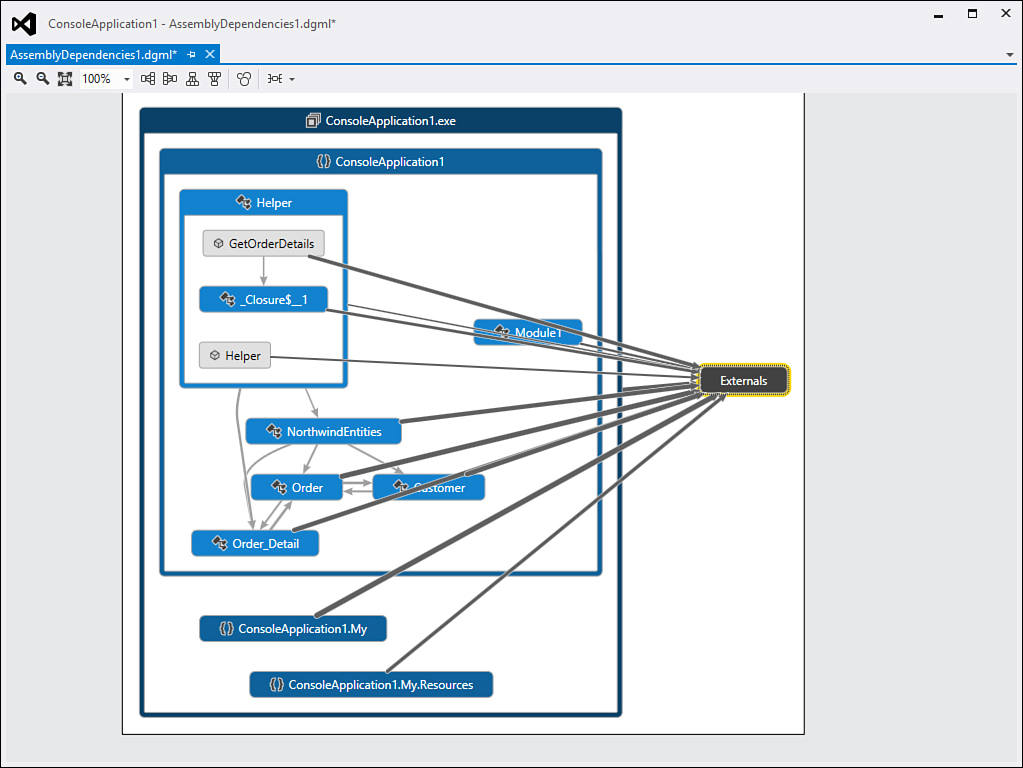
Figure 55.23. The newly generated assembly-level dependency graph.
To understand items mapping, you can check out the legend. To show complete dependencies information, right-click the graph and select the Show Advanced Selection command. This launches the Selection tool window where you can select one or more objects to be investigated and additional objects to be analyzed such as public or private properties. Figure 55.23 shows public properties dependencies from all classes in the project. For example, the NorthwindEntities class has dependencies with the Helper.GetOrderDetails method because this one receives an argument of type NorthwindEntities. The dependency graphs are flexible and can be exported to XPS documents or to images (right-click the graph for additional options).
Summary
This chapter covered some important analysis tools available in Visual Studio 2012 Professional, Premium, and Ultimate, which are necessary for improving applications’ quality. You discovered how to analyze code for compliance with Microsoft coding rules, required especially when you produce reusable class libraries. Then you saw how to check for code maintainability using the Code Metrics tool. Next, you learned about a new tool called Code Clones Detection that helps you find duplicate code. In the second part of the chapter you were informed about the integrated Profiler that simplifies checking for performance issues and also provides IDE suggestions. You also saw different usages of the Profiler, including standalone executables. The chapter focused on the most interesting addition in Visual Studio 2012—the IntelliTrace debugger. Information was provided on using this tool to understand how to keep track of all application events and exceptions during the entire application lifetime, as well as showing how to analyze summary logs within Visual Studio. Finally, you got an overview of another new addition, the Dependency Graph generation, which provides a graphical view of dependencies at assembly, namespace, and class levels.