Chapter 9
Debugging Your Code
IN THIS CHAPTER
![]() Learning JavaScript’s error types
Learning JavaScript’s error types
![]() Debugging errors using the Console
Debugging errors using the Console
![]() Setting breakpoints
Setting breakpoints
![]() Watching variable and expression values
Watching variable and expression values
![]() Learning JavaScript’s most common errors and error messages
Learning JavaScript’s most common errors and error messages
Sometimes it pays to stay in bed on Monday, rather than spending the rest of the week debugging Monday’s code.
— CHRISTOPHER THOMPSON
It usually doesn’t take too long to get short scripts and functions up and running. However, as your code grows larger and more complex, errors inevitably creep in. In fact, it has been proven mathematically that any code beyond a minimum level of complexity will contain at least one error, and probably quite a bit more than that.
Many of the bugs that creep into your code will be simple syntax problems you can fix easily, but others will be more subtle and harder to find. For the latter — whether the errors are incorrect values being returned by functions or problems with the overall logic of a script — you’ll need to be able to look “inside” your code to scope out what’s wrong. The good news is that JavaScript and modern web browsers offer a ton of top-notch debugging tools that can remove some of the burden of program problem-solving. In this chapter, you delve into these tools to explore how they can help you find and fix most programming errors. You also investigate a number of tips and techniques that can go a long way to helping you avoid coding errors in the first place.
Understanding JavaScript’s Error Types
When a problem occurs, the first thing you need to determine is what kind of error you’re dealing with. There are three basic types: syntax errors, runtime errors, and logic errors.
Syntax errors
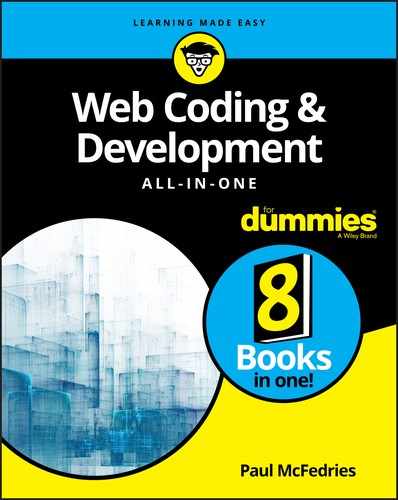
Syntax errors arise from misspelled or missing keywords or incorrect punctuation. JavaScript almost always catches these errors when you load the page (which is why syntax errors are also known as load-time errors). That is, as JavaScript reads the script’s statements, it checks each one for syntax errors. If it finds an error, it stops processing the script and displays an error message. Here’s an example statement with a typical syntax error (can you spot it?) and Figure 9-1 shows how the error gets flagged in the Firefox Console window.
pageFooter = document.querySelector("footer');
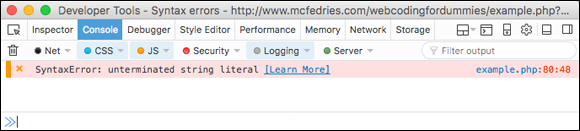
FIGURE 9-1: The Firefox Console window displaying data about a typical syntax error.
Runtime errors
Runtime errors occur during the execution of a script. They generally mean that JavaScript has stumbled upon a statement that it can’t figure out. It might be caused by trying to use an uninitialized variable in an expression or by using a property or method with the wrong object.
If your script has statements that execute as the page loads, and there have been no syntax errors, JavaScript will attempt to run those statements. If it comes across a statement with a problem, it halts execution of the script and displays the error. If your script has one or more functions, JavaScript doesn’t look for runtime errors in those functions until you call them.
Here’s some code where I misspelled a variable name in the third line (pagefooter instead of pageFooter), and Figure 9-2 shows the Firefox Console window displaying the runtime error that results.
pageFooter = document.querySelector("footer");
currDate = new Date();
pagefooter.innerHTML = "Copyright " + currDate.getFullYear() + " Logophilia Limited.";
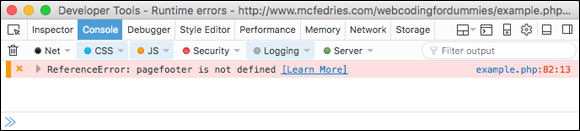
FIGURE 9-2: The Firefox Console displaying data about a typical runtime error.
Logic errors
If your code zigs instead of zags, the cause is usually a flaw in the logic of your script. It might be a loop that never ends or a switch test that doesn't switch to anything.
Logic errors are the toughest to pin down because you don’t get any error messages to give you clues about what went wrong and where. What you usually need to do is set up debugging code that helps you monitor values and trace the execution of your program. I go through the most useful debugging techniques later in this chapter.
Getting to Know Your Debugging Tools
All the major web browsers come with a sophisticated set of debugging tools that can make your life as a web developer much easier and much saner. Most web developers debug their scripts using either Google Chrome or Mozilla Firefox, so I focus on those two browsers in this chapter. But in this section, I give you an overview of the tools that are available in all the major browsers and how to get at them.
Here’s how you open the web development tools in Chrome, Firefox, Microsoft Edge, and Safari:
- Chrome for Windows: Click Customize and Control Google Chrome (the three vertical dots to the right of the address bar), then choose More Tools⇒ Developer Tools. Shortcut: Ctrl+Shift+I.
- Chrome for Mac: Choose View⇒ Developer⇒ Developer Tools. Shortcut: Option+⌘ +I.
- Firefox for Windows: Choose Menu⇒ Developer⇒ Toggle Tools. Shortcut: Ctrl+Shift+I.
- Firefox for Mac: Choose Tools⇒ Web Developer⇒ Toggle Tools. Shortcut: Option+⌘ +I.
- Microsoft Edge: Choose Settings and More⇒ Developer Tools. Shortcut: F12.
- Safari: Choose Develop⇒ Show Web Inspector. Shortcut: Option+⌘ +I. If you don’t see the Develop menu, choose Safari⇒ Preferences, click the Advanced tab, and then select the Show Develop Menu in Menu Bar checkbox.
These development tools vary in the features they offer, but each one offers the same set of basic tools, which are the tools you’ll use most often. These basic web development tools include the following:
- HTML viewer: This tab (it’s called Inspector in Firefox and Elements in the other browsers) shows the HTML tags used in the web page. When you hover the mouse pointer over a tag, the browser highlights the element in the displayed page and shows its width and height, as shown in Figure 9-3. When you click a tag, the browser shows the CSS styles applied with the tag, as well as the tag’s box dimensions (again, see Figure 9-3).
- Console: This tab enables you to view error messages, log messages, test expressions, and execute statements. I cover the Console in more detail in the next section.
- Debugging tool: This tab (it’s called Debugger in Firefox and Safari, and Sources in Chrome and Edge) enables you to pause code execution, step through your code, watch the values of variables and properties, and much more. This is the most important JavaScript debugging tool, so I cover it in detail later in this chapter.
- Network: This tab tells you how long it takes to load each file referenced by your web page. If you find that your page is slow to load, this tab can help you find the bottleneck.

FIGURE 9-3: The HTML viewer, such as Chrome’s Elements tab, enables you to inspect each element’s styles and box dimensions.
Debugging with the Console
If your web page is behaving strangely — for example, the page is blank or missing elements — you should first check your HTML code to make sure it’s correct. (Common HTML errors are not finishing a tag with a greater than sign (>), not including a closing tag, and missing a closing quotation mark for an attribute value.) If your HTML checks out, then there’s a good chance that your JavaScript code is wonky. How do you know? A trip to the Console window is your first step.
The Console is an interactive browser window that shows warnings and errors, displays the output of console.log() statements, and enables you to execute expressions and statements without having to run your entire script. The Console is one of the handiest web browser debugging tools, so you need to know your way around it.
Displaying the console in various browsers
To display the Console, open your web browser’s development tools and then click the Console tab. You can also use the following keyboard shortcuts:
- Chrome for Windows: Press Ctrl+Shift+J.
- Chrome for Mac: Press Option+⌘ +J.
- Firefox for Windows: Press Ctrl+Shift+K.
- Firefox for Mac: Press Option+⌘ +K.
- Microsoft Edge: Press F12 and then Ctrl+2.
- Safari: Press Option+⌘ +C.
Logging data to the Console
You can use the console.log() method of the special Console object to print text and expression values in the Console:
console.log(output)
output: The expression you want to print in the Console, formatted as a string
The output expression can be a text string, a variable, an object property, a function result, or any combination of these, as long as the expression result is a string.
 You can also use the handy
 console.table() method to output the values of arrays or objects in an easy-to-read tabular format:
console.table(output)
output: The array or object (as a variable or as a literal) you want to view in the Console
For debugging purposes, you most often use the Console to keep an eye on the values of variables, object properties, and expressions. That is, when your code sets or changes the value of something, you insert a console.log() (or console.table()) statement that outputs the new value. When the script execution is complete, you can open the Console and then check out the logged value or values.
Executing code in the Console
One of the great features of the Console is that it's interactive, which means not only can you see messages generated by the browser or by your console.log() statements, but you can also type code directly into the Console. That is, you can use the Console to execute expressions and statements. There are many uses for this feature:
- You can try some experimental expressions or statements to see their effect on the script.
- When the script is paused, you can output the current value of a variable or property.
- When the script is paused, you can change the value of a variable or property. For example, if you see that a variable with a value of zero is about to be used as a divisor, you could change that variable to a nonzero value to avoid crashing the script.
- When the script is paused, you can run a function or method to see if it operates as expected under the current conditions.
Each browser’s Console tab includes a text box (usually marked by a greater-than > prompt) that you can use to enter your expressions or statements.
You can execute multiple statements in the Console by separating each statement with a semicolon. For example, you can test a for… loop by entering a statement similar to the following:
for (var i=1; i < 10; i++){console.log(i**2); console.log(i**3);}
If you want to repeat an earlier code execution in the Console, or if you want to run some code that's very similar to code you ran earlier, you can recall statements and expressions that you used in the current browser session. Press the Up Arrow key to scroll back through your previously executed code; press the Down Arrow key to scroll forward through your code.
Pausing Your Code
Pausing your code midstream lets you see certain elements such as the current values of variables and properties. It also lets you execute program code one statement at a time so you can monitor the flow of the script.
When you pause your code, JavaScript enters break mode, which means the browser displays its debugging tool and highlights the current statement (the one that JavaScript will execute next). Figure 9-4 shows a script in break mode in Chrome’s debugger (the Sources tab).
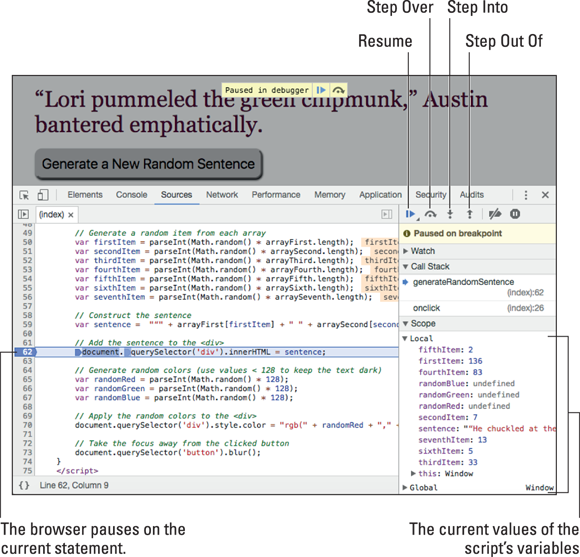
FIGURE 9-4: When you invoke break mode, the web browser displays its debugging tool and highlights the statement that it will execute next.
Entering break mode
JavaScript gives you two ways to enter break mode:
- By setting breakpoints
- By using a
debuggerstatement
Setting a breakpoint
If you know approximately where an error or logic flaw is occurring, you can enter break mode at a specific statement in the script by setting up a breakpoint. Here are the steps to follow:
- Display your web browser’s developer tools and switch to the debugging tool.
-
Open the file that contains the JavaScript code you want to debug.
How you do this depends on the browser: In Chrome and Firefox, press Ctrl+P (Windows) or ⌘ +P (Mac).
-
Locate the statement where you want to enter break mode.
JavaScript will run every line of code up to, but not including, this statement.
- Click the line number to the left of the statement to set the breakpoint (see Figure 9-5).
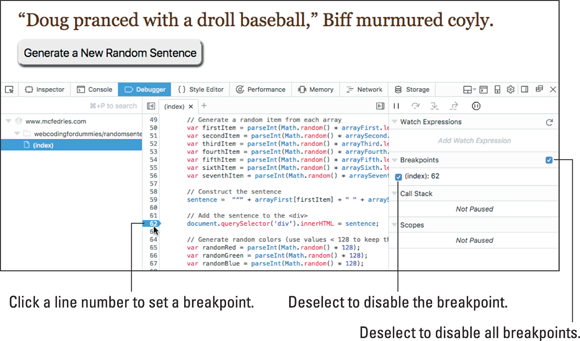
FIGURE 9-5: In the browser’s debugging tool, click a line number to set a breakpoint on that statement.
To remove a breakpoint, most browsers give you three choices:
- To disable a breakpoint temporarily, deselect the breakpoint’s checkbox in the Breakpoints list.
- To disable all your breakpoints temporarily, deselect the Breakpoints checkbox.
- To remove a breakpoint completely, click the statement’s line number.
Entering break mode using a debugger statement
When developing your web pages, you’ll often test the robustness of a script by sending it various test values or by trying it out under different conditions. In many cases, you’ll want to enter break mode to make sure things look okay. You could set breakpoints at specific statements, but you lose them if you close the file. For something a little more permanent, you can include a debugger statement in a script. JavaScript automatically enters break mode whenever it encounters a debugger statement.
Here's a bit of code that includes a debugger statement:
// Add the sentence to the <div>
document.querySelector('div').innerHTML = sentence;
// Generate random colors (use values < 128 to keep the text dark)
var randomRed = parseInt(Math.random() * 128);
var randomGreen = parseInt(Math.random() * 128);
var randomBlue = parseInt(Math.random() * 128);
debugger;
Exiting break mode
To exit break mode, you can use either of the following methods in the browser’s debugging tool:
- Click the Resume button.
- Press the browser’s Resume keyboard shortcut:
- Chrome: Press Ctrl+ (Windows), or ⌘ + (Mac), or F8.
- Firefox: Press Ctrl+ (Windows), or ⌘ + (Mac), or F8.
Stepping through Your Code
One of the most common (and most useful) debugging techniques is to step through the code one statement at a time. This lets you get a feel for the program flow to make sure that things such as loops and function calls are executing properly. You can use three techniques:
- Stepping into some code
- Stepping over some code
- Stepping out of some code
Stepping into some code
In break mode, stepping into some code means two things:
- You execute the code one line at a time.
- If the next statement to run is a function call, stepping into it takes you into the function and pauses at the function’s first statement. You can then continue to step through the function until you execute the last statement, at which point the browser returns you to the statement after the function call.
To step into your code, set a breakpoint and then after your code is in break mode, do one of the following to step through a single statement:
- Click the Step Into button.
- Press the browser’s Step Into keyboard shortcut:
- Chrome: Press Ctrl+; or F11 (Windows) or ⌘ +; or F11 (Mac).
- Firefox: Press F11 (Windows) or ⌘ +; or F11 (Mac).
Keep stepping through until the script ends or until you’re ready to resume normal execution.
Stepping over some code
Some statements call other functions. If you’re not interested in stepping through a called function, you can step over it. This means that JavaScript executes the function normally and then resumes break mode at the next statement after the function call.
To step over a function, first either step through your code until you come to the function call you want to step over, or set a breakpoint on the function call and refresh the web page. Once you’re in break mode, you can step over the function using any of the following techniques:
- Click the Step Over button.
- Press the browser’s Step Over keyboard shortcut:
- Chrome: Press Ctrl+' or F10 (Windows) or ⌘ +' or F10 (Mac).
- Firefox: Press F10 (Windows) or ⌘ +' or F10 (Mac).
Stepping out of some code
I’m always accidentally stepping into functions I’d rather step over. If the function is short, I just step through it until I’m back in the original code. If the function is long, however, I don’t want to waste time stepping through every statement. Instead, I invoke the Step Out feature using any of these methods:
- Click the Step Out button.
- Press the browser’s Step Out keyboard shortcut:
- Chrome: Press Ctrl+Shift+; or Shift+F11 (Windows) or ⌘ +Shift+; or Shift+F11 (Mac).
- Firefox: Press Shift+F11 (Windows) or ⌘ +Shift+; or Shift+F11 (Mac).
JavaScript executes the rest of the function and then reenters break mode at the first line after the function call.
Monitoring Script Values
Many runtime and logic errors are the result of (or, in some cases, can result in) variables or properties assuming unexpected values. If your script uses or changes these elements in several places, you’ll need to enter break mode and monitor the values of these elements to see where things go awry. The browser developer tools offer three main ways to keep an eye on your script values:
- View the current value of a single variable.
- View the current values of all the variables in both the local and global scopes.
- View the value of a custom expression or object property.
Viewing a single variable value
If you just want to eyeball the current value of a variable, the developer tools in both Chrome and Firefox make this straightforward:
- Enter break mode in the code that contains the variable you want to check.
-
If the script hasn’t yet set the value of the variable, step through the code until you’re past the statement that supplies the variable with a value.
If you’re interested in how the variable’s value changes during the script, step through the script until you’re past any statement that changes the value.
-
Hover the mouse over the variable name.
The browser pops up a tooltip that displays the variable’s current value. Figure 9-6 shows an example.

FIGURE 9-6: In break mode, hover the mouse pointer over a variable name to see the variable’s current value.
Viewing all variable values
Most of the values you’ll want to monitor will be variables, which come in two flavors (or scopes):
- Local scope: These are variables declared in the current function and are available only to that function.
- Global scope: These are variables declared outside of any function, which makes them available to any script or function on the page.
For a more detailed look at variable scope, see Book 3, Chapter 5.
When you’re in break mode, the debugging tool in both Chrome and Firefox displays a pane on the right that includes a section that shows the current values of all your declared variables:
- Chrome: The section is named Scope and it includes two lists: Local (for local variables) and Global (for global variables). I pointed out Chrome’s Scope section back in Figure 9-4.
- Firefox: The section is named Scopes and it includes two lists: one named after the current function that includes the function’s local variables, and one named Window: Global that includes the script’s global variables. Figure 9-7 shows an example.
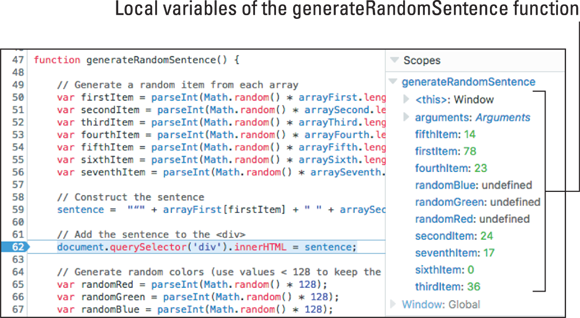
FIGURE 9-7: In break mode, Firefox’s Scopes section shows the current values of the local and global variables.
In Figure 9-7, notice that some of the local variables show the value undefined. Those variables are undefined because the script hasn't yet reached the point where the variables are assigned a value.
Adding a watch expression
Besides monitoring variable values, JavaScript also lets you monitor the results of any expression or the current value of an object property. To do this, you need to set up a watch expression that defines what you want to monitor. These watch expressions appear in a special section of the browser’s debugging tools. Here’s how to add a watch expression in Chrome and Firefox:
- Chrome: In break mode, open the Watch section in the right pane, then click Add Expression (+). Type your expression in the text box that appears, and then press Enter or Return.
- Firefox: In break mode, open the Watch Expressions section in the right pane, then click Add Watch Expression (+). Type your expression in the text box that appears, and then press Enter or Return.
The browser adds the expression and then displays the current value of the expression to the right. Figure 9-8 shows an example in Firefox.
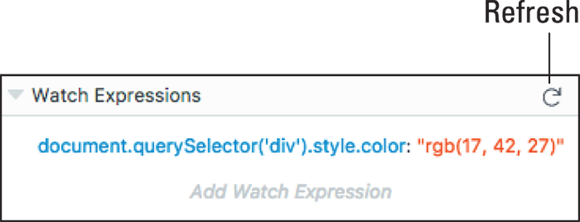
FIGURE 9-8: In Firefox, click Add Watch Expression to define a watch expression for your code.
You can use the following techniques to work with your watch expressions:
- Edit a watch expression. Double-click the expression, edit it, and then press Enter or Return.
- Update the values of your watch expressions. Click the Refresh button (located in the upper- right corner of Figure 9-8).
- Delete a watch expression. Hover the mouse over the watch expression you want to remove, then click the Delete icon that appears to the right of the expression.
More Debugging Strategies
Debugging your scripts can be a frustrating job, even during the best of times. Here are a few tips to keep in mind when tracking down programming problems:
- Indent your code for readability. JavaScript code is immeasurably more readable when you indent the code within each statement block. Readable code is that much easier to trace and decipher, so your debugging efforts have one less hurdle to negotiate. How far you indent is a matter of personal style, but two or four spaces is typical:
function myFunction() {Each statement in this functionblock is indented four spaces.}If you nest one block inside another, indent the nested block by another four spaces:
function myFunction() {Each statement in this functionblock is indented four spaces.for (var counter = 1; counter < 5; counter++) {Each statement in this nested for()block is indented another four spaces.}} - Break down complex tasks. Don’t try to solve all your problems at once. If you have a large script or function that isn’t working right, test it in small chunks to try to narrow down the problem.
- Break up long statements. One of the most complicated aspects of script debugging is making sense out of long statements (especially expressions). The Console window can help (you can use it to print parts of the statement), but it’s usually best to keep your statements as short as possible. Once you get things working properly, you can often recombine statements for more efficient code.
- Comment out problem statements. If a particular statement is giving you problems, you can temporarily deactivate it by placing two slashes (
\) at the beginning of the line. This tells JavaScript to treat the line as a comment. If you have a number of statements you want to skip, place*at the beginning of the first statement and*at the end of the last statement. - Use comments to document your scripts. Speaking of comments, it's a programming truism that you can never add enough explanatory comments to your code. The more comments you add, the easier your scripts will be to debug.
Top Ten Most Common JavaScript Errors
When you encounter a script problem, the first thing you should do is examine your code for the most common errors. To help you do that, here’s a list of the ten most common errors made by both beginning and experienced programmers:
- JavaScript keywords as variable names: JavaScript has many reserved words and keywords that are built into the language, so it’s common to accidentally use one of these words as a variable or function name. Double-check your names to make sure you’re not using any reserved words, or the names of any objects, properties, or methods.
- Misspelled variables and other names: Check your variable and function names to make sure you spell them consistently throughout the script. Also, check the spelling of the objects, properties, and methods you use.
- Misused uppercase and lowercase letters: JavaScript is a case-sensitive language, which means that it treats each letter differently depending on whether it’s uppercase or lowercase. For example, consider the following two statements:
var firstName = "Millicent";var message = "Welcome " + firstname;The first statement declares a variable named
firstName, but the second statement usesfirstname. This code would generate the errorfirstname is not defined(or something similar, depending on the browser) because JavaScript thinks thatfirstnameis a different (and uninitialized) variable. - Mismatched quotation marks: In any statement where you began a string literal with a quotation mark (
"or'), always check to make sure that you included the corresponding closing quotation mark at the end of the string. Also, check to see if you used one or more instances of the same quotation mark within the string. If so, edit the string to use the proper escape sequence ("or'), instead:// This is illegalvar myString1 = "There are no "bad" programs.";// This is legalvar myString2 = "There are no "bad" programs."; -
Mismatched parentheses: Look for statements that contain a left parenthesis —
(— and make sure there's a corresponding right parenthesis —). This also applies to square brackets —[and]. For complex expressions that include three or more sets of parentheses, a quick match-up check is to count the number of left parenthesis in the expression, and then count the number of right parentheses. If these numbers don't match, then you know you have a mismatch somewhere in the expression. - Missed parentheses after function names: Speaking of parentheses, if your script calls a function or method that doesn’t take any arguments, check that you included the parentheses —
()— after the name of the function or method:function tryThis() {alert("Parentheses travel in pairs!");}// This won't worktryThis;// This willtryThis(); -
Improper use of braces: JavaScript uses braces to mark the start (
{) and end (}) of statement blocks associated with functions, tests involvingif()andswitch(), and loops, includingfor(),while(), anddo…while(). It's very easy to miss one or both braces in a block, and it’s even easier to get the braces mixed up when nesting one test or loop inside another. Double-check your braces to make sure each block has both an opening and a closing brace. One way to ensure that you don’t miss any braces is to position them consistently throughout your script. For example, many people prefer to use the traditional style for brace positions: keyword {statements}(Here,
keywordmeans the statement — such asfunctionorif()— that defines the block.) If you prefer this style, use it all through your script so that you know exactly where to look for each brace.An easy way to ensure that you never forget a closing brace is to enter it immediately after entering the opening brace. That is, you type
{, press Enter twice, and then type}.Also, use indentation consistently for the statements within the block. This makes it much easier to see the braces, particularly when you have one block nested within another.
- Using
=or==instead of===: The identity operator (===) is one of the least intuitive JavaScript features, because the assignment operator (=) feels so much more natural. The equality operator (==) can cause problems because it often converts the data types before making the comparison. Therefore, check all your comparison expressions to make sure you always use===instead of=or==. - Conflicts between local and global variables: A global variable is available throughout the entire page, even within functions. So, within a function, make sure that you don't declare and use a variable that has the same name as a global variable.
- The use of an page element before it’s loaded: JavaScript runs through a page’s HTML one line at a time and checks the syntax of each JavaScript statement as it comes to it. If your code refers to an element (such as a form field) that JavaScript hasn’t come to yet, it will generate an error. Therefore, if your code deals with an element, always place the script after the element in the HTML file.
Top Ten Most Common JavaScript Error Messages
To help you decipher the error messages that JavaScript throws your way, here’s a list of the ten most common errors and what they mean:
Syntax error: This load-time error means that JavaScript has detected improper syntax in a statement. The error message almost always tells you the exact line and character where the error occurs (see Figure 9-1).Expected (orMissing (: These messages mean that you forgot to include a left parenthesis:function changeBackgroundColor newColor) {If you forget a right parenthesis, instead, you'll see
Expected )orMissing ):function changeBackgroundColor (newColor{Expected {orMissing { before function body: These errors tell you that your code is missing the opening brace for a function:function changeBackgroundColor (newColor)statements}If you're missing the closing brace, instead, you’ll see the errors
Expected }orMissing } after function body.Unexpected end of inputorMissing } in compound statement: These messages indicate that you forgot the closing brace in anif()block or other compound statement:if (currentHour < 12) {console.log("Good morning!");} else {console.log("Good day!");If you forget the opening brace, instead, you'll get a
Syntax errormessage that points, confusingly, to the block’s closing brace.Missing ;orMissing ; after for-loop initializer|condition: These errors mean that afor()loop definition is missing a semicolon (;), either because you forgot the semicolon or because you used some other character (such as a comma):for (var counter = 1; counter < 5, counter++) {Unexpected identifierorMissing ; before statement: These errors tell you that the previous statement didn't end properly for some reason, or that you’ve begun a new statement with an invalid value. In JavaScript, statements are supposed to end with a semicolon (;), but this is optional. So if JavaScript thinks you haven’t finished a statement properly, it assumes it’s because a semicolon is missing. For example, this can happen if you forget to include the opening/*to begin a multiple-line comment:Start the comment (oops!)Close the comment */Xis not defined: This message most often refers to a variable namedXthat has not been declared or initialized, and that you're trying to use in an expression. If that’s the case, declare and initialize the variable. Another possible cause is a string literal that isn’t enclosed in quotation marks. Finally, also check to see if you misspelled the variable name:var grossProfit = 100000;var profitSharing = grossPrifit * profitSharingPercent;Xis not an objectorXhas no properties: These messages mean that your code refers to an object that doesn't exist, or to a property that doesn’t belong to the specified object. Check to see if you misspelled the object or property or, for the second case, that you’re using the wrong object:document.alert("Nope!")Unterminated string constantorUnterminated string literal: Both of these messages mean that you began a string literal with a quotation mark, but forgot to include the closing quotation mark:var greeting = "Welcome to my Web site!A script on this page is causing [browser name] to run slowly. Do you want to abort the script?orLengthy JavaScript still running. Continue?: These errors tell you that your code has probably fallen into an infinite loop. You don’t get any specific information about what’s causing the problem, so you’ll need to scour your code carefully for the possible cause.