14
Piezoelectric Properties of Na1−xKxNbO3 near x = 0.475, Morphotropic Phase Region
Surendra Singh and Narayan S. Panwar
H.N.B. Garhwal University, Department of Instrumentation Engineering, Srinagar (Garhwal), Uttarakhand, 246174, India
14.1 Introduction
Certain materials have a property that on applying mechanical pressure, they accumulate charges on their surfaces and the produced charges are proportional to the applied mechanical pressure; this effect is known as the “Direct Piezoelectric Effect.” This phenomenon was discovered by Pierre and Jacques Curie (1880) in quartz. The prefix “piezo” is a Greek word meaning “to press.” Materials also show this phenomenon conversely, strain is produced by the applied electric field, known as “converse piezoelectric effect.” Converse piezoelectric effect was discovered by Gabriel Lippmann (1881). Piezoelectric properties of materials depend on the crystal symmetry and the locations of ions in the crystal unit cell. There are 32 point groups of symmetry in all, which can be arranged in 7 basic crystal systems, viz., triclinic, monoclinic, orthorhombic, tetragonal, rhombohedral (trigonal), hexagonal, and cubic, in order of ascending symmetry. Of the 32 point groups of symmetry, 21 classes are non‐centrosymmetric. Occurrence of non‐centrosymmetry is a basic required condition for the existence of the piezoelectricity. Out of these 21 classes, 20 show piezoelectric effect, on which charges are accumulated on the crystal surfaces on applying the suitable amount of mechanical pressure, and one class, the point group (432) is not piezoelectric due to the other combined symmetry elements. Out of these 20 piezoelectric classes, 10 exhibit pyroelectric effect. The piezoelectricity is greatly influenced by the symmetry of the crystal. With the application of external mechanical force, a less symmetric crystal produces higher piezoelectricity.
In the piezoelectric substance, there is a linear relationship between the applied stress (Xik) and the produced surface charge density (Di), which can be expressed as,
where dijk are “direct piezoelectric coefficients.” Conversely, with the application of an electric field E, the piezoelectric materials change their dimensions (they expand or contract), showing converse piezoelectric effect. The produced mechanical strain (Sij) on applying electric field (Ek) can be related as,
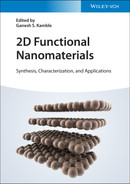
where d*ijk are known as the “converse piezoelectric coefficients.” The sign of the produced surface charge Di and mechanical strain Sij depends on the applied mechanical pressure and electric field directions, respectively. All ferroelectric materials show piezoelectric effect, but all piezoelectric materials may not show ferroelectric effect. Ferroelectric materials exhibit hysteresis loop, between polarization and applied field. The polarization (P) vs. applied field (E) plot (PE hysteresis loop) of an ideal ferroelectric material is shown in Figure 14.1. On gradually increasing the applied electric field, the polarization also increases gradually and reaches to saturation (Psat). Psat is the maximum polarization attained by the specimen (Figure 14.1). Now with decreasing electric field, polarization decreases and, at the zero applied electric field, there is some residual polarization, known as the “remnant polarization” (Pr). The residual polarization in specimen can be reduced by increasing the strength of the applied electric field in reverse direction, i.e. by changing the polarity of the electric field and increasing its strength. The reverse electric field at which polarization of the material specimen becomes zero is defined as the “coercive field” (Ec). At the coercive field (Ec), polarization crosses the E‐axis with increasing field magnitude value in the reverse direction, Figure 14.1.
The longitudinal mode is the most common operated mode in piezoelectric ceramic actuators, where the resultant strain is measured in the direction parallel to the applied field, and the coupling is via the piezoelectric coefficient d33. When a field is applied toward the symmetrical axis, but the resultant strain produced is measured perpendicular to the applied field, the coupling is via the coefficients d31 and d32. These modes are often used in piezoelectric sensor applications.
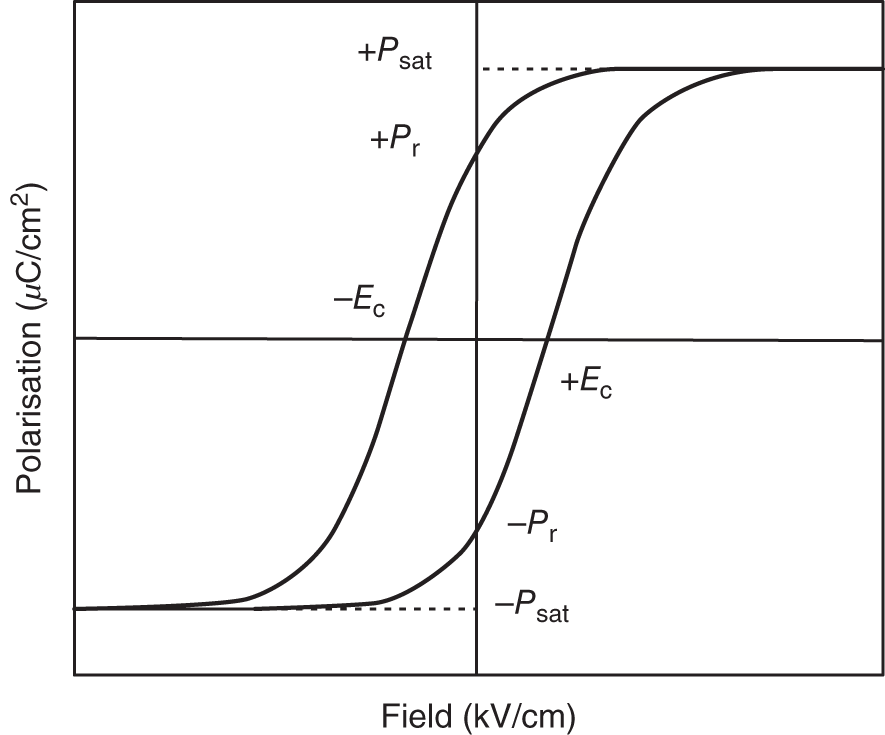
Figure 14.1 Typical PE (hysteresis) loop for a ferroelectric material.
Lead‐based materials, e.g. lead zirconate (PZ), lead titanate (PT), etc., and their solid solutions, e.g. lead zirconate titanate (PZT), have been reported to exhibit high piezoelectric properties. However, the environmental concerns led the researchers to look for lead‐free ceramics. Perovskite sodium‐potassium niobate (Na1−xKxNbO3), (x = 0 to 1) system has been quite attractive in the search of lead‐free transducer ceramics [1]. Sodium‐potassium niobate (NKN) system exhibits several phase transitions, in a certain temperature range, 600 and −200 °C [2–5]. At room temperature (RT), Voudsen [6] suggested that NKN have orthorhombic structure with a perovskite subcell but the perovskite units of monoclinic structure [6, 7]. Mixed binary or ternary solutions show extremal physical properties near certain compositions, known as morphotropic phase boundary (MPB). PZT ceramics show excellent piezoelectric properties near MPB [8, 9]. The dielectric and structural measurements on Na1−xKxNbO3 ceramics show morphotropic phase boundary, near the compositions with x = 0.175 [10], x = 0.32 [11], x = 0.475 [12], and x = 0.500 [2, 13, 14], indicating technologically potential electrophysical properties near these compositions. NKN system has one most interesting property of its actuating performance at comparatively high fields, which has been characterized by large strain S, and can be expressed as d*33 (Smax/Emax) [15].
Piezoelectric materials may be applicable in resonators, watches, and ceramic filters; surface acoustic wave (SAW) filters; ultrasonic transducers, delay lines, fish finders, and diagnostic acoustic devices, underwater acoustic devices, underwater microphones, and speakers. Piezoelectric materials are also used in generating high voltage for ignition and in transformers. There is a wide scope of research in the field of ferroelectrics and piezoelectrics to explore materials' properties, materials' manufacturing, techniques and applications, etc.
The present study is focused on the composition dependence of piezoelectric properties of NKN system, near equimolar (Na, K) morphotropic niobate compositions. Na1−xKxNbO3 (0.465 ≤ x ≤ 0.485) ceramic samples were prepared by solid‐state reaction route using double sintering. To investigate the piezoelectric properties, near x = 0.475, measurement of remnant polarization, coercive field, converse piezoelectric coefficient (d*33), and polarization current were carried out in the prepared samples.
14.2 Experimental Procedure
Ceramic pellets of Na1−xKxNbO3, (0.465 ≤ x ≤ 0.485), were prepared using the conventional solid‐state reaction method. The raw materials, Na2CO3, K2CO3, and Nb2O3, with purity better than 99.9% (from Merck KGaA, Germany) were dried at 200 °C for two hours to remove moisture and weighed in stoichiometric ratios. The method used to prepare the different compositions was similar to that described in a previous study [14]. Sintered pellets were electroded, with air dryable conducting paste of silver, in metal–insulator–metal (MIM) configuration, for piezoelectric measurements. Polarization and piezoelectric parameters were measured using a ferroelectric‐(PE loop tracer) and piezometer (AixACCT Systems, GmbH).
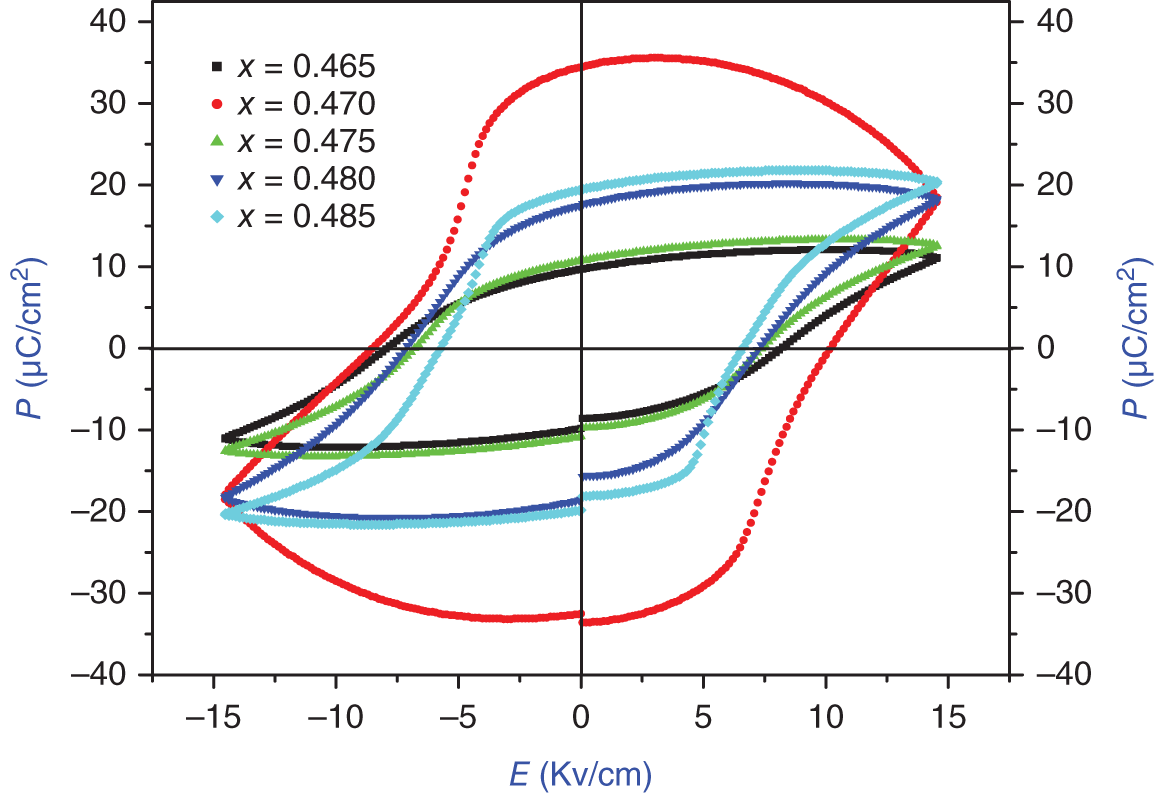
Figure 14.2 Polarization–electric field loop for prepared Na1−xKxNbO3 samples, at 14 kV/cm.
14.3 Results and Discussion
The measured P–E hysteresis loops at RT, for unpoled Na1−xKxNbO3 samples, with the application of 14 kV/cm field, at frequency 1 Hz, are shown in Figure 14.2. All the NKN prepared samples show PE hysteresis and confirm the ferroelectric nature. Figure 14.3 shows the variation of strain (%) with applied field. Figure 14.4 shows the variation of remnant polarization (Pr) and coercive field (Ec) in the prepared NKN ceramics with composition (x). The value of remnant polarization in the Na1−xKxNbO3 ceramics was found to be 17.75 μC/cm2 for the composition with x = 0.485, which decreased to 10.21 μC/cm2 for x = 0.475. Further, with increasing x, value of the remnant polarization was found to decrease. This may be related to the increased distortion in the lattice parameters due to MPB in the NKN system, near x = 0.475. The coercive field (Er) value was also observed increasing from 6.66 to 9.74 kV/cm, as x decreases from 0.485 to 0.470, in the NKN ceramics; further on decreasing x, the coercive field was found to decrease, Figure 14.5. Due to the increment in distortion in the cell by decreasing the volume of switchable domains, the coercive field value also increases [16]. The shape of the hysteresis loop (P–E loop) was found depending upon the microstructure, defects, stress, and preparation methods [17–19].
The variation of converse piezoelectric coefficient (d*33) with composition (x), at RT, in NKN ceramics is shown in Figure 14.5. For the composition, with x = 0.485, value of conversed piezoelectric coefficient was found 336 pm/V, which decreased to 202 pm/V, for x = 0.475, and suddenly increased to 314 pm/V, for x = 0.470, and thereafter continuously decreases with decreasing x. Figure 14.6 shows the variation of polarization current with x in NKN compositions. The anomalous rise in the d*33 value, at x = 0.470, may be due to the structural change with composition, near the MPB. P–E loops [20, 21] and piezoelectric parameters mostly depend on crystal symmetry, grain size, and density of ceramics [21, 22]. In the piezoelectric materials, the grain boundary is a low permittivity region; therefore, its polarization may be quite low. The numbers of grain boundaries decrease as grain sizes increase and, with larger grains, the remnant polarization increases [20]. The preparation method affects the grain boundary properties and morphology of the NKN ceramics. The space‐charge accumulation is affected by the grain boundary resistivity [23–31]. The piezoelectric properties may be controlled by the controlling the grain size and the grain boundary resistivity, using the preparations method. The present observations show that ceramic processing conditions, structure, and composition (x) greatly influence the ferroelectric properties of the NKN system.
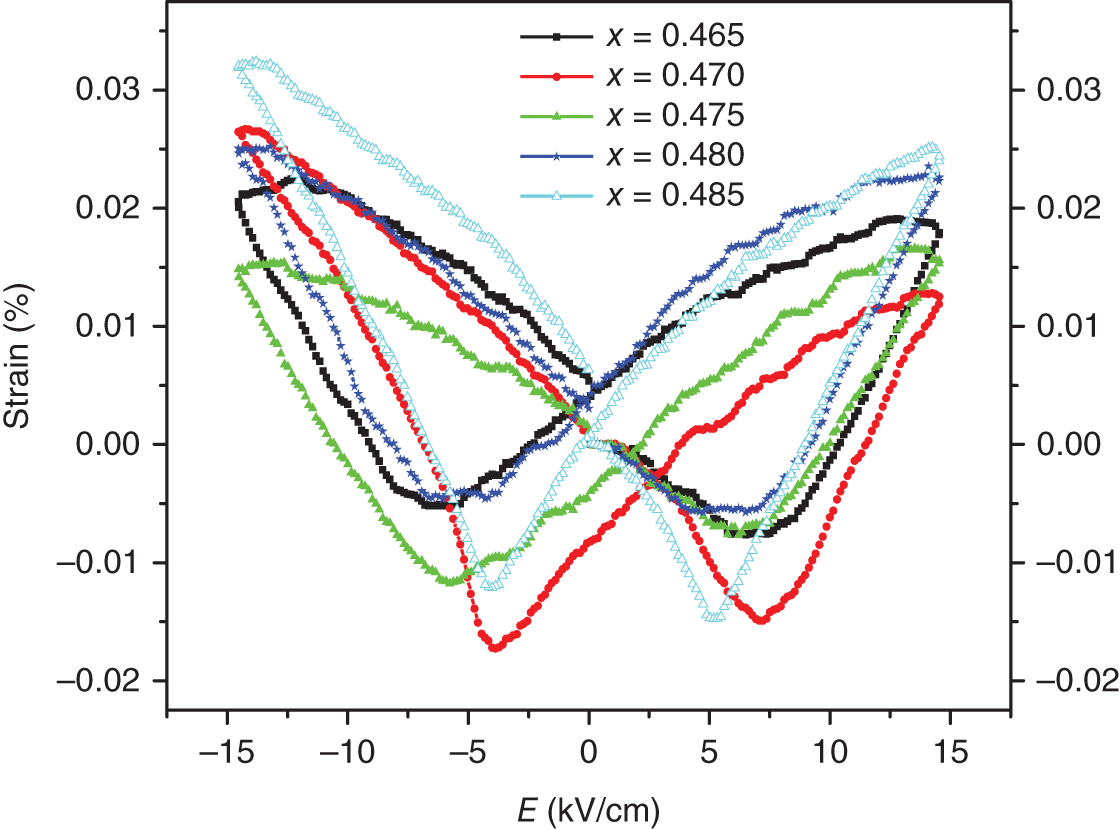
Figure 14.3 Variation of strain (%) with applied field (kV/cm), in Na1−xKxNbO3 ceramic pellets.
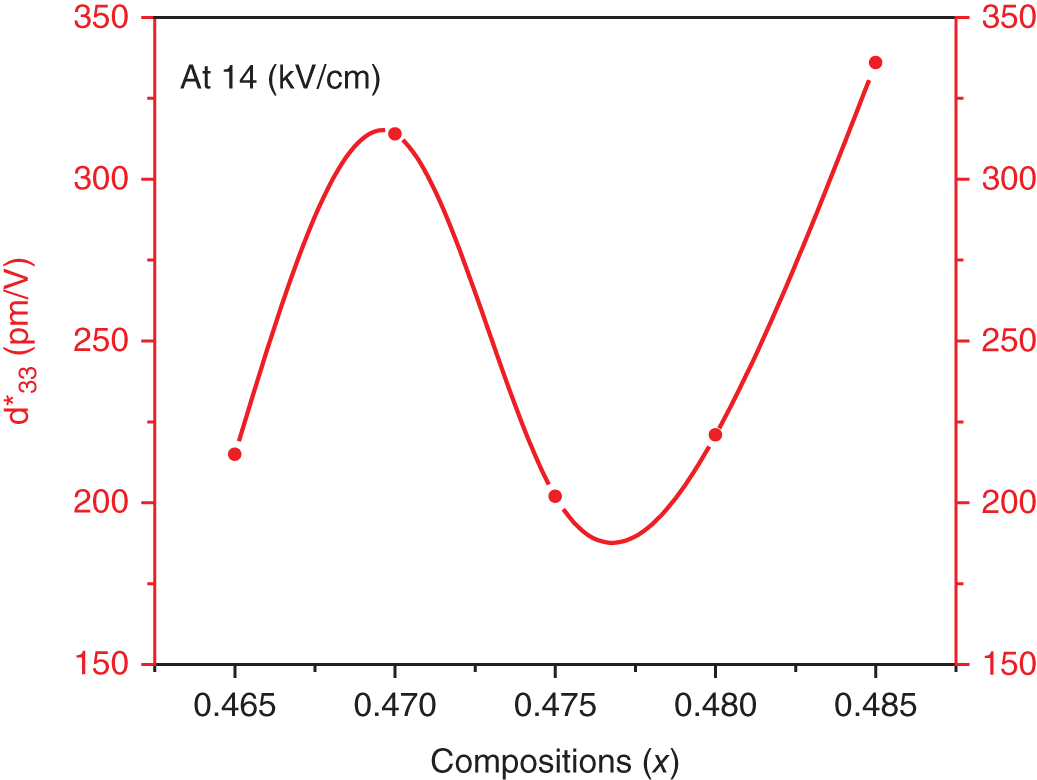
Figure 14.4 Variation of Pr and Ec with composition (x) in NKN ceramics.
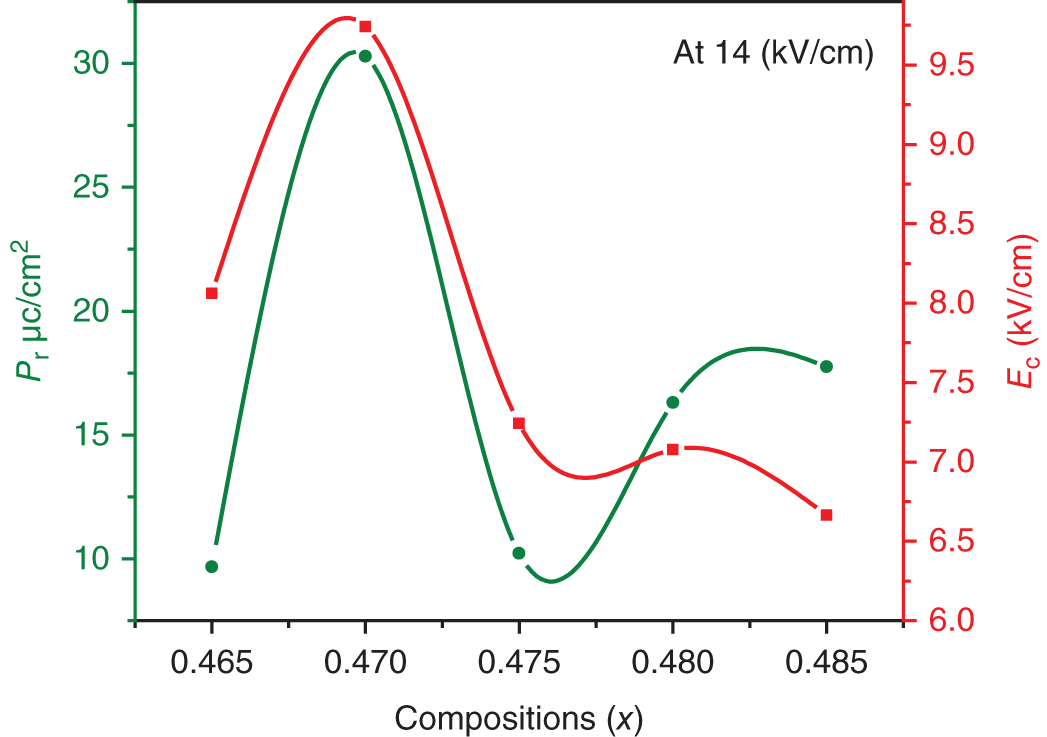
Figure 14.5 Composition (x) dependence of converse piezoelectric coefficient (d*33) in NKN ceramics.

Figure 14.6 Variation of polarization current and applied electric field, in NKN ceramics, at 14 kV/cm.
References
- 1 Saito, Y., Takao, H., Tani, T. et al. (2004). Nature 432: 84–87.
- 2 Egerton, L. and Dillon, D.M. (1959). J. Am. Ceram. Soc. 42: 438–442.
- 3 Shirane, G., Newman, R., and Pepinsky, R. (1954). Physiol. Rev. 96: 581–588.
- 4 Tennery, V.J. and Hang, K.W. (1968). J. Appl. Phys. 39: 4749–4753.
- 5 Tennery, V.J. (1966). J. Am. Ceram. Soc. 49: 376–379.
- 6 Voudsen, P. (1951). Acta Crys. 4: 373–376.
- 7 Singh, S., Negi, J., and Panwar, N.S. (2019). Ceram. Int. 45: 13067–13070.
- 8 Jaffe, B., Cook, W.R., and Jaffe, J.H. (1971). Piezoelectric Ceramics. NewYork, NY: Academic Press.
- 9 Rodel, J., Jo, W., Seifert, K.T.P. et al. (2009). J. Am. Ceram. Soc. 92: 1153–1177.
- 10 Kandari, A.S., Lingwal, V., and Panwar, N.S. (2010). Ferroelectrics 396: 18–26.
- 11 Negi, J., Singh, S., and Panwar, N.S. (2019). Phase Transitions 92: 149–158.
- 12 Kandari, A.S., Kandari, K., Lingwal, V. et al. (2009). Ferroelectrics 393: 121–129.
- 13 Lingwal, V. and Panwar, N.S. (2004). Ferroelectrics 300: 3–14.
- 14 Singh, S., Negi, J., and Panwar, N.S. (2018). J. Phys. Chem. Solids 123: 311–317.
- 15 Hao, J., Bai, W., Li, W. et al. (2013). J. Appl. Phys. 114: 044103.
- 16 Mitra, S., Kulkarni, A.R., and Prakash, O. (2013). J. Appl. Phys. 114: 064106.
- 17 Damjanovic, D. (1998). Rep. Prog. Phys. 61: 1267–1324.
- 18 Nalwa, H.S. (1999). Handbook of Low and High Dielectric Constant Materials and Their Applications. New York, NY: Academic Press.
- 19 Ghayour, H. and Abdellahi, M. (2016). Powder Technol. 292: 84–93.
- 20 Mudinepalli, V.R., Feng, L., Lin, W.C., and Murty, B.S. (2015). J. Adv. Ceram. 4: 46–53.
- 21 Singh, S. and Panwar, N.S. (2020). Ferroelectrics 558: 240–245.
- 22 Kamel, T.M. (2008). J. Eur. Ceram. Soc. 28: 851–861.
- 23 Shen, Z.Y. and Li, J.F. (2010). J. Ceram. Soc. Jpn. 118: 940–943.
- 24 Haertling, G.H. (1964). Am. Ceram. Soc. Bull. 43: 875–879.
- 25 Webster, A.H., Weston, T.B., and Can, J. (1968). Ceram. Soc. 37: 51–54.
- 26 Martirena, H.T. and Burfoot, J.C. (1974). J. Phys. C: Solid State Phys. 7: 3182–3192.
- 27 Surowiak, Z., Kupriyanov, M.F., and Czekaj, D. (2001). J. Eur. Ceram. Soc. 21: 1377–1381.
- 28 Zheng, P., Zhang, J.L., Tan, Y.Q., and Wang, C.L. (2012). Acta Mater. 60: 5022–5030.
- 29 Huan, Y., Wang, X., Fang, J., and Li, L. (2013). J. Am. Ceram. Soc. 96: 3369–3371.
- 30 Zhang, J.L., Ji, P.F., Wu, Y.Q. et al. Appl. Phys. Lett. 104: 2014, 222909.
- 31 Hoshina, T. (2013). J. Ceram. Soc. Jpn. 121: 156–161.