
14
Autonomous Gust Alleviation in UAVs
Ya Wang1 and Daniel J. Inman2
1 Department of Mechanical Engineering, SUNY, Stony Brook, NY, USA
2 Department of Aerospace Engineering, University of Michigan, Ann Arbor, MI, USA
14.1 Introduction
When a gust hits a small, umnanned air vehicle, stability can easily be lost. Various active control schemes have been proposed in the literature to cancel wing vibrations induced by gusts (see for instance Regan and Jutte 2012). The expression ‘gust alleviation’ often refers to load alleviation. Here, however, we are referring specifically to reducing the vibrations induced in a wing by a gust using harvested energy. The whole control scheme is automatic, or autonomous, in a self‐contained way, and does not reduce the power available to the propulsion system. In particular we focus on a system that uses energy absorbed from wing vibrations during normal flight to power a control system that will cancel vibrations induced when the aircraft is subject to a gust. In order to focus on the details of the system design, the air‐flow is modelled in the simplest way, but using the Dryden power spectral density (PSD); see for instance McClean (1990). Other simplifying assumptions include linearity of the structural response and simplified modelling of the composite structure using the rule of mixtures. The basic idea put forth here is that normal “clear sky” induced wing vibrations can be harvested. The resulting energy stored is released later when the aircraft experiences a gust; it is used to run an active feedback control system for gust alleviation. The discussion here is limited to looking at wing vibrations only and does not consider rigid‐body motions (Richardson et al. 2011). The focus is on how to use a limited amount of energy to control wing vibrations caused by a gust.
Flutter suppression for UAVs is also an issue. In May 2014, Lockheed Martin announced that its X‐56A UAV will be fitted with an anti‐flutter system as it moves to use lighter, more flexible wings. The move to lighter wings provides the opportunity for a drastic increase in efficiency, but it makes the plane much more susceptible to flutter and gusts. In fact, UAVs in general are more likely to push the flutter envelope than manned aircraft are. Thus flutter suppression, while not specifically addressed here, provides a motivation for the use of harvested energy to perform control. Suppression of flutter by simply adding an energy‐harvesting component is discussed by de Marqui et al. (2011).
The system discussed here has the following components. First an energy‐harvesting scheme collects energy from the vibrations of the wing under normal flight conditions. An energy storage system is provided by a thin‐film battery. A sensor and actuator are needed for implementing a control law. Since the control law must use as little energy as possible, a controller reduces the energy required to suppress vibrations. The system, along with the controlling electronics, is then integrated into the spar of a small UAV and bench tested to both validate the modelling, hence the predictions, and to illustrate a working system. This approach is the first to attempt gust alleviation without resorting to the use of discrete control surfaces (ailerons).
14.2 The Composite Spar
The heart of the autonomous gust alleviation system is a multifunctional spar. A multifunctional structure is a structure that serves several functions besides its primary function of providing strength and packaging. The idea grew out of work on structural batteries performed by the US Naval Research Labs (Thomas and Qidwa 2005). This showed a weight saving by integrating a battery function into a structural wing. Here we examine a wing spar that performs not only its strength function but also the functions of computing, harvesting, sensing, energy storage and control. The energy‐harvesting component uses the piezoelectric effect (Erturk and Inman 2011) to transduce low‐level wing vibrations into usable electrical energy. Recall that the piezoelectric effect allows certain materials to emit an electric field when subject to a mechanical strain and experiences a mechanical strain when a voltage is applied across the material. There are a variety of different types of piezoelectric materials, so a question immediately arises regarding which one is best to use in this situation. Furthermore, the piezoelectric effect is also used for sensing and for actuation, the key elements in a closed‐loop control system. Again, the question arises as to which material makes the best choice for each function. Ideally, the answer would be the same for all three functions of harvesting, sensing and actuation. Besides these functions, the composite spar must also provide computing circuitry to manage the harvesting and storage electronics as well as the gust‐alleviation control law, making the system autonomous.
The multifunctional wing spar of interest here is illustrated schematically in Figure 14.1. For weight reduction and strength purposes, the beam‐like wing spar is mounted on a fiberglass composite substrate (E) of mass 17.8 g, with a total length of 593.7 mm, width of 38 mm and thickness of 2.38 mm. The most common piezoelectric material for actuation and sensing is lead zirconate titanate (PZT). The harvesting, sensing and actuating PZT layers are placed at the root of the wing spar, since this section will experience the largest strain during normal wing vibration or wind‐gust disturbance. The PZT‐based harvester/sensor (B) is layered on the top surface of the fiberglass substrate. The PZT actuator (F) is layered on the bottom surface of the fiberglass substrate. The thin‐film battery (C) allows for power storage from harvesting and provides the energy supply for wind‐gust alleviation. The electronic module combines conditioning, sensing and control circuitry, on a single layer of printed circuit board (PCB). The harvested energy from wing vibrations appears as an alternating voltage, which needs to be rectified and smoothed in order to charge the battery. These multifunctional layers, together with the fiberglass composite substrate, form the multiple‐layer wing spar. ScotchWeldTM DP460 epoxy from 3 M is bracketed by Kapton to be used in the individual layer layup. Both of them are grouped together as layer G in Figure 14.1.

Figure 14.1 Multifunctional wing spar incorporating self‐sensing, self‐harvesting, self‐storage and self‐control.
Next, consider the class of piezoelectric materials and which types would be most suitable for various required functions. Ceramic materials versus polymer‐based piezoelectric materials are considered here because of their generally higher coupling coefficients. We further restrict our examination to commercially available piezoceramics. The main piezoceramic configurations are:
- monolithic PZT
- macro fibre composites (MFCs)
- a packaged monolithic PZT called QuickPack, which is encased in Kapton and fitted with electrical leads.
The piezoelectric effect is a three‐dimensional effect that causes the material to strain when subject to an electric field and produces an electric field when subject to mechanical strain. Temperature effects are also important but here we will operate within acceptable temperature limits so we may effectively ignore temperature considerations.
Ignoring temperature effects, a simplified version of the constitutive laws covering the piezoelectric effect are (IEEE Standard 1987):
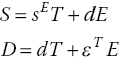
Here, S is the mechanical strain, T is the mechanical stress, E is the electric field strength, D is the dielectric displacement, sE is the compliance measured at zero electric field, and εT is the dielectric constant measured at zero stress. The piezoelectric constant, d, determines the coupling between mechanical and electrical fields. Since the piezoelectric effect is three‐dimensional, Eq. (14.1) is really a full tensor relationship. In most circumstances the piezoelectric material is in the shape of a thin plate with the electric field perpendicular to the resulting strain and with the respective coupling being denoted by d 31. However, it is possible to arrange the material so that the electric field and the strain are in the same direction (Hagood et al. 1993), in which case the coupling coefficient is d 33. Experiments show that d 33 is about three times larger than d 31. This led to the invention of MFCs, which use fibres of PZT laced in a Kapton casing with interdigitated electrodes (Wilkie et al. 2000; Bent and Hagood 1997). The resulting material makes an outstanding actuator, with the added ability of being flexible, unlike other ceramic‐based actuators.
Several previous studies have examined the differences in piezoceramic performance as sensors, actuators and energy‐harvesting devices. Sodano et al. (2004; 2005) investigated the sensing qualities of MFCs and later considered the energy‐harvesting abilities of the three different piezoceramic configurations mentioned above (Sodano 2006). A later work (Bilgen et al. 2011) considered the effect of volume or mass, a critical issue in aircraft, as an additional constraint in evaluating piezoceramics’ relative performance as sensors, actuators and harvesting devices. The resulting study shows clearly that MFCs have the best actuation ability and QuickPack has the best harvesting and sensing ability. This is the reason for the arrangement of sensing, harvesting and actuating elements in Figure 14.1. Note that only one piezoceramic is used for both sensing and harvesting. The energy from the solar panel is not considered here but can be easily integrated to provide additional energy.
To model the layered composite, a beam model is used, with the changes in stiffness and modulus modelled by discontinuity functions in the x direction and a smeared modulus used in the z direction, applying the rule of mixtures. Table 14.1 gives the physical parameters of each component. This is followed by an energy formulation of the distributed‐parameter electromechanical multifunctional wing spar used to derive the dynamic equations of motion.
Table 14.1 Geometric and material properties of multifunctional wing spar.
| Layer |
Length (mm) |
Width (mm) |
Thickness (mm) |
Mass (g) |
Young’s modulus (GPa) |
| Solar panel | 85 | 28 | 0.2 | 0.69 | 52 |
| QP10N | 59.6 | 25.4 | 0.38 | 2.25 | 67 |
| Battery | 25.4 | 25.4 | 0.18 | 0.46 | 55 |
| PCB | 25.4 | 25.4 | 0.20 | 0.23 | 60 |
| Fiberglass substrate | 735 | 28 | 10 | 185.2 | 71 |
| MFC | 85 | 28 | 0.18 | 2.92 | 63 |
|
Foam Fiberglass composite |
650 | 28 | 0.76 | 4.10 | 60 |
| 3D epoxy | 1580.4 | 28 | 0.008 | 0.35 | 3 |
| Kapton | 1580.4 | 28 | 0.0075 | 0.41 | 3.7 |
Under the plane‐stress assumption and indicating the directional properties by subscripts, the linear constitutive equations for piezoelectric transducers excited in the z‐direction and deformed in the x‐direction (the tensor version of Eq. (14.1) for the planer geometries used here) become:

This expression is appropriate for a monolithic d31 domain PZT harvester and sensor such as the QuickPack‐type QP10N used here. On the other hand, the actuator material is chosen to be an MFC, which is deformed and excited in the x‐direction so that the larger d33 coefficient is used. Then the reduced constitutive equations become:

The above piezoelectric coefficients are related to the elastic modulus (c, e) and the dielectric permittivity of the piezoelectric material (ε) via the following relations:
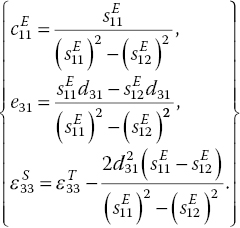
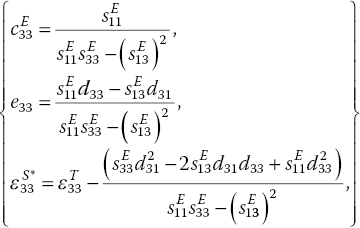
Again S is the mechanical strain, T is the mechanical stress, D is the dielectric charge displacement, and E is the electrical field strength; c is the elastic stiffness constant, s is the elastic compliance constant, d and e are piezoelectric constants, and ε is the permittivity constant. The subscripts 1 and 3 are tensor notations indicating the geometric directions. The superscript E refers to evaluating the parameter at a constant electric field. The superscript S implies the parameter is evaluated at a constant mechanical strain and likewise T denotes that the parameter is evaluated at constant mechanical stress.
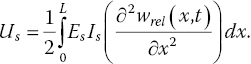
The total potential energy in the beam is:

Here Sxx and Txx denote the stress and strain vectors of both the structural and the QuickPack/MFC layers over the wing spar volume V. The structure here includes all the components in Figure 14.1. Let wrel (x,t) denote the transverse displacement relative to the clamped end of the wing spar. It is assumed that the wing‐to‐fuselage connection forms a clamped boundary condition, decoupling the rigid‐body motion from elastic wing vibrations. The non‐zero strain component at an arbitrary position in the x‐direction along the neutral axis, and at a given time t, is given by:

The multifunctional wing spar is assumed to be linear elastic so according to Hooke’s law the structural stress Txx is the product of the global elastic modulus Es and the strain vector Sxx . In this case the structural strain energy becomes:
Here, EsIs stands for the bending stiffness of the structure, which is taken as constant across each of the four individual longitudinal sections in Figure 14.1. In order to accommodate the spatially dependent ending stiffness in the x direction Heaviside step functions (denoted H) are used to yield:
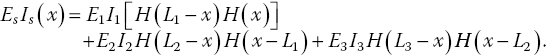
where the bending stiffness variation in the z direction of each longitudinal section is estimated using the rule of mixtures (ROM) and the cross‐section transformation (CST) [13].
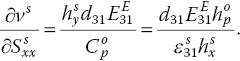
Following the constitutive relations given in Eqs. 1.2–1.5, the stress component in the d31 harvesting/sensing QuickPack layer and in the d33 MFC actuation layer are given by:
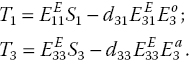
respectively. Here, S1
and S3
both represent the strain vectors Sxx
in the x direction. The superscripts o and a denote ‘output’ from the PZT harvester/sensor at the top in Figure 14.1 and ‘actuation’ from the MFC actuator at the bottom in Figure 14.1. Since the output voltage vo
(t) across the QuickPack output layer and the actuation voltage va
(t) across the MFC actuator is the product of the thickness of each PZT layer with the instantaneous electric field ![]() and
and ![]() , respectively, the total strain energy in each transducer layer becomes:
, respectively, the total strain energy in each transducer layer becomes:
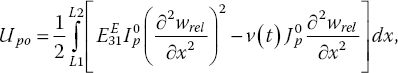
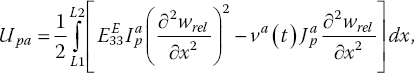
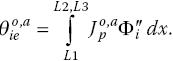
Again the subscripts po and pa denote the harvesting/sensing (output) layers and the actuation layer, respectively. The bending stiffness of each layer is derived using the parallel axis theorem. The coupling terms Jp of the harvesting/sensing QuickPack and actuation MFC are defined as:
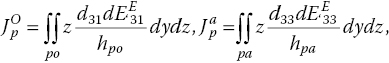
Here h pa and h po represent the thickness of the harvesting/sensing QuickPack and actuation MFC, respectively. Let w(x,t) denote the transverse displacement of the multifunctional beam in the absolute frame of the reference. The total kinematic energy of the multifunctional wing spar is then given by:
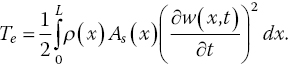
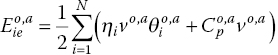
Here ρ(x) stands for the density and As (x) for the cross‐sectional area of the wing spar in the x direction. Note the x‐dependence as the beam density and area change moving along the longitudinal axis. The internal electric energy of the harvesting/sensing QuickPack layer and the actuation MFC layer is:
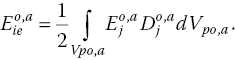
After substituting the expressions for the electric field and the electric displacement from the constitutive Eq. (14.2) into Eq. (14.14), the internal electric energy becomes:

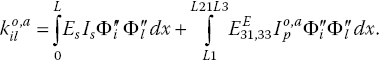
Here the capacitance term Cp of the harvesting/sensing QuickPack and the actuation MFC is defined as:
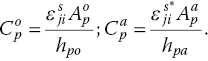
The constant ![]() is the electrode surface area of the harvesting and sensing QuickPack and
is the electrode surface area of the harvesting and sensing QuickPack and ![]() denotes the electrode surface area of the MFC providing the actuation. The non‐conservative work is due to the harvesting/sensing QuickPack output energy and the MFC actuation energy, given by
denotes the electrode surface area of the MFC providing the actuation. The non‐conservative work is due to the harvesting/sensing QuickPack output energy and the MFC actuation energy, given by
Here Qo,a denotes the output charge or actuation charge of the corresponding piezoceramic device.
An assumed mode method based on the Rayleigh–Ritz formulation is used to build a dynamic model useful for predicting the behavior of the multifunctional spar. The assumed mode method represents the vibration response wrel (x,t), relative to the base as a finite series expansion of admissible trial functions Φr (x) and unknown modal coordinates ηr(t) of the form:

Here N is the number of modes kept in the series subject to convergence conditions and the bandwidth of interest. The admissible trial function Φr (x) has to satisfy the clamped‐free boundary conditions. For cantilever beams a standard admissible trial function for long thin beams is:

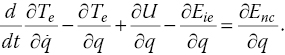
The extended Hamilton’s principle satisfies:

Taking the variation suggested in Eq. (14.20) results in the Euler–Lagrange equations for the multifunctional beam:
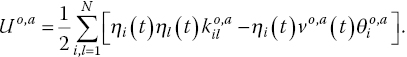
where the over dot indicates ordinary differentiation with respect to the temporal variable t. Here the generalized coordinates are the modal coordinates η(t) and the voltage v(t). Substituting the assumed mode solution into the potential energy term yields:
Likewise, substitution into the kinetic energy term yields:
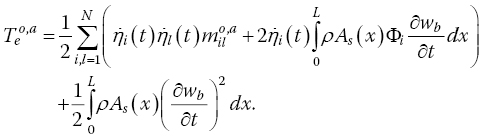
With the assumed mode expansion, the internal energies become:
where the coupling coefficient is defined as:
and the prime denotes ordinary differentiation with respect to the spatial variable x.
These energy expressions, along with Euler–Lagrange equations, define the mass and stiffness matrices. The mass elements are given by:

and the stiffness elements are given by:
The equations of motion then become:

Here the Zo denotes the impedance of the output circuit. In the case considered here, Zo is modelled as a pure resistance. The term fi is the force due to the base excitation and is given by:

The composite also exhibits some natural damping, approximated here by assuming proportional damping (also called Rayleigh damping) of the form
The constants κ and γ are determined by experimental procedures detailed later. Inserting damping into Eq. (14.8) and rewriting the equivalent Euler–Lagrange Eq. (14.28) into matrix form, the dynamic equation of motion becomes the coupled system:

For the damping matrix, the coefficients κ and γ are determined using the damping ratios associated with the first and second modes: 0.37% and 0.1% respectively, based on experiments and the values given in Table 14.1. With these damping ratios, the matrix C must satisfy the following relations in order to uncouple the modal equations:
Here ɷni and ζi represent the ith natural frequency and its associated damping ratio as measured. Equation (14.33) is then solved to yield κ = 1.34 and γ = 1.89 × 10⁻⁷. The damping matrix becomes:
A solution is formulated from the equations of motion by assuming that the ambient normal vibration applied to the wing is harmonic and applied to the clamped end of the wing spar wb (t). Then the base acceleration ab (t) and the forcing vector fi (t) of the wing will have a harmonic form as well, so that the base motion, acceleration, and force become:
The harmonic forcing excitation leads to a harmonic solution for the generalized displacement coordinates
and the generalized voltage:
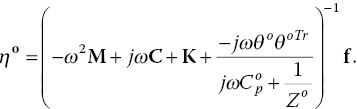
Substitution of Eqs. (14.36) and (14.37) into Eqs. (14.31) and (14.32) yields for the steady‐state response
and:

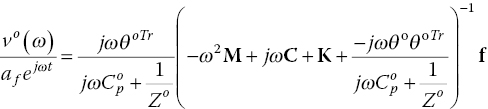
If the superscript Tr stands for transpose, the steady‐state solutions are solved to yield:
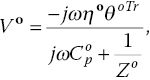
With the values given in Table 14.1 and the damping values given in Eq. (14.34), the frequency‐response function for the relative displacement can be numerically analyzed using four approaches and two methods. The two methods are an ‘analytical’ solution, using Rayleigh–Ritz, and a finite element (FE) approximation. In each method both the ROM and CST are implemented for modal frequency predictions. The four modelling approaches based on the above analysis are compared in Figure 14.2 using a displacement to base acceleration frequency‐response function. The base acceleration is represented in terms of the acceleration of gravity, g = 9.81 m/s2. Note that the ROM and CST approaches agree using both the analytical model solved by Rayleigh–Ritz and the FE model. The approximate analytical models are within 5% root mean square (RMS) error of the FE models.

Figure 14.2 Frequency response prediction using both Rayleigh–Ritz and FE modelling. FRF, frequency‐response function; ROM, rule of mixtures; CST, cross‐section transformation.
The analytical model is useful in designing a control law because it is of much lower order then the FE model needed to obtain the same accuracy. The analytical model also keeps much of the physics transparent, unlike the FE approach.
14.3 The Energy‐harvesting and Storage Component
The harvesting and storage component consists of the monolithic PZT coupled through electronics to the thin‐film battery. The original concept for this part of the multifunctional spar was a self‐charging structure (Anton et al. 2010). The structure consisted of a PZT harvesting material, a thin‐film battery mounted on a thin‐beam substrate, as pictured in Figure 14.3. The circuitry required to charge the battery was left external to the beam in this initial implementation. However, a full strength and dynamic analysis was performed to show the true multifunctional aspects of the design. Charge/discharge testing under dynamic excitation verified that there was transfer of electrical energy from the PZT to the battery, demonstrating a self‐charging operation. A three‐point bend test of the system, illustrated in Figure 14.3, showed that the strength of the multifunctional structure was around 100–150 MPa. As expected, the PZT and thin‐film battery formed the critical failure points for bending. However, the dynamic tests show clearly that no electrical or mechanical failure occurs in the device for vibration excitation levels up to 7.0 g, providing a reasonable level of robustness.
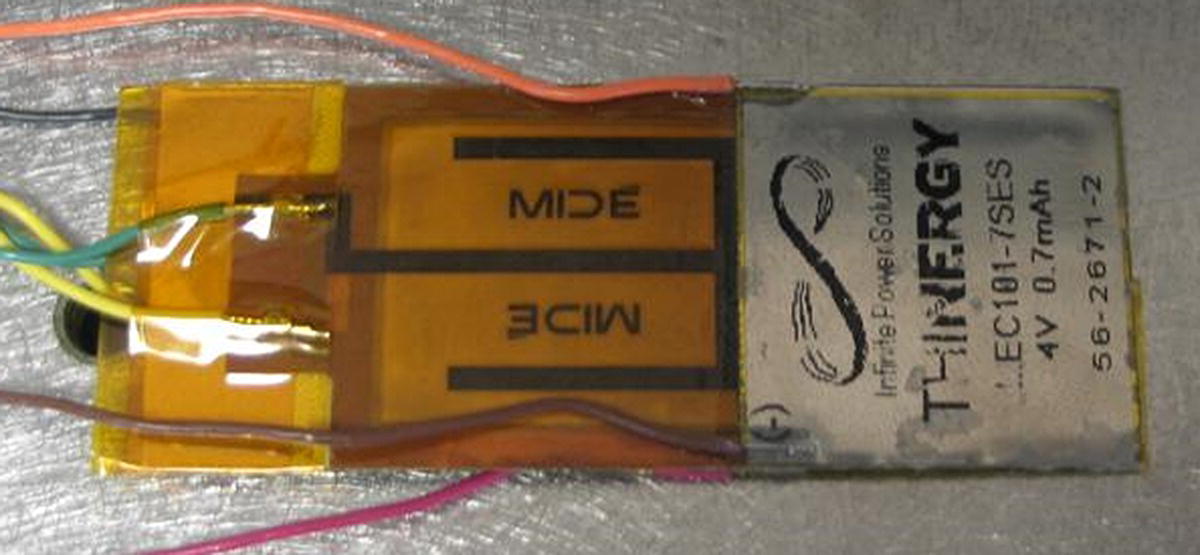
Figure 14.3 Photograph of a self‐charging structure.
The amount of energy required to provide a control action is larger than the energy directly available from harvesting. Thus the scenario is to harvest ambient energy during normal flight conditions, store it and release this larger amount of energy later when called for. The battery requires a DC voltage to charge it but the PZT provides an AC voltage. Thus a rectifying circuit and smoothing capacitor are required. For the discussion here, a simple resistance is used to model the circuitry for the sake of pointing out optimality conditions and keeping the text brief.
Modelling the electronics simply as a resistance, the steady‐state solutions given in Eqs. (14.40) and (14.41) reveal the value of the harvested output voltage‐to‐base input acceleration frequency‐response function to be
The value of the resistance experienced by an energy harvesting is well known to have an optimum based on the physical properties of the harvesting transducer (PZT). Figure 14.4 shows a power harvested versus load resistance for a typical PZT harvester showing the clear existence of an optimal resistance value.
Figure 14.4 Power out versus load resistance for a PZT energy‐harvesting transducer, showing the existence of clear optimal value of resistance. The dots are experimental values.
In reality the circuit that takes the AC voltage appearing across the PZT and coverts it to smooth DC voltage suitable for charging the battery is fairly complex and is a topic of current research (Dunbar and Popovic 2014). Roundy and Wright (2004) and Liang and Liao (2009) used an equivalent circuit of piezoelectric generator representation for a single degree of freedom system representative of the first vibration mode of a distributed parameter model of the structure (Elvin and Elvin 2009). This last approach used the assumed modes method to create an equivalent electrical circuit using Matlab’s Simulink program adapted to multiple modes. Their method allowed an understanding of the dynamics of harvesting from more than one mode of vibration. Figure 14.5 shows the equivalent current sources circuit for the first‐mode piezoelectric generator.
Figure 14.5 The equivalent circuit for first‐mode piezoelectric generator with resistive impedance.
It is well known (see Pederson et al. 1966, for example) that a complex conjugate matching load impedance will deliver the maximum power output. Unfortunately, impedance matching for low‐frequency energy harvesting usually requires an impractically large inductor. A suitable compromise is to use resistance matching, which provides suboptimal harvested power for a frequency band around resonance (Kong et al. 2010). A 0.1‐MΩ resistance was found to maximize the harvested power for the multifunctional wing spar under consideration here. The frequency‐response function of the harvested voltage output to the input of base acceleration for the first two vibration modes is given in Figure 14.6 for the 0.1‐MΩ load resistance. Fifty assumed modes were used in order to ensure the convergence of the first two modes. The ambient normal wing‐vibration acceleration is simulated with 0.2 g RMS acceleration over a frequency bandwidth of 5–300 Hz.

Figure 14.6 The output voltage to base acceleration frequency‐response function for a 0.1‐MΩ load resistance.
Figure 14.7 shows a plot of the frequency spectrum of the instantaneous harvested power for a 0.1‐MΩ resistance load.

Figure 14.7 The harvested power spectrum for a 0.1‐MΩ load resistance.
Defining the self‐sensing sensitivity as the derivative of the sensing voltage vs
with respect to the PZT strain ![]() , the following relations can be derived for the sensitivity:
, the following relations can be derived for the sensitivity:
Here, ![]() and
and ![]() denote the width and the length of the piezoelectric sensor, respectively. The current flow into the sensor is neglected because of the large impedance (0.1 MΩ), which is equivalent to open‐circuit conditions. More details of the circuits used here can be found in Wang (2012).
denote the width and the length of the piezoelectric sensor, respectively. The current flow into the sensor is neglected because of the large impedance (0.1 MΩ), which is equivalent to open‐circuit conditions. More details of the circuits used here can be found in Wang (2012).
14.4 Reduced Energy Control Law
Because in general the amount of energy available from harvesting is limited, the active control law chosen to perform gust alleviation must use the least amount of energy possible to perform the required reduction in vibration. The standard method of minimum energy control is to use optimal control and penalize the control effort. However, it was found by Wang and Inman (2011) that a control algorithm that switches a control input from a constant voltage supply to the feedback signal provided from a more traditional controller greatly reduces the amount of energy required. Several different common control laws were examined, as well as their voltage‐limited versions; so‐called reduced energy controllers (RECs). They were used to control the free response of a cantilever beam. The laws examined were
- positive position feedback (PPF; Fanson and Caughey 1990)
- linear quadratic regulator (LQR; see, for instance, Levine 1996)
- proportional‐integral‐derivative (PID; see for instance O’Dwyer 2009).
A non‐linear controller consisting of feeding back the product of position and velocity was also examined (Castelazo and Lee 1990). To form a fair comparison, each controller was given the same initial conditions and then designed to give a settling time of 0.85 s. The settling time was chosen to be quicker than any passive damping treatment could possibly achieve. The power consumption for each case was measured and the results are reported in Table 14.2.
Table 14.2 Different control systems for controlling a cantilever beam.
| Unit | Open‐loop | PPF | REC‐PPF | PID | REC‐PID | Non‐linear | REC‐non‐linear | LQR | REC‐LQR | |
| Initial displacement, velocity | mm, mm/s | (4.8,0) | (4.8,0) | (4.8,0) | (4.8,0) | (4.8,0) | (4.8,0) | (4.8,0) | (4.8,0) | (4.8,0) |
| Settling time Ts | s | 10.8 | 0.85 | 0.85 | 0.85 | 0.85 | 0.85 | 0.85 | 0.85 | 0.85 |
| Maximum voltage | V | N/A | 450 | 130 | 450 | 130 | 450 | 130 | 450 | 130 |
| Maximum current | mA | N/A | 0.5 | 0.7 | 0.5 | 0.7 | 0.5 | 0.7 | 0.5 | 0.7 |
| Average power | mW | N/A | 10.6 | 5.73 | 15.5 | 6.47 | 16.7 | 5.46 | 15.52 | 6.20 |
It is clear from Table 14.2 that the use of a clipped or ‘on‐off’ controller greatly reduces the power required to produce the same closed‐loop response. Therefore, the control law chosen to use in a self‐powered gust‐alleviation system, employs a REC technique. Note that the alternative to active control is to add viscoelastic damping treatments and/or to make the wing stiffer. Damping treatments are not physically able to achieve this short settling time and making it stiffer would add substantially more weight.
14.5 Gust Modelling
Holbit (1988) provides an excellent introduction to gust loads applied to aircraft. The book covers gust loads on aircraft but especially focuses on continuous turbulence gust loads. Wright and Cooper (2007) provide an updated treatment of gust loading. Basic concepts are defined and explained in both textbooks. Varito et al. (2005) examined use of modal control methods to provide gust alleviation for a sensor craft concept. The SensorCraft, as it was called, was an unmanned ‘flying wing’ concept aircraft featuring a very flexible wing. As such, it was very vulnerable to gust‐induced loads and vibration. Gust‐load alleviation was used to reduce the craft’s structural strength requirements. The gust response was controlled by inboard control surfaces. It was shown that the structural modes are well intermixed with the rigid‐body modes, meaning that they will be highly coupled. This creates a situation where gust‐induced vibration of the wings could destabilize the rigid‐body modes and hence the aircraft. Varito et al. (2005) constructed a hardware test of a closed‐loop gust‐alleviation system that controlled the first two wing bending modes in the NASA Langley Transonic Dynamics Tunnel (TDT). The same group (Silva et al. 2006) performed a rigorous time‐domain system identification on their hardware in the wind tunnel, a SensorCraft demonstrator called the High Lift‐to‐Drag Active (HiLDA) wing model. They then used the model to design a controller to eliminate the negative effects of a gust, using sinusoidal gusts created by gust vanes in the tunnel to emulate the real world.
Vartio et al. (2008) presented a linear quadratic Gaussian control law for gust‐load alleviation and tested it in the TDT. They illustrated the ability to control the moments applied at the root by the first few modes. They used strain gauges to measure the first two bending modes and the first torsional mode, as well as accelerometers to measure the acceleration at the wing tip. Shao et al. (2010) developed a fuzzy logic/neural network based control law for gust alleviation and tested its effectiveness in a wind tunnel applied to sinusoidal and random gusts and showed a 20–27% reduction in the response due to a gust. In 2012, NASA performed a state‐of‐the‐art review of gust alleviation (Regan and Jutte 2012). They focused on both modelling and active control of atmospheric disturbances during flight. Their report provides both a historical survey of the topic as well as a state‐of‐the‐art assessment. All of the above mentioned gust‐alleviation control laws were implemented using discrete control surfaces (flaps, ailerons, and so on). The work presented here does not use discrete control systems to counter gust vibrations.
Gusts may be modelled in several ways. An excellent and detailed analysis of atmospheric wind models particular to lower flying UAVs can be found in Etele (2006). In simple terms, wind experienced in flight can be thought of as made up of mean wind, waves, and turbulence. Turbulence is either discrete or continuous. Discrete models of turbulence can be represented as deterministic in a form proportional to [1 − cos (θ)], where the amplitude is the amplitude of the gust and θ is proportional to the length of the gust and some aircraft parameters. Here the Dryden PSD, Φ Dry , is used to model the gust, which is given by:
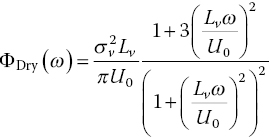
Here U0 is the trim velocity of the aircraft, Lv is the vertical scale of turbulence, and σv is the root mean square of the vertical gust velocity. In developing the Dryden model, atmospheric turbulence is assumed to be a stationary random process. Here the vertical gust velocity σv for clear air, a cumulus cloud, and a severe storm are: 0.5 m/s, 2.0 m/s, and 4.0 m/s, respectively. In order to generate a signal corresponding to clear sky (normal wing vibration) and wind gust signals of the required intensity, scale lengths, and PSD functions, a Gaussian white noise source of n(t) ~ N(0,1) with a PSD function of 1, is amplified by a wind‐gust gain Kg and filtered by a wind‐gust transfer function Gv (s), for a given flight velocity and height. A schematic representation of wind‐gust generation for open‐loop and closed‐loop tip displacement response of the wing spar is shown in Figure 14.8.

Figure 14.8 Block diagram of wind‐gust signal generation for open‐loop and close‐loop tip displacement response.
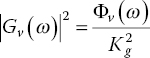
The relationship between the PSD of the output signal vg (t) and the input signal n(t) is given by:
Choosing the noise source to be Gaussian white noise – ΦN(ɷ) = 1 – then the wind‐gust transfer function becomes:
Here the values for Kg and Gv are given by (s is the Laplace variable):
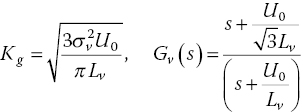
Figure 14.9 shows an example of simulated clear‐sky normal wing vibration (dotted line) and cumulus cloud wind gust (solid line) signals, in acceleration units (g = 9.81 m/s2).
Figure 14.9 Normal wing vibration and wind gust acting on multifunctional wing spar base, U0 = 15 m/s, Lv = 350 m.
These PSD models are used in the next section to determine just how a self‐powered gust‐control system would work on a small UAV. The idea is to harvest the signal in the dotted line (clear sky) in Figure 14.9 over a long time period in order to control the signal in the solid line – the gust response – over a short time.
14.6 Experimental Validation
The modelling described above was validated with experimental data using a composite ‘spar’. The spar consisted of a 504 × 38 × 3.05 mm aluminum substrate within the dimensions of a beam designed to fit in the tapered wing cavity of a specific radio‐controlled model airplane. The length‐to‐thickness ratio of this design satisfies the required spanwise rigidity for normal flight. The rectangular substrate is configured with one layer of QuickPack QP10n patch (forming the PZT harvester/sensor layer suggested in Figure 14.1) and a layer of Smart Material Corp MFC 8528P1 patch (forming the PZT actuator). Both PZT layers were bonded with Kapton and 460 3D epoxy layers under 0.8 atm vacuum for 6 h to minimize variations in epoxy thickness and to eliminate air gaps. The PZT layers were positioned 54 mm away from the root end of the beam, corresponding to the beam length attached to the fuselage when the wing spar is inserted into the wing and fuselage. This location experiences the largest strain during flight, hence the placement of the piezoelectric devices at the root of the beam, as pictured in Figure 14.10.

Figure 14.10 Wing spar validation test: left, front view; right, back view.
The experimental apparatus is shown in Figure 14.11, where the representative spar is clamped to an APS Dynamics ELECTRO‐SEIS long‐stroke shaker with frequency range 0.1–200 Hz to provide the simulated excitation and sine sweeps for model validation. The shaker is driven by an APS dual‐mode power amplifier. Normal vibration signals are generated for harvesting purposes and wind‐gust signals for control purposes. The white noise and Dryden PSD functions are coded in Matlab/Simulink and implemented via dSPACE. The absolute tip displacement is measured using an MTI LTC‐50‐20 laser sensor.

Figure 14.11 Configuration of the test of the gust alleviation system using REC laws from harvested energy.
14.7 Performance
With the validated model in hand, numerical experiments were conducted using the Dryden PSD to simulate aerodynamic loads. The numerical experiments allowed clarification of the conditions under which the proposed self‐powered, gust‐alleviation system will be practical. In order to compare control performance for a range of control parameters the frequency spectrum of the measured relative tip displacement is calculated. The various control gains and corresponding vibration reduction levels are shown in Figure 14.12 and listed in Table 14.3. A modified version of the positive position feedback control law is used. This is called positive strain feedback (PSF). The PSF control algorithm uses strain feedback from a strain gauge rather than using a position sensor, as is required in standard PPF. The remaining control law is exactly the same as PPF. However, by using strain directly, the need for an external sensing source and power supply is completely eliminated, allowing the system to be self‐contained. The Laplace transfer function of PSF for the first mode (driven by a PSF op‐amp and a voltage buffer op‐amp) is:


Figure 14.12 Control performance of PSF controllers for different control gains for the first (left) and second (right) modes. Damping ratio of mode 1: ζ1 = 0.15 and mode 2: ζ2 = 0.35.
Table 14.3 Control performance vs PSF control gains.
| Two‐mode control gains | 0.8 | 0.6 | 0.4 |
| First mode reduction (dB) | 13 | 11 | 9 |
| Second mode reduction (dB) | 8 | 7 | 6 |
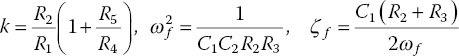
The PSF filter parameters: gain k, damping ratio ζf , and filter natural frequency ɷf are given by:
In addition, experimental measurement shows that when the control gain is fixed (0.1 < g 1, g 2 < 1.2), changing the controller’s damping ratio (0.10 < ζ1 < 0.55, 0.30 < ζ2 < 0.75) has little effect on the control performance.
A Spectral Dynamics SigLab 20–42 data acquisition system was used for recording the absolute‐tip‐displacement‐to‐base‐acceleration frequency‐response function, where a PCB Piezotronics U352C67 accelerometer was employed for input acceleration measurements. Similar to Eq. (14.42), the absolute‐tip‐displacement‐to‐base‐acceleration frequency‐response function becomes:

These are in agreement with time‐domain measurements, which are not shown here for space considerations (see Wang 2012).
The purpose of the frequency‐response plots in Figure 14.13 is two‐fold. First the figure shows that the same control performance (11‐dB reduction for Mode 1, 7‐dB reduction for Mode 2 from open‐circuit control (dashed line)) is reached using the PSF controller (solid line) with gains g 1 = 0.6, g 2 = 0.6, damping ratios ζ1 = 0.15, ζ2 = 0.35; and using the REC controller (dotted line) with gains g 1 = 0.8, g 2 = 0.8, damping ratios ζ1 = 0.15, ζ2 = 0.35, saturation voltage of 120 V.

Figure 14.13 Vibration suppression performance using the PSF and REC laws for (left) mode 1 and (right) mode 2.
Secondly, Figure 14.13 also illustrates that the time‐domain steady‐state response under the PSF and REC controllers is much better than the open‐loop response. Both the PSF controller (solid line) and the REC controller (dashed line) are designed to reduce the RMS value of the relative tip displacement from 3.0 mm for the open‐circuit case (dotted line) down to 1.2 mm when using active control. Of course the difference is that the REC requires an order of magnitude less energy to achieve the same response.
Figure 14.14 repeats the same information presented in Figure 14.13 except in the time domain. The plot shows three curves of wing tip displacement versus elapsed time. The large‐amplitude time response is the wing tip oscillating as the result of an applied gust with no control applied. The other two lower‐amplitude responses are the wing‐tip response with the two different control laws, illustrating the reduction in maximum deflection achieved by the gust‐control law. Again, the REC law achieves the same result as the traditional controller but uses an order of magnitude less energy.

Figure 14.14 Control performance using PSF and REC laws compared to the open‐loop response (time history of relative tip displacement response).
The actuation voltage was amplified (×200 gain) using a TREK 2220 power amplifier, and applied across the MFC actuator. Both the REC and the PSF control laws were tuned to an identical closed‐loop performance. The actuation voltage and current required by each law was measured and the power calculated for each. These values are listed in Table 14.4. Note that in practice, this same result is achieved with a small printed circuit board having a mass of a few grams powered by a small battery using very little power. The average harvested power Phav was 0.3 mW. All values in Table 4 correspond to an 11 dB reduction in the 1st Mode and 7 dB reduction in the 2nd Mode compared to the open‐circuit gust response. The energy Etr is the energy consumed for transient vibration control and the power required to achieve steady state vibration suppression is Pst . The settling time ts is defined as the time needed for the controlled response to reach 40% of the amplitude of the open loop response, and is 0.8 s for this case (see Wang and Inman 2013a and 2013b for more details and examples).
Table 14.4 Power and energy elements associated with PSF and REC laws.
| Element | PSF control | REC | Ratio of reduction | |
| Voltage RMS | V | 100 | 82.3 | 18% |
| Current RMS | mA | 0.065 | 0.053 | 18% |
| Required energy Etr | mJ | 6.6 | 1.6 | 76% |
| Average power Pst | mW | 1.2 | 1.0 | 17% |
The main question is does this work? To provide an answer, some simple calculations are made to show that the answer is, ‘it depends’. While no universal answer can be given for all situations, the following formulations can guide the answer to this question. For any wind‐gust duration tg , the total energy required to perform control Etot can be calculated by:
The total energy required for the REC control law becomes:
The time th required to harvest enough energy to control a wind gust of duration tg is given by:
With these formulas in mind, whether or not the self‐powered gust‐control system works depends on a number of factors. First, the clear‐sky condition must charge up the battery until it contains enough energy to control the gust. The time to do this depends on the values of the clear‐sky vibration, the dynamics of the wing and the efficiency of the harvesting system. The energy required of the battery for the control system to work depends on the physical properties of the gust: duration, the trim velocity of the aircraft, the vertical scale of turbulence, and the root mean square of the vertical gust velocity.
Numerical simulations were used to obtain some nominal values of how long it takes to harvest energy before control can be performed. The power required for a 28‐dB reduction of the first mode and a 37‐dB reduction of the second mode in tip displacement is 6.42 mW, which is 40 times higher than the harvesting power of 0.16 mW. Thus in order to control a 1‐s wind gust, 30 s of clear‐sky harvesting is required.
14.8 Other Considerations
This chapter only looked at harvesting effects under flutter speed. However, several other aspects of the proposed system are worth discussing. These are the effect of harvesting on the aircraft’s flutter speed, the use of solar energy, and associated electronics. Harvesting energy involves extracting energy from a structure and, as such, provides some vibration suppression or additional damping to the structure. Erturk et al. (2010) built an piezoaeroelastic model on different aeroelastic effects at the flutter boundary of a piezoaeroelastic airfoil. Based on a two degree of freedom pitch‐plunge model typically used to study flutter, they investigated the energy‐harvesting ability of a flexible wing in a flow. They added piezoelectric coupling to the plunge degree of freedom and termed the system ‘piezoaeroelastic’ to indicate the interplay between structure, piezoelectricity and aerodynamics. While their goal was to see how much energy could be extracted from a flow (as used in the previous sections) they also discovered that the ‘shunt’ damping phenomenon had a noticeable effect on the flutter speed, or the speed at which flutter is initiated. Based on a lumped‐parameter state‐space model with aerodynamic loads obtained using the lumped‐vortex model they investigated both linear and non‐linear energy‐harvesting scenarios. Furthermore, their linear piezoaeroelastic predictions were verified against wind‐tunnel tests, adding credibility to their results. Their results clearly showed that the shunt effect of the piezoaeroelastic harvester increased the flutter speed by 5.5%. In an experiment defined to measure this, a 5.1% increase in flutter speed was measured.
Next consider including the energy‐harvesting capability of the solar panel indicated in Figure 14.1. There are numerous articles, laboratory experiments and flight tests involving harvesting energy from the sun using a variety of different types of solar panels embedded in or layered onto wings (see Anton et al. 2010 for a review). The most interesting studies are those of Thomas and Qidwai (2005) and Qidwai et al. (2009), who examined replacing the skin of a small UAV with a structural battery, effectively launching the field of multifunctional structures. Obviously, solar panels can harvest much more energy than is available from wing vibrations. However, solar power is not always available, so creating a system that uses both solar and vibration sources is a worthwhile endeavor.
The circuits for harvesting each type of energy are shown in Figure 14.15. The main difference between the two is that piezoelectric harvesting produces an alternating current (AC) and solar panels produce a direct current (DC). The oscillatory voltage from the piezoelectric material requires rectification and an efficient power‐conditioning circuit if the voltage is to be used to charge the battery (a thin‐film battery in this case). A full‐wave rectifier followed by a linear voltage regulator is used to convert the AC voltage to DC. Because of the importance of matching impedance to encourage the maximum transfer of energy, a non‐linear switching circuit, the parameters of which can be tuned to allow for impedance matching, is used. The first stage is a diode bridge, used to rectify the AC output of the piezoelectric element to DC. This is followed by a second stage consisting of a buck‐boost converter designed to run in discontinuous conduction mode.
The switches’ switching frequencies are designed to be considerably larger than the vibration frequencies. During each switching period, the input voltage to the buck‐boost converter is virtually a DC voltage. The three intervals of the switching cycle are:
- In the interval D 1 T S, the switch turns on and the piezoceramic element charges the inductor and the inductor current increases with a slope of vrect/L.
- During the second interval, D 2 T S, the switch turns off and the inductor is discharged through the load and the inductor current decreases with a slope of vo/L until it reaches zero.
- During the remaining switching cycle, the switch remains off and the inductor current remains at zero.
The advantage of this circuit is that the input impedance of the DC‐DC converter is inherently a resistance (Kong, et al. 2010) with a value given by
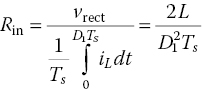
where vrect is the rectified voltage, L is the inductor value, IL is the current through the inductor, T S is the switching period, and D 1 denotes the duty cycle. By adjusting the duty cycle of the gate signal for the switch, the optimal resistive load can be emulated by the buck‐boost converter given by

The output power is not a function of the load. More details about the resistive impedance matching circuit can be found in Kong et al. (2010).
A similar circuit for converting the voltage from the solar panel to a form capable of charging the battery is shown on the right of Figure 14.15. Since the solar‐generated voltage is DC, no rectifier is needed. However, the buck‐boost converter is used, generating an equivalent resistance as given in Eq. (14.54). Each harvesting technique needs to see an optimal resistance, as shown in Figure 14.16. Note that the two optimal resistances are orders of magnitude apart, so the duty cycle in each circuit must be chosen to provide the optimal resistance in order to charge a single battery simultaneously using both solar and vibration energy.

Figure 14.15 Sample circuitry needed to convert electrical energy from transducers into useable voltage for chargin: left, for piezoelectric transduction; right, for solar panel transduction.
Figure 14.16 Optimal load resistance for: (left) solar harvesting and (right) piezoelectric harvesting.
The circuit side of energy harvesting is still a highly researched area. Some are using adaptive circuits to maximize the amount of power extracted from the transducer.
14.9 Summary and Discussion
In summary, a novel concept of simultaneous energy harvesting and gust alleviation for a small UAV was presented. Vibration energy from clear‐sky wing oscillations is harvested and shunted to a storage battery. A sensor system determines if the wing is experiencing a gust load and turns on an active control system to cancel the vibratory effects of the gust. The concept of a multifunctional wing spar is used to provide all the required functions: sensing, harvesting, energy storage, and control. Sensing, harvesting, and actuation use the piezoelectric effect. Because the amount of energy available from harvesting clear‐sky wing conditions is very low, a recently developed reduced energy control law is implemented to reduce control power while preserving control performance. Numerical simulations and experimental results show that the tip displacement due to a wind‐gust disturbance can be reduced by 11 dB and 7 dB for the first and second modes, respectively.
Although not yet implemented, the autonomous version of the self‐powered gust‐control system would work as follows. The PZT as sensor would constantly measure strain and simultaneously charge the battery. When the strain exceeded a preset value, indicating a gust, the control system would turn on and reduce the strain to desired values, effectively cancelling the gust. When the strain dropped below this desired value the controller would shut down and the system would continue to recharge the battery with the vibration induced by the clear‐sky conditions. As pointed out, this only works for one gust. If a second gust occurs before the battery is charged sufficiently then the controller will be less effective. However, if a second gust occurs after a sufficient delay, then the system will again cancel the effects of the gust.
Acknowledgement
The authors gratefully acknowledge the support from the U.S. Air Force Office of Scientific Research under the grants F9550‐06‐1‐0326 ‘Energy Harvesting and Storage Systems for Future Air Force Vehicles’ and F9550‐09‐1‐0625 ‘Simultaneous Vibration Suppression and Energy Harvesting’ monitored by Dr B.L. Lee.
References
- Anton, S.R., Erturk, A., and Inman, D.J., 2010, ‘Multifunctional self‐charging structures using piezoceramics and thin‐film batteries,’ Smart Materials and Structures, 19 (11): 115021–115035. doi: 10.1088/0964‐1726/19/11/115021
- Bent, A.A., and Hagood, N.W., 1997, ‘Piezoelectric fiber composites with interdigitated electrodes,’ Journal of Intelligent Material Systems and Structures, 8 (11): 903–919.
- Bilgen, O., Wang, Y., and Inman, D.J., 2011, ‘Electromechanical comparison of cantilevered beams with multifunctional piezoceramic devices,’ Mechanical Systems and Signal Processing, 27: 763–777. doi: 10.1016/j.ymssp.2011.09.002.
- Castelazo, I.A., and Lee, H., 1990, ‘Nonlinear compensation for flexible manipulators,’ Journal of Dynamic Systems, Measurement and Control, Transactions of the ASME, 112: 62–68.
- De MarquiJr., C., Vieira, W.G.R, ErturkA., and Inman, D.J., 2011, ‘Modeling and analysis of piezoelectric energy harvesting from aeroelastic vibrations using the doublet‐lattice method,’ ASME Journal of Vibration and Acoustics, 133 (1): 011003.
- Dunbar, S., and Popović, Z., 2014, ‘Low‐power electronics for energy harvesting sensors,’ Wireless Power Transfer, 1, 35–43.
- Elvin, N.G., and Elvin, A.A., 2009, ‘A general equivalent circuit model for piezoelectric generators,’ Journal of Intelligent Material Systems and Structures 20: 7.
- Erturk, A., Vieira, W.G.R, De Marqui, Jr., C., and Inman, D.J., 2010. ‘On the energy harvesting potential of piezoaeroelastic systems,’ Applied Physics Letters, 96: 184103.
- Erturk, E., and Inman, D.J., 2011. Piezoelectric Energy Harvesting, John Wiley & Sons.
- Etele, J., 2006, Overview of Wind Gust Modelling with Application to Autonomous Low‐Lever UAV Control, Technical report CR 2006‐221, Defence R&D Canada.
- Fanson, J.L. and Caughey, T.K., 1990, ‘Positive position feedback control for large space structures,’ AIAA Journal, 28: 717–24.
- Hagood, N.W., Kindel, R., Ghandi, K., and Gaudenzi, P., 1993. ‘Improving transverse actuation using interdigitated surface electrodes,’ in: North American Conference on Smart Structures and Materials, N. Albuquerque, SPIE Paper No. 1917‐25: pp. 341–352.
- Hoblit, F.M. (1988). Gust Loads on Aircraft: Concepts and Applications. American Institute of Aeronautics and Astronautics.
- IEEE Standard, 1987, ‘Institute of Electrical and Electronics Engineers Standard on Piezoelectricity,’ ANSI/IEEE Standard 176–1987.
- Kong, N., Ha, D.S., Erturk, A., and Inman, D.J., 2010, ‘Resistive impedance matching circuit for piezoelectric energy harvesting,’ Journal of Intelligent Material Systems and Structures, 21 (13): 1293–1302.
- Levine, W.S., 1996, The Control Handbook, CRC Press; IEEE Press.
- Liang, J.R., and Liao, W.H., 2009, ‘Piezoelectric energy harvesting and dissipation on structural damping,’ Journal of Intelligent Material Systems and Structures 20: 27.
- McLean, D., 1990, Automatic Flight Control System, Prentice Hall.
- O'Dwyer, A., 2009, Handbook of PI and PID Controller Tuning Rules, Imperial College Press.
- Pederson, D.O., Studer, J.J., and Whinnery, J.R., 1966, Introduction to Electronic Systems, Circuits, and Devices, McGraw‐Hill.
- Qidwai, M.A.S., Thomas, J.P., and Pogue III, W.R., 2009, ‘Structure‐battery composites for UUVs: multifunctional interaction effects,’ in Proceedings of the 50th AIAA/ASME/ASCE/AHS/ASC Structures, Structural Dynamics, and Materials Conference.
- Regan, C.D., and Jutte, C.V, 2012, Survey of Applications of Active Control Technology for Gust Alleviation and New Challenges for Lighter‐weight Aircraft, Techical report, TM‐2012‐216008, NASA.
- Richardson, J.R., Atkins, E.M., Kabamba, P.T., and Girard, A.R, 2011, ‘Envelopes for flight through stochastic gusts,’ Proceedings AIAA Atmospheric Flight Mechanics Conference, Portland Oregon. AIAA paper 2011–6213.
- Roundy, S., and Wright, P.K., 2004, ‘A piezoelectric vibration based generator for wireless electronics,’ Smart Materials and Structures 13: 12.
- Shao, K., Wu, Z., Yang, C., Chen, L., and Lv, B., 2010, ‘Design of an adaptive gust response alleviation control system: simulations and experiments,’ Journal of Aircraft, 47 (3): 1022–1029.
- Silva, W.A., Vartio, E., Shimko, A., Kvaternik, R.G., Eure, K.W., and Scott, R.C., 2006, ‘Development of aeroservoelastic analytical models and gust load alleviation control laws of a SensorCraft wind‐tunnel model using measured data.’ In 47th AIAA/ASME/ASCE/AHS/ASC Structures, Structural Dynamics, and Materials Conference, 1–4 May 2006, Newport, Rhode Island. AIAA 2006–1935.
- Sodano, H.A., Park, G., and Inman, D.J., 2004, ‘An investigation into the performance of macro‐fiber composites for sensing and structural vibration applications,’ Mechanical Systems and Signal Processing, 18 (3): 683–697.
- Sodano, H.A., Park, G., and Inman, D.J., 2005, ‘Comparison of piezoelectric energy harvesting devices for recharging batteries,’ Journal of Intelligent Material Systems and Structures, 16 (10), 799–808.
- Sodano, H.A., Lloyd, J., and Inman, D.J., 2006, ‘An experimental comparison between several active composite actuators for power generation,’ Smart Materials and Structures, 1: 1211–1216.
- Thomas, J.P., and Qidwai, M.A., 2005, ‘The design and application of multifunctional structure‐battery materials systems,’ Journal of The Minerals, Metals & Materials Society, 57 (3): 18–24.
- Vable, M., 2002, Mechanics of Materials, Oxford University Press.
- Vartio, E.J., Shaw, E.E., and Vetter, T., 2008, ‘Gust load alleviation flight control system design for a SensorCraft vehicle,’ in 26th AIAA Applied Aerodynamics Conference 18–21 August 2008, Honolulu, Hawaii. AIAA 2008–7192.
- Vartio, E., Shimko, A., Tilmann, C.P., and Flick, P.M., 2005, ‘Structural modal control and gust load alleviation for a Sensorcraft concept,’ in 46th AIAA/ASME/ASCE/AHS/ASC Structures, Structural Dynamics and Materials Conference 18‐21 April, Austin, Texas. AIAA 2005–1946.
- Wang, Y., 2012, Simultaneous Harvesting and Control, PhD Dissertation, Virginia Tech.
- Wang, Y., and Inman, D.J., 2011, ‘Comparison of control laws for vibration suppression based on energy consumption,’ Journal of Intelligent Material Systems and Structures, 22 (8): 795–809.
- Wang, Y., and Inman, D.J., 2013a, Simultaneous energy harvesting and gust alleviation for a multifunctional wing spar using reduced energy control via piezoceramics, Journal of Composite Materials, 47 (1): 125–146.
- Wang, Y., and Inman, D.J., 2013b, Experimental validation for a multifunctional wing spar design with sensing, harvesting and gust alleviation capabilities, IEEE/ASME Transaction on Mechatronics, 18 (4): 1289–1299.
- Wilkie, W.K., Bryant, G.R., and High, J.W., 2000, ‘Low‐cost piezocomposite actuator for structural control applications,’ in: Proceedings of the SPIE 7th Annual International Symposium on Smart Structures and Materials, Newport Beach, CA.
- Wright, J.R., and Cooper, J.E., 2007, Introduction to Aircraft Aeroelasticity and Loads, John Wiley and Sons.