CHAPTER 5
Video Systems
In this chapter, you will learn about
• The nature of light as it applies to video systems
• Capturing, encoding, and decoding video signals
• The basics of computer video signals
• Optimally projecting images
The foundation to all video systems is the understanding of light. There are two primary theories about the nature of light. One theory says that light consists of bursts of waves of electromagnetic radiation. The other says that light is made of small particles, called photons. The reason that there are two theories is because sometimes light behaves as waves and other times as particles. For the purposes of most AV applications, it’s helpful to think of light as electromagnetic waves.
Light
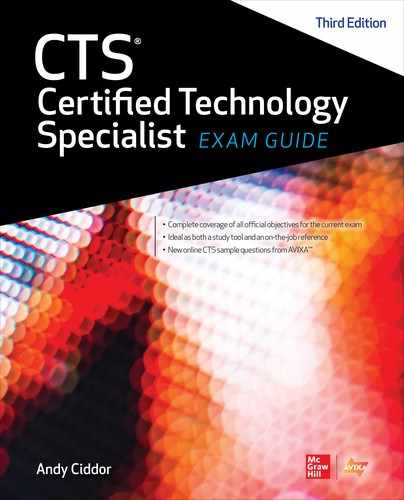
There are many different types of electromagnetic radiation, each categorized by their wavelength. Figure 5-1 shows the entire range of the electromagnetic spectrum categorized by wavelength.
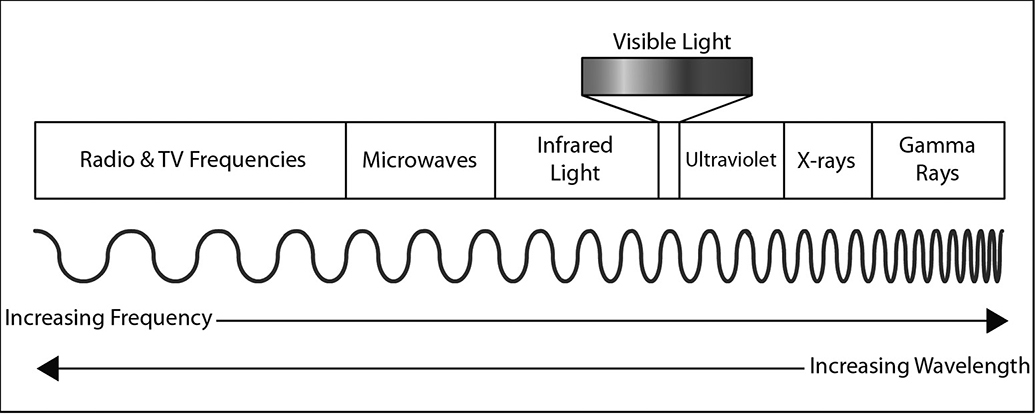
Figure 5-1 The visible light spectrum within the entire electromagnetic spectrum
At the right edge of the electromagnetic spectrum are gamma rays. They have the shortest wavelengths at around 10–12 meters. At the left edge are television and radio signals with long wavelengths of 105 meters. The wavelengths of visible light fall in the range between approximately 380nm and 750nm (a nanometer = 10–9 meters). Red light, at the lowest end of the visible spectrum, has wavelengths in the 620nm to 750nm region; green light falls in the 495nm to 570nm region, while blue light lies in the 450nm to 495nm region. At the shortest wavelength end of the spectrum is violet, which is found in the 380nm to 450nm region.
Units of Light Measure
Light affects every aspect of the user’s visual experience, which makes it important to be able to accurately measure and quantify all aspects of light.
The intensity of light is measured using two types of meters:
• Incident meters measure the light coming directly from a source such as a lamp, projector, lighting fixture, digital sign, video wall, or monitor.
• Reflected meters, or spot meters, measure the light that bounces off an object like a projection screen, a wall, a participant in a video conference, or a work surface.
The units of measurement for light vary by geographic region. Every country outside the United States uses the SI international system of units. You need to be able to recognize U.S. and international units for both direct light and reflected light.
Fundamental Units
There are two fundamental units used in light measurement.
• Candela The candela is the base unit of luminous intensity. It is the amount of light emitted by a light source that just happens (after a bit of manipulation of the specification) to have a similar output to a historic standard wax candle. That’s why it’s called candela, which is the Latin word for candle.
• Lumen The lumen is the unit of luminous flux—the quantity of photons emitted from a 1 candela light source through an area of 1 square meter on a sphere 1 meter in radius surrounding that light source. Lumens are the most common unit of measurement of light output from a projector or a light source. However, different organizations measure lumens by different methods. The most commonly quoted standard for the lumen measurement worldwide is the method specified by the American National Standards Institute (ANSI), despite no longer being the international standard method.
Direct Light Measurement
Using an incident light meter, you can measure the brightness or illuminance of an emitting light source. Two units of measure are commonly used for illuminance in the AV) industry:
• Lux Lux is the standard international unit of illuminance, the measure of the luminous flux (lumens) falling on a specified area. One lux is equal to 1 lumen/square meter. Generally, illuminance is measured at a task area such as a video screen, a note-taking location, or a work area.
• Foot-candle The foot-candle (fc) is the U.S. customary measurement of illuminance. One foot-candle is equal to 1 lumen/square foot. One foot-candle equals approximately 10.76 lux. One lux equals approximately 0.093fc.
Figure 5-2 shows the U.S. and SI units for measuring illuminance.
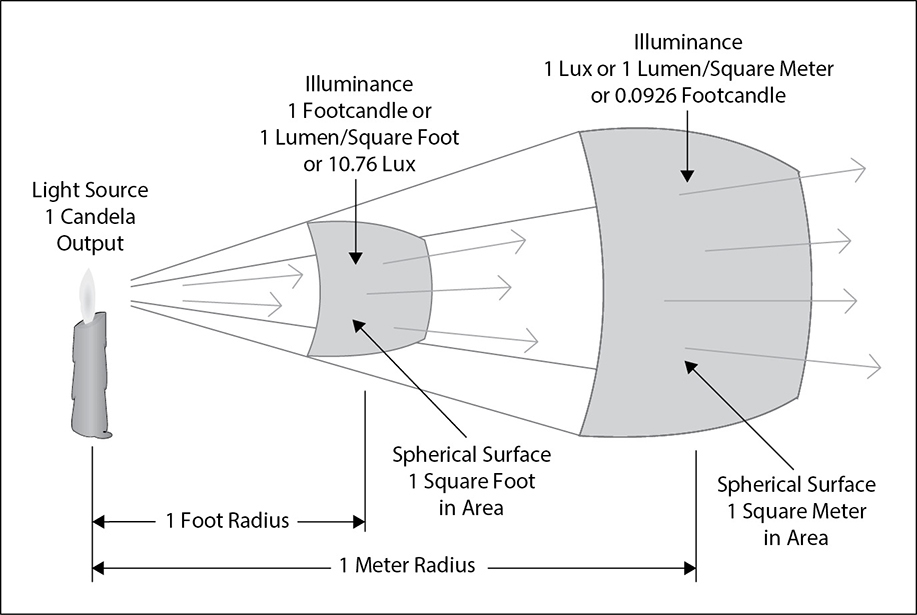
Figure 5-2 U.S. and SI units for measuring illuminance
Reflected Light Measurements
Using a reflected light or spot meter, you can measure the luminance of light emitted from a surface area. Two units are commonly used for luminance in the AV industry:
• Candela per square meter or Nit Sometimes referred to as the Nit (nt), the candela per square meter is the international unit of luminance. A nit is equal to a luminance of 1 candela per square meter.
• Foot-lambert The foot-lambert (fl) is the U.S. customary unit of measurement for luminance. It is equal to 1/π candela per square foot. A foot-lambert is approximately 3.43 candela per square meter.
Inverse Square Law and Light
As light radiates out in all directions from its source, the intensity of light falls away as the distance from the source increases, and it gets brighter as the distance from the source decreases. The inverse square law for light states that the intensity of light changes with the inverse of the square of the distance from the source. Put simply, if you double (increase by 2) your distance from a light source, the intensity will fall by a factor of 4 (1/22). Tripling the distance leaves you with 1/9 (1/32) of the original intensity, and increasing the distance by a factor of 5 will leave you with just 1/25 (1/52) of the original intensity.
Conversely, moving closer to the light source, the light will appear proportionally brighter as the inverse of the square of the distance. Halving the distance will increase the intensity by a factor of 4 (22). Decreasing the distance by a factor of 3 will increase the intensity by 9 times (32), and decreasing the distance by a factor of 5 will increase the intensity by 25 (52) times.
Color
Color is described using three dimensions: hue, value, and saturation.
• Hue The underlying spectrum color—red, orange, yellow, green, blue, indigo, or violet)
• Value/brightness The grayscale value of the color—its position on the scale between white and black
• Saturation/Chroma The saturation or amount of the hue—its position on the scale between a pale, pastel tint and a strong, bold color
In the Munsell color system all possible colors are represented in a cylindrical diagram using hue, value, and saturation to precisely locate every possible color.
Color Vision
In the retina of the human eye there are three types of color receptors (cone cells), each sensitive to only part of the visible spectrum. The receptors are identified by their color sensitivity: red, green, and blue. The brain processes the inputs from these three types of cones to produce our full-color vision. Red, green, and blue are the primary colors of light from which white and all other colors can be mixed. This process of mixing colors of light is known as additive mixing and can be used to produce the range of colors in video imaging systems and also in color printing, where the inks used are cyan (blue + green), magenta (red + blue), and yellow (red + green).
When mixing the pigments in paints and dyes that absorb (subtract) and reflect light, rather than producing it, the primary colors are red, yellow, and blue. These primaries can be mixed to create the full spectrum of colors through the process known as subtractive mixing.
If the cone receptors in your eyes do not cover the correct parts of the spectrum, you will exhibit some form of color confusion, generally known as color blindness. Only if you have no functioning cones in your retina will you have monochrome (scotopic) vision. However, at very low light levels, cone cells do not function, so in very low light everybody has scotopic vision. This is the basis for the sometimes clumsy “day-for-night” scenes in video productions where blue light is used to stand in for monochrome moonlight.
Color Temperature
White light is produced when a light source produces a mix of the main colors in the visible spectrum. All types of light source produce different distributions of the visible colors, so many types of white light have a different tint—some are actually reddish white, and others are bluish white. This difference in balance of the spectral colors is referred to as a light source’s color temperature.
Color temperature is the scientific measurement for expressing the distribution of the spectral colors radiating from a light source, expressed in Kelvin (K). As the Kelvin measure is a reference to the colors emitted from a theoretical hot object under defined conditions, the measurement is expressed in kelvin, never degrees. The higher the color temperature, the bluer the light. The lower the color temperature, the more orange the light. Table 5-1 lists the color temperatures of some common light sources.

Table 5-1 Color Temperature of Some Common Light Sources
Color temperature is important to visual display. Here are two examples of how you will see color temperature applied:
• Electronic cameras are substantially more sensitive to changes in light’s color temperature than the human eye. Setting the correct white balance is a critical step in producing good-quality images from any electronic imaging device.
• Most monitors and projectors have color-temperature selection and adjustment capabilities. These allow you to alter the white balance of an image for the lighting conditions in the environment or match projected images and monitor displays in a presentation.
Color Rendering Index
The color rendering index (CRI) of a light source indicates how accurately it shows the colors in the objects it illuminates. All light sources produce different quantities of the range of spectral colors—the CRI is measure of whether the full spectrum is present and in what relative proportions. By definition, the full spectrum light sources that produce light though incandescence have a perfect CRI of 100. Such sources include the tungsten filament in a lamp, the carbon in a candle flame, and the photosphere of the sun.
Most sources that produce light by other means—such as passing a current through a gas (sodium vapor), exciting a phosphor to glow (fluorescent), or passing a current through a semiconductor junction (LED)—have a lower CRI depending on the design and construction of the light source, as shown in Table 5-2. Special-purpose high CRI (but lower luminous efficiency) versions of some of these sources are available at higher prices.

Table 5-2 Color Rendering Index of Some Common Light Sources
Electronic cameras may have problems producing accurate images under light sources with a CRI under 60, even after a full white balance. The closer the CRI is to 100, the more accurate the color quality of the image. It can be important to render colors accurately when a client or a product has specific colors as part of their identity or brand.
Ambient Light
Ambient light is any light in a presentation environment other than light generated by the displayed image. Ambient light may strike the screen or the walls in the room and reflect onto the viewing area, competing with the displayed image by reducing contrast and washing out the picture.
The amount of ambient light in a display environment significantly impacts the quality of the displayed image, just as the acoustics of a room affect the sound quality in audio. High ambient light levels reduce the contrast of the display.
Ambient light can be reduced by ensuring that all unnecessary light sources in the viewing space are either extinguished or masked and that all necessary sources, such as presenter spotlights, note-taking lights, and document camera lights, are tightly controlled.
You will learn more about dealing with ambient light in Chapter 13.
Image Capture
Video is made up of a series of consecutive still images, similar to the individual frames on a strip of movie film. The camera uses a lens to focus an image on to a recording medium where each sequential image is captured. With film, when the camera shutter is briefly opened, the incoming light makes chemical changes to the film material. Once the shutter has closed, the film is then advanced in the camera ready to capture the next frame. In a video camera, instead of a piece of film capturing the image, there is a grid of microscopic electronic sensors that convert the image into an electronic pattern that is captured as a still frame of video. A video sequence is produced by capturing sequential electronic patterns, which are then processed into a signal format suitable for recording or transmission.
Camera and Focus
We’ll start with how the camera processes and projects the image, defining focal length, aperture, depth of field, and other related terms.
Focal Length
The focal length of a lens is the distance between the lens and the image sensor when the subject is in focus, usually stated in millimeters. In a camera, focal length determines how much of a scene is visible to the lens, as illustrated in Figure 5-3. This is usually called the angle of view. A wide-angle lens has a short focal length and shows a greater area than a telephoto lens. Telephoto lenses have a narrow angle of view and show less of the scene.

Figure 5-3 Focal length changes image size.
A zoom lens varies its focal length, which alters the angle of view. Lens specifications usually provide the angle of view for the lens. Zoom lenses have angle-of-view specifications for both wide and telephoto extremes.
Back Focus
Zoom lenses must stay in focus as the lens is zoomed from wide angle to telephoto. The adjustment used to ensure focus tracking is called back focus.
To manually set the back focus for a lens, you must repeat a two-step process:
1. Fully zoom in to a back focus chart, as shown in Figure 5-4. The image will be fuzzy in the center. Adjust the lens until the image is sharp and the blurred area smallest.
Figure 5-4 A back focus chart
2. Fully zoom out to the widest angle and adjust again.
Repeat these two adjustments until the image remains focused from wide to telephoto.
The back focus adjustment may be made via an adjustment ring on the lens close to the camera body, or in single-sensor cameras, it may be via an adjustment to the image-sensor position.
Aperture
The aperture is the opening in a lens. The iris controls the aperture, regulating the amount of light passing through the lens to the image sensor, to create the required exposure.
The aperture of a lens is measured in f-stops. An f-stop is based on the relationship between the diameter of the lens opening and the focal length of the lens. When the iris is stopped down, the aperture is very small, letting in very little light. The larger the f-stop number, the smaller the lens opening, and the less light allowed in. Table 5-3 lists some common f-stop values. An f-stop of f/2 lets in more light than f/2.8, but less than f/1.4. Each f-stop in this sequence lets in half or twice as much light as the one next to it.
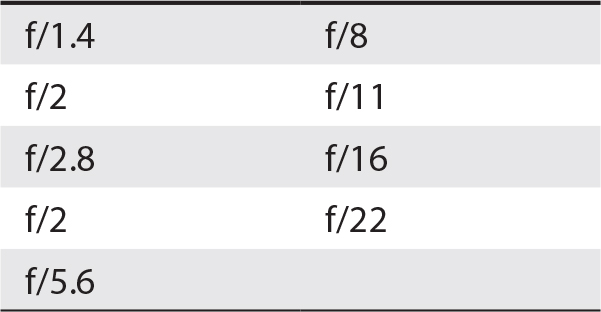
Table 5-3 Some Common F-Stop Values
Depth of Field
The distance between the nearest object in focus and the farthest object in focus is called depth of field. Anything out of the range of a particular lens’s depth of field will be out of focus.
The flowers in the front and back of the image in Figure 5-5 are out of focus. The area that is in focus is within the depth of field. When capturing an image, you can adjust the iris of the lens to ensure you are capturing the desired depth of field.

Figure 5-5 Using depth of field to highlight an apple
The depth of field in an image is directly dependent on the aperture of the lens. The smaller the lens aperture, the greater the depth of field. Dimly lit scenes have a smaller depth of field because the iris of the lens is opened wider to admit enough light for a proper exposure. A pinhole camera lens has a very large depth of field and requires no focus adjustment.
Imager and Prism
Once light has passed through a video camera’s lens, it strikes the image sensor chip, often called the imager. In some cameras used for high-quality color applications, three separate imagers are used: one for each primary color of red, green, and blue. To split the incoming image to each of the three primary colors, a prism divides the beam and passes it through precise dichroic filters to separate out the color components of the picture, as shown in Figure 5-6.
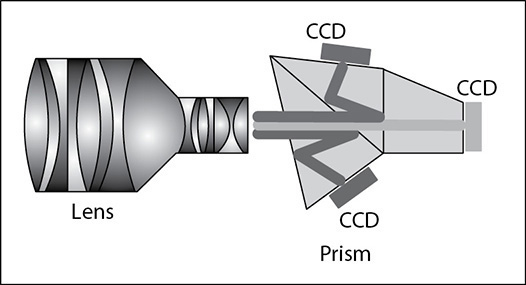
Figure 5-6 A lens with a prism and three charge-coupled image sensors
In a single-imaging device camera, there is no prism. The imaging device has color filters applied to the imager on a pixel-by-pixel basis during manufacture. The pattern of the filter layout differs depending on the design of the camera.
Imagers
There are two common types of imagers: complementary metal-oxide semiconductor (CMOS) and charged-coupled device (CCD). These imagers are made up of arrays of hundreds of thousands of light-sensing elements. The group of red, green, and blue light-sensing elements that combine to produce a single-color picture element in an image are called a pixel (picture element). The individual light sensor elements on an imager are usually called pixels too.
Light sensors vary in sensitivity and resolution, creating a difference in image quality and camera cost. Some high-quality cameras used in broadcast and digital cinema use three imaging chips, one each for red, blue, and green light, but the majority of cameras for all applications use a single imager.
An imager will output a frame of captured video at the frame rate of the selected video standard. Imagers designed to be used with the now-obsolete North American NTSC broadcast standard will output at 29.94 frames per second, while those designed to be used with the now-obsolete PAL broadcast standard will output at 25 frames per second. Imagers producing pictures for digital video, digital broadcast, and large-format AV production may operate at frame rates varying from 24 frames per second up to 120 frames per second. That means the imager will collect light that particular number of times and then send out the electronic signal. Higher frame rates create a larger signal and better motion accuracy.
Video Shutter
Too much light can overload an imager. The electronic shutter helps avoid overloading by regulating how much time the imager accepts incoming light. Shortening the time will reduce the voltage-level output of the imager, so overloading is greatly reduced.
Shutter speed settings are defined using frame rates. It is important to remember that this frame rate affects only the imagers, not the video output frame rate.

NOTE Be careful to choose the appropriate shutter for your application. A scene involving fast motion calls for a higher shutter speed. If the shutter is too slow, the resulting image may look jerky, or stuttered.
Video Signals
There are two groups of components in a video signal:
• Color signals
• Synchronization signals
Color Signals
The light focused on a camera’s imager system is separated into the image’s primary color components: red, green, and blue signals. These three signals are commonly referred to as RGB. These color signals must be combined with synchronizing information, typically called sync.
Horizontal and Vertical Signals
Sync preserves the time relationship between video frames and correctly positions the image horizontally and vertically. This information is called horizontal sync and vertical sync, usually abbreviated H and V. So, R, G, B, H, and V are the five basic elements of video signals. They contain all the information needed for a complete video image.
Video signals were originally scanned line by line, in both the camera used for capturing images and the television picture tube used for displaying them. While the technology used to capture and display images has changed dramatically, a form of image scanning still takes place in all video systems.
Horizontal and vertical sync signals define the edges of an image. Without these signals, your picture would roll from side to side and from top to bottom.
Inside each camera is a sync generator that produces the horizontal and vertical sync pulses. Horizontal sync pulses are used to time the edges of the image. They determine the point where the pixels end on the right edge of the screen. Vertical sync pulses are used to time the top and bottom of the screen. Vertical sync begins at the bottom-right pixel.
Syncing signals are also used to ensure smooth switching between video sources, enabling switching to occur during the short interval between complete video frames. This is known as vertical interval switching and is the preferred source switching process for all video systems. The switching of sources at any point other than during the vertical interval is known as crash switching and produces a burst of picture instability until the video system re-synchronizes.
Scan Rates
Horizontal and vertical sync signals define the edges of the image. The horizontal scan rate describes the number of horizontal lines displayed per second. The vertical scan rate is the amount of time it takes for the entire image, or frame, to appear since all the horizontal lines must be present for the image to be complete vertically. Together, the horizontal and vertical scan rates are known as the scan rate.
The number of horizontal scan lines in an image depends on the video content. For example, a DVD might be 780×480 pixels, with a refresh rate of 30 frames per second, while a computer might be 2,560×1,440, with a refresh rate of 60 frames per second. For both of these types of content to be viewed on the same display, the display must be capable of playing back both scan rates.
Table 5-4 shows a select sample of scan rates for the visible pixels in analog video, digital video, and computer graphics.

Table 5-4 Video Format Characteristics
Each standard also defines the scan rate according to a specific horizontal frequency, the number of horizontal lines a device delivers each second, measured in kilohertz. Because many horizontal scans are completed in just one vertical scan, the horizontal scan has a higher frequency than the vertical scan. The vertical scan rate describes the number of complete video fields delivered per a second, measured in hertz. This may also be called the vertical sync rate. Many modern video displays are capable of displaying more video frames than the source may be delivering, and they can refresh the image at a higher frequency.
Some older display technologies were unable to display all of the horizontal lines in a video frame at the same time, resulting in a system that displayed odd-numbered lines in one display pass and even-numbered lines in the next display pass. This method of display scanning is known as an interlaced display and indicated with an i suffix (such as 480i), while a system that can display all lines in a single pass is known as a progressive display and indicated with an p suffix (such as 1080p). The rate for an interlaced image is one-half that of the vertical scan rate.
Bit Depth of Video Signals
As you saw in Chapter 3, the bit depth of a digital signal is a measure of how accurately that signal can potentially be translated back into an analog signal at the end of its journey to a video imaging device or an audio device. As the technologies used in digital imaging devices and video display systems continue to increase in available bit depth, the accuracy of picture reproduction continues to increase. Although the color bit depth has mostly remained at 8 bits per channel (RGB), High Dynamic Range images are increasingly popular for the capture of subtle luminance detail of an image, although some image display systems are not yet able to render the extra bits.
The bit depth of the color channels of video images has been steadily increasing since the introduction of wide-color gamut technologies such as UHD Blu-ray, which offers 10 bits of color resolution per channel. Some image composition software can work at 16 bits per color channel, but displays with this capability are not yet widely available.
Signal Quality and Bandwidth
After video has been captured and converted into signals, you need to transport those signals to devices for display. High-resolution video images take up a lot of bandwidth. To preserve image detail, you need high-quality cable, as well as video equipment that can switch, process, and distribute these signals without degrading them.
In electronics, bandwidth is the range of frequencies that can pass through a circuit. The difference between the highest and lowest frequencies a circuit can detect and react to is that circuit’s bandwidth.
A video signal covers a range of frequencies:
• Lower frequencies, in the hertz range, include vertical sync.
• Middle frequencies, in the kilohertz range, include horizontal sync.
• Higher frequencies, in the megahertz range, include detailed picture information.
Full-Bandwidth Signals
The combination of the three color signals plus sync or timing signals makes up all of the information contained in the image converted by the camera’s sensors. This is a full-bandwidth RGBHV signal that requires five cables to carry the signal—one cable for each color signal (RGB) and one each for the horizontal (H) and vertical (V) sync signals.
Bandwidth Limiting
Bandwidth limiting is necessary to transmit complex signals over a limited band of frequencies. It is achieved through filtering and encoding. Values of red, green, and blue color channels are reduced to smaller values. While an encoded signal takes up less bandwidth, the process of encoding and decoding adds some noise and artifacts that affect the quality of the signal.
Digital Signals
Like analog video systems, digital video devices also output RGBHV signals, but their output usually includes control signals and possibly also audio.
Figure 5-7 and Figure 5-8 show the cable and connectors used with computers.

Figure 5-7 A VGA connector carries analog RGBHV signals.
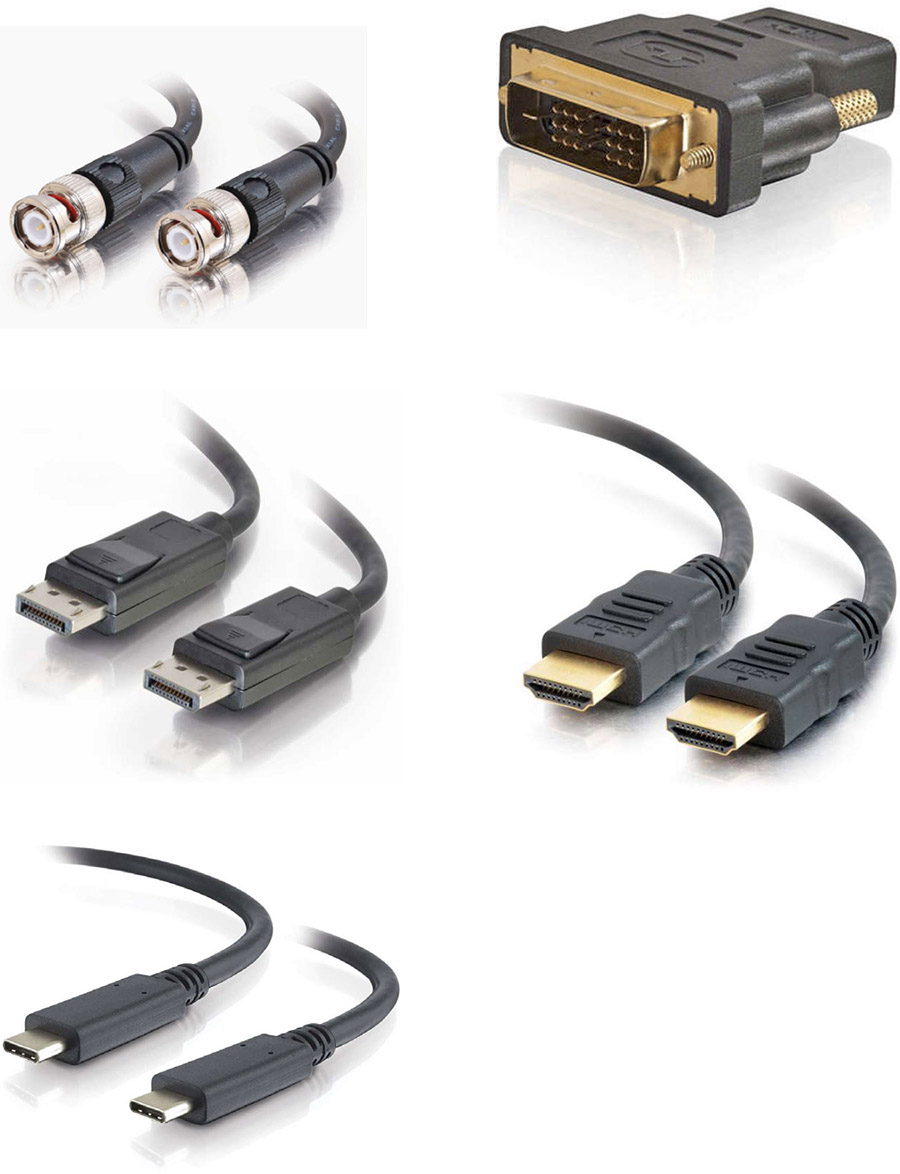
Figure 5-8 Digital video connectors L to R, Top to Bottom: SDI, DVI, DisplayPort, USB type-C
The following are the major formats of digital video connections:
• Digital Visual Interface (DVI) DVI was the first accepted digital standard for computers. DVI comes in several versions: DVI, DVI-D, DVI-I, and Mini-DVI.
• High-Definition Multimedia Interface (HDMI) HDMI builds on the DVI standard by adding audio, EDID device control, HDCP content protection, and Ethernet. HDMI is backward-compatible with DVI. HDMI comes in HDMI, Mini-HDMI, and Micro-HDMI versions.
• DisplayPort DisplayPort also builds on the success of DVI and uses a similar yet not completely compatible format to send video and audio. DisplayPort is also available in a Mini-DisplayPort version.
• HDBaseT HDBaseT incorporates the signals of HDMI, Ethernet, control protocols, USB, and 100W of DC power into a single standard UTP (Category 5e and beyond) cable, terminated in a standard modular Ethernet connector (8P8C known as RJ45).
• Serial Digital Interface (SDI) SDI is a set of serial data standards developed by the Society of Motion Picture and Television Engineers (SMPTE) to transport digital video data over the BNC-terminated 75Ω coaxial cable originally used for professional analog video. Variants include HD-SDI for HD video, 6G-SDI (6Gbps) for 4k, and 24G-SDI (24Gbps) for 8k video. SDI data includes audio and control information, but not content protection. SDI can also be transported over optical fiber.
• USB USB is a general-purpose digital data bus that can carry any form of digital data, including a serialized video data stream. Since USB version 3.1, the type C USB connector can be switched into an Alternate (Alt) signaling mode that allows it to be configured to carry a variety of digital signals including HDMI and DisplayPort.
• Ethernet Ethernet is a network transport protocol that can carry a variety of data formats over data networks. There are many Ethernet streaming video data formats that support the real-time interconnection of video sources such as cameras and playback devices with display devices such as video screens and projectors. The Ethernet protocol runs over a variety of network media, including wired, optical fiber, and wireless links.
Creating the Digital Image
Signals sent from different digital devices may be in many different resolutions, frame rates, and aspect ratios. The display device should always be considered when selecting the output resolution and aspect ratio. You will learn more about aspect ratios later in this chapter. Not all displays can synchronize to all resolutions, and not all resolutions will look good on all displays.
A display device has a native resolution, which is the resolution that is optimized for the display. For example, if a display has 1,920 rows of pixels horizontally and 1,080 columns of pixels vertically, it has a native resolution of 1,920×1,080. The native resolution is primarily thought of as the resolution of the display engine or pixel count of the screen or projection device. Selecting the native resolution of a display device for system output avoids image scaling processes and will generally produce the best picture quality.
The Video Electronics Standards Association (VESA) coordinates computer resolution standards. There are approximately 50 different computer resolution standards, not including variations of each standard. VESA also defines the extended display identification data (EDID) standard. EDID communicates a digital display’s capabilities to connected video sources. Managing digital video equipment that utilizes EDID can be a challenge for AV professionals, particularly where multiple display devices are being driven from the same video source.
Computer Output Bandwidth
A characteristic of computer signals is the ability to change the resolution of the computer graphics output to meet your needs. As you increase or decrease the resolution, the amount of bandwidth required to support the signal changes. This is a direct relationship: an increase in resolution means an increase in bandwidth.
The output of the computer is RGB, which has a much larger bandwidth than most video signals. A computer can display many different resolutions. To determine the bandwidth of each resolution, you can use the following formula:
[(TP × FR)/2] × 3 = signal bandwidth in Hz
where TP is the total number of pixels in one frame and FR is the frame rate.
To calculate signal bandwidth, take the following steps:
1. Determine the total pixels in the picture by multiplying the number of horizontal pixels by the number of vertical pixels.
2. Multiply the total pixels by the frame rate.
3. Divide the result by 2 to indicate half the pixels on (white) and half off (black). This is the highest video resolution possible.
4. Multiply the result by 3 to leave room for the third harmonic. Accounting for the third harmonic ensures that the signal edges remain sharp at the display device.
The result is the bandwidth in hertz of your computer signal output. Red, green, and blue all share the same bandwidth value.
For example, for an HD 1,920 × 1,080 × 60 screen, the bandwidth is 186.6MHz.
Producing an Image
Up to this point, you have captured an image from either a camera or a digital video device and have encoded and decoded the signal. To figure out what kind of display device to use, you need to know what you want to display. Think about the kind of media you are viewing. Is it analog video, computer data, analog data, or digital media?
The content affects how large an image must be for viewers to see the necessary detail. This is especially important when displaying images such as spreadsheets and other text-heavy presentations. In projection, image size determines screen size and display placement.
Display and Projection Technology
Once you know what you want to display—and the environmental conditions under which you’ll display them—you can proceed to display types and technologies. Display types include display panels, video walls, electronic whiteboards, projectors, and traditional graphics. The AV industry is primarily concerned with electronic display, but traditional graphic displays such as flip charts and whiteboards are still used in some applications. Many AV systems incorporate a display panel, a projector and screen, or both.
Visual displays send light to our eyes for viewing. Displays can use three methods.
• Transmissive Rear-screen projection uses the transmissive method, as shown in Figure 5-9. The light from a projector is projected onto a translucent rear screen, and the light transmits through the screen. The advantages of transmissive displays include good contrast ratio, the possibility of working close to the screen without shadowing, and the possibility of large displays. However, they require more space for projection than front-screen projection, and hot spotting is possible. Liquid crystal displays (LCDs) that have backlights or reflective backings are also classified as transmissive.
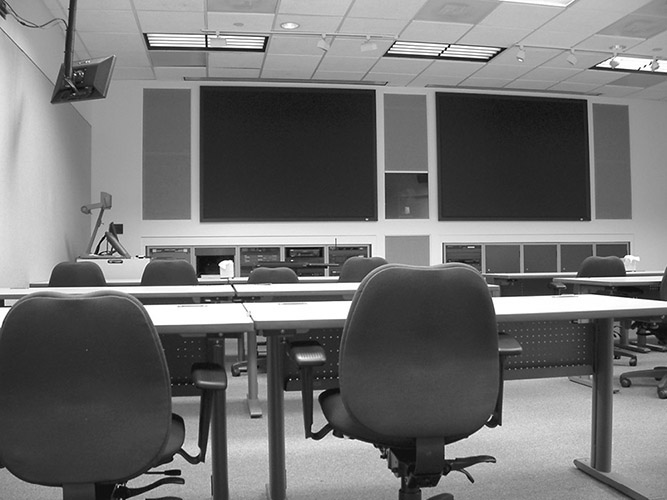
Figure 5-9 Transmissive rear-projection screens
• Reflective Front-screen projection uses the reflective method, as shown in Figure 5-10. The light from a projector reflects off a screen and hits our eyes. Reflective applications allow for the possibility of large displays and are easy to install. However, front projection has a lower contrast ratio than other methods, and because the projector is located in the room, it creates potential for fan and projector noise in the audience area.
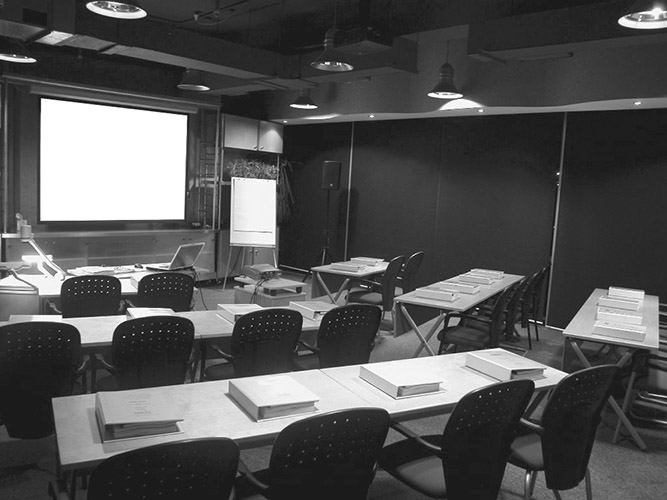
Figure 5-10 An AV space with a reflective front-projection system
• Emissive LED, organic light-emitting display (OLED), and microLED displays use the emissive method. The light is created by the individual elements of the display and sent directly outward.
Different technologies can be employed for either projectors or displays. For example, an OLED display uses emissive technology, while an LCD panel uses transmissive technology. To the users, many flat-panel displays can appear similar.
Flat-Panel Display Technologies
Monitors, flat-panel displays, flat-screens, video walls—they are all terms for a common type of display technology. The prominent flat-panel technologies include LCD, OLED, LED, and microLED. The pixel resolution of a display is known as its native resolution.
LCD
LCDs use a grid of pixels to create images on a screen. Each pixel on the screen is filled with a liquid crystal compound that changes its optical properties in the presence of an electric field.
To create an LCD pixel, light must first pass through a polarizer. A polarizer is a set of extremely fine parallel lines that act like a net, or filter, blocking all light waves that are not parallel to those lines. The polarized light then travels through a sandwich of transparent switching transistors and liquid crystals. LCDs use two sheets of polarizing material. The liquid crystal solution is sealed between them. When a transistor is turned on, a specific voltage is applied to its pixel. The tiny liquid crystals within each pixel act like light shutters, passing or blocking varying amounts of light. As polarizing filters cannot block 100 percent of the incoming light, the “black” from LCD panels is actually dark gray.
Each transistor must be shielded from the light that goes through the LCD, so it is covered with a nontransparent chemical layer called the black matrix. The black matrix also creates a defined edge around every pixel, causing a visible “screen door” effect on lower-resolution displays. The ratio between the remaining transmissive surface of each pixel and the total surface of the LCD is called the aperture ratio. The smaller the transistors are in comparison to the size of the pixel, the higher the aperture ratio, and the more light that will pass through. Higher aperture ratios result in fewer image artifacts, such as the screen door effect.
A color LCD has three filters in each imaging pixel array, one for each primary color: red, green, and blue. The backlight can be LEDs or compact fluorescent tubes. The LEDs can be clustered in groups with red, green, and blue elements, or only white LEDs. LEDs have lower power consumption than compact fluorescent tubes, higher brightness, wider color range, better white balance, and longer life, and they can include local area dimming for higher contrast.
LED
Light-emitting diode (LED) displays are a matrix of red, green, and blue LEDs, grouped to form the pixels of the display. An LED consists of a junction between two differently doped crystalline semiconductor materials (a PN junction). When a voltage across the PN junction is polarized the right way, conduction electrons in the lattice on the N side of the junction are absorbed by holes in the crystal lattice on the P side, allowing a current to flow. As each electron crosses the junction, a photon of light is emitted. The structural difference between the two materials forming the junction determines the wavelength of the emitted light.
LEDs are emissive devices, meaning that they create their own light, as opposed to LCDs, which require a separate light source: the backlight. As a result, LED displays have much higher contrast ratios, faster pixel switching times, and operational lives in the hundreds of thousands of hours, and they are capable of higher brightness and a wider color gamut than LCDs.
Individual LED chips or full-pixel clusters of RGB LED chips are mounted into modules that carry physical framing and linkages in addition to power and signal distribution systems. Multiple modules can be connected to form screens of arbitrary large sizes and shapes. Modular LED screens are often seen in large spaces, in concert productions, and at public events.
MicroLEDs are very small (1 to 10µm) crystalline LEDs with the same characteristics as their larger brethren. Their minute size presents difficulties in mounting and connecting them into display panels, but at the same time the size makes them suitable for very high-resolution displays. As MicroLED pixels are quite physically small, the spaces between them are relatively large. This enables a black background between pixels to absorb ambient light and produces high-contrast images and much deeper blacks than LCD panels.
OLED
OLED technology is based on organic, carbon-based, chemical compounds that emit light when an electric current flows through the device. There are separate organic compounds for red, green, and blue.
OLED devices use less power than LCDs, have much higher contrast ratios, and may be capable of higher brightness and a wider color range than LCDs.
OLEDs are imprinted on a very thin substrate. The active matrix silicon-integrated circuits are imprinted directly under the display, controlling the power to each organic point of light diode (pixel) and performing certain image control functions at a very high speed. OLEDs’ capability to refresh in microseconds rather than milliseconds, as LCDs do, creates highly dynamic motion video. As with microLEDs, the small physical size of OLED pixels facilitates high-contrast images with rich blacks.
However, OLEDs have a relatively short life span, exhibiting progressive degradation of output, particularly in the shorter wavelengths—seen as blue fading.
Positioning a Display Within a Room
Before deciding where to place a display, you should consider the size of the display and how far away viewers are likely to be. The optimum viewing area is determined by the video display size, location, and orientation within the room. The size of the display needs to be sufficient for the farthest viewer in the room. Either the display size or the farthest viewer distance can be the starting point for calculations when laying out a room.
The maximum viewing distance is based on the amount of detail in the image. AVIXA has developed the standard AVIXA V202.01, Display Image Size for 2D Content in Audiovisual Systems (DISCAS), which provides a calculation and assessment tool for determining proper display image size and optimal viewing distances, based upon viewer needs. The complete DISCAS standard is available from the Standards section of the AVIXA web site at www.avixa.org.
Calculations based on the DISCAS standard can be used to do the following:
• Plan and design new displayed image systems
• Determine image size relative to space and viewing requirements
• Determine closest and farthest viewer positions
• Determine horizontal angles of view
• Provide metrics for content design
An online tool is available on the AVIXA web site to perform the calculations contained in the standard. Figure 5-11 shows one of the calculation tools available on the AVIXA web site (www.avixa.org) for performing the DISCAS calculations.
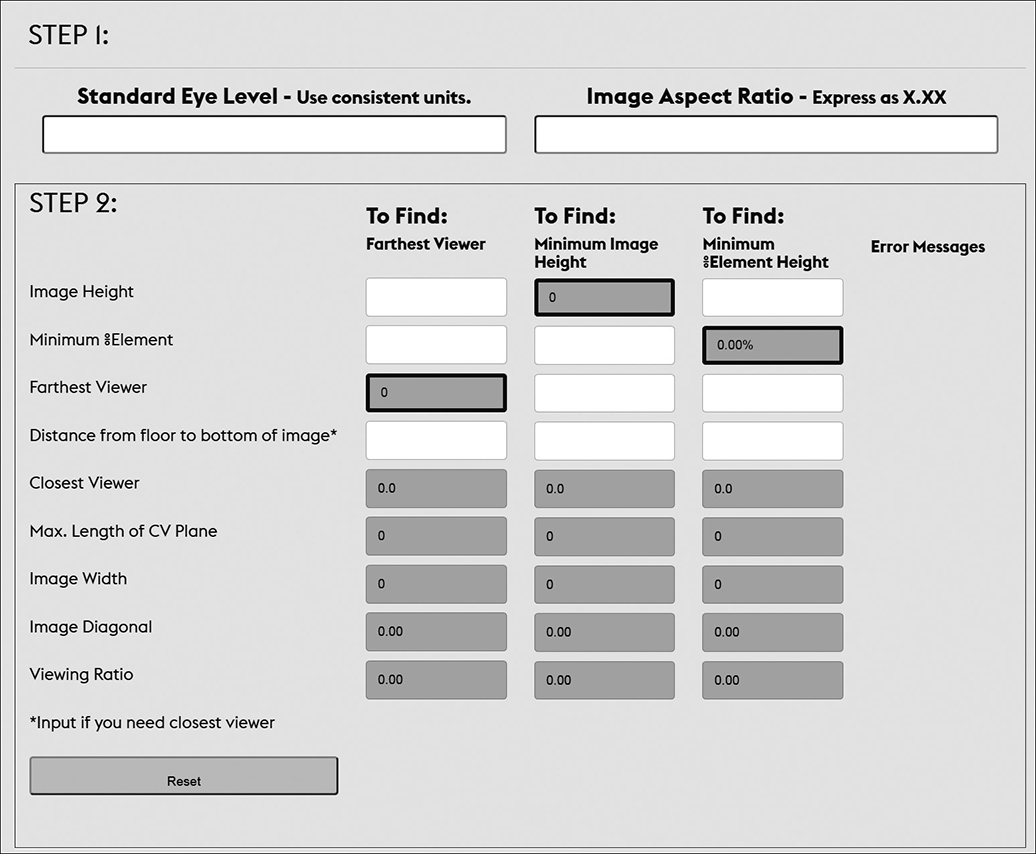
Figure 5-11 The DISCAS basic decision-making calculator on the AVIXA web site
You’ll learn more about viewing angles in the “Viewer Placement” section later in this chapter. You’ll also learn about sightlines in Chapters 13 and 14.
Aspect Ratio
Human vision is oriented horizontally because our angle of view is wider than it is high. Our brains also tend to underestimate the width of an image, which is why silent movies and old television screens appear to be square, despite being 1.33 times as wide as they are high. Most visual display systems are wider than they are high, with the relationship between image width and image height known as the aspect ratio of the image, as shown in Figure 5-12.
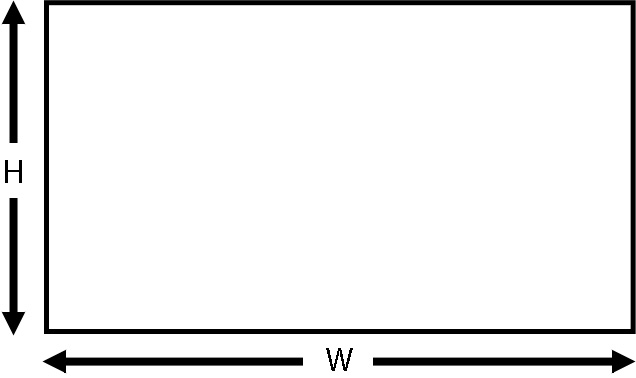
Figure 5-12 The two dimensions that determine aspect ratio
Aspect ratio is used to help determine appropriate screens, image areas, display devices, and projector lenses. For example, some video monitors have an aspect ratio of 4:3 (four units wide and three units high), while a flat-panel television display has an aspect ratio of 16:9. An alternate way to represent an aspect ratio is by dividing the first number (width) by the second number (height); for example, 4:3 is also stated as 1.33:1.
Different presentation media have different aspect ratios. While standard widescreen video is 16:9, a computer display might be 16:10. And that same computer display can be mounted in a portrait orientation, causing the aspect ratio to change to 10:16, as illustrated in Figure 5-13.
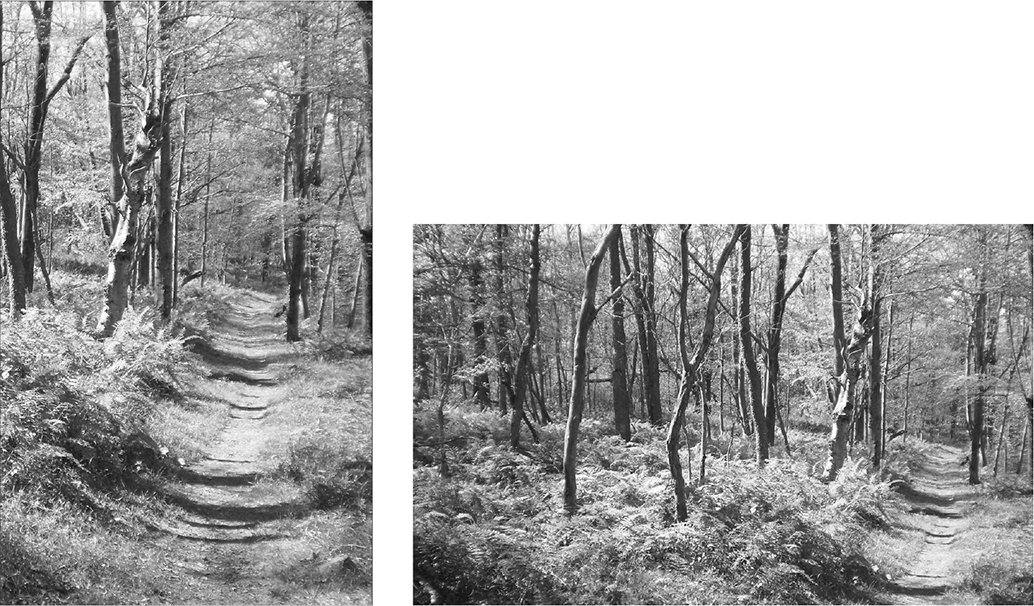
Figure 5-13 Images in portrait orientation (left) and landscape orientation (right)
NOTE Some project specifications may be for displays in portrait orientation, which will reverse the aspect ratio from what you might expect. Always double-check the specifications.
Table 5-5 shows some common digital media formats and sizes.
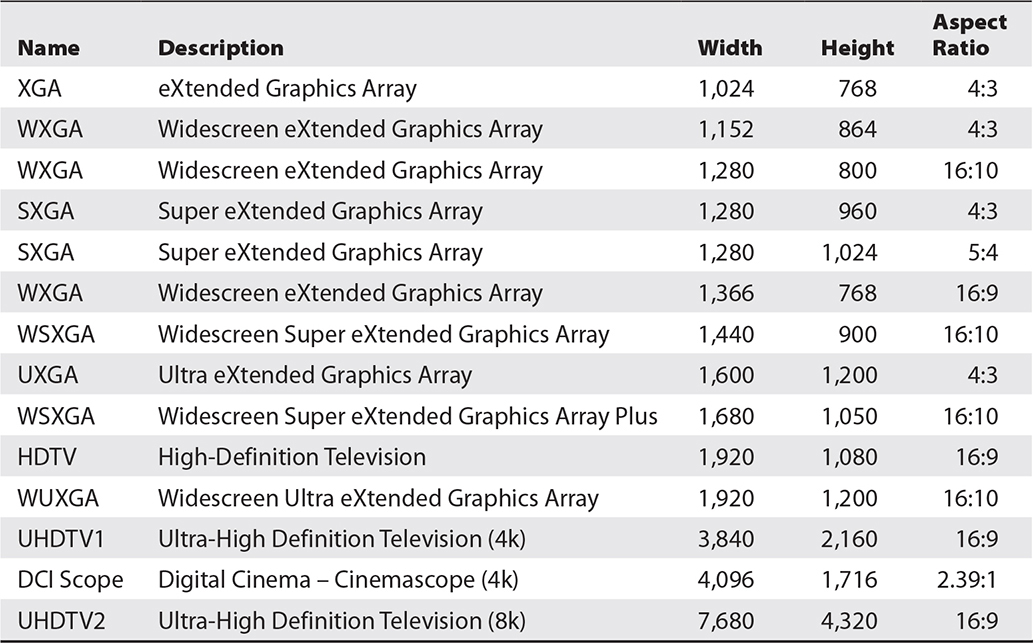
Table 5-5 Media Formats, Sizes, and Aspect Ratios
The aspect ratio of an image can be calculated from the width and height of the image, using the formula:
Aspect ratio = image width/image height (W/H )
Aspect ratios may be quoted as a whole number ratio such as 16:9 or as a decimal ratio such as 1.77:1. Once you have the aspect ratio as a decimal number, it is straightforward to calculate either the height or the width if the other is known.
The decimal aspect ratio of an image can be calculated using the aspect ratio, width and height, using the formula:
Decimal aspect ratio = ratio width/ratio height
As shown in Table 5-6, two of the more common ratios, 16/9 (1.777777…) and 4/3 (1.333333…), are repeating decimals. It is more accurate to use at least four numbers after the decimal point for your calculations.
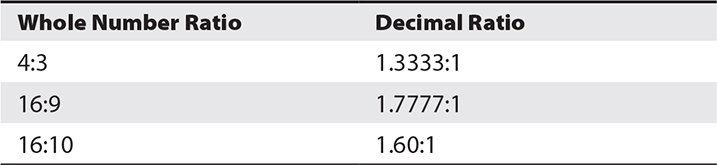
Table 5-6 Common Display Aspect Ratios in Whole Number and Decimal Formats
The height of an image can be calculated using the decimal aspect ratio in the formula:
Image height = image width/decimal aspect ratio
The width of an image can be calculated using the decimal aspect ratio in the formula:
Image width = image height × decimal aspect ratio
The Projected Image
Projection is frequently used when large images are necessary and the ambient lighting can be controlled. The design of a projection environment is critical to creating a successful projection system. The environment significantly impacts the perceived quality of the displayed image. In projection systems, room-lighting designs and the selection of the screen materials are important to achieve high-quality images.
Projected images use additive light mixing to achieve the full range of colors. The projection system’s brightness is extremely important, as is the contrast between the bright and dark areas of the image. As black is the absence of any projected image, the screen can get no darker than when the projector is turned off.
A projection system includes the projector and its optics system, screen, and quality of setup.
Projector Optics
Projector optics consist of a system of light sources, optical devices, and lenses that carry and focus an image on a screen for a viewer to see. A projection device operates at optimum performance only when used with the light source it was designed to use.
The lens that focuses the image onto the screen is referred to as the primary optic. Four factors related to primary optics influence the quality of the projected image: refraction, dispersion, spherical aberration, and curvature of field.
• Refraction Refraction is the bending or changing of the direction of a light ray when passing through the boundary between different materials, such as between glass and air. How much light refracts, meaning how great the angle of refraction, is called the refractive index. The refractive indexes of the materials used in a lens have an impact on the image quality from that lens.
• Dispersion Dispersion can be seen when a white light beam passes through a triangular prism. The different wavelengths of light refract at different angles, dispersing the light into its individual components. Lenses with strong dispersion can produce images with color fringes, known as chromatic aberration.
• Spherical Aberration Light passing through the edge of a spherical lens leaves the lens at a different angle to the light passing through the center of the lens and so has a different has a different focal length. The resulting distortion is called spherical aberration.
• Curvature of field Curvature of field results in blurry appearance around the edge of an otherwise in-focus object (or the reverse). This is the result of a curved lens that projects a curved image field onto a flat surface such as projection screen. The more steeply curved the projection lens and the closer it is to the screen, the more noticeable is the effect. Very short focal length (wide angle) spherical lenses have steep curves.
Lamp-Based Light Sources
In lamp-based optical systems, the lamp works with a reflector to collect and direct the light. The lamp reflector may be internal or external. Figure 5-14 shows three lamp and reflector configurations.
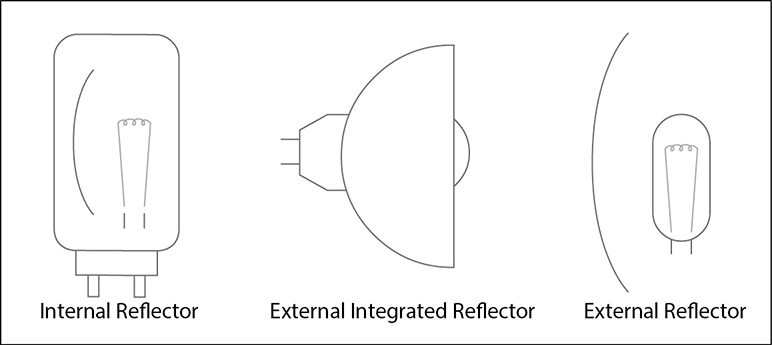
Figure 5-14 Three types of lamp and reflector configurations
There are three light source technologies used in lamp-based projectors:
• Tungsten halogen Tungsten halogen, also known as quartz halogen or QI lamps, produce light by passing a current through a length of tungsten wire until it becomes white hot. To prevent the tungsten from boiling off the filament and blackening the lamp’s quartz glass envelope, the envelope is filled with halogen gas. Although relatively inexpensive, these lamps are somewhat low in output, energy inefficient, and have short lives.
• Metal halide discharge Metal halide discharge lamps produce light by passing a current between a pair of tungsten electrodes immersed in a high-pressure mixture of metal-halide gasses. This causes the gasses to ionize and discharge light. There are a wide range of gas mixes, electrode configurations, and quartz envelope shapes available in a wide range of outputs and physical sizes. Discharge lamps are significantly more efficient than tungsten halogen lamps and tend to have much longer lives.
• Xenon arc Xenon arc lamps produce light by passing a current between a pair of tungsten electrodes immersed in an extremely high-pressure atmosphere of the inert gas Xenon. The Xenon plasma produced by the arc glows to produce light. Xenon arc lamps are very energy efficient and available in very high-output versions. The extreme gas pressure inside the quartz envelope makes them hazardous to handle, and high-output lamps can be difficult to change safely in situ.
Solid-State Light Sources
Solid-state light sources include a mix of LED sources, diode lasers (laser LEDS), and phosphor materials excited by LEDs and lasers. In some configurations the sources are a mix of red, green, and blue LEDs to produce white light. In others, some of the light comes directly from LEDs, and some comes from phosphor materials illuminated by LEDs or lasers. In RGB laser systems, the light comes from the diffused beams of red, green, and blue lasers. The configurations vary between manufacturers and models. Solid-state light sources are energy efficient and have lives in the tens of thousands of hours, which in some cases approach the total operational life of the projector.
Video Projection Technologies
The technologies for forming an image for projection have developed considerably since the video projector replaced slides and film as the major source of projected audio-visual images. Video projection technologies in current use include LCD, DLP, and direct laser.
LCD
The LCD technology used in projection works on the same light-blocking principle described earlier for LCD display panels. Light from the projector’s light source is split into the three video primary colors—red, green, and blue. Each color of light is passed through a separate LCD panel, which creates the pixel pattern for that color component of the image. When all three color images are optically recombined, the additive color behavior of light results in full-color images that are passed through the projection lens to the projection surface. This class of projector is known as a 3LCD device.
DLP
Digital Light Processing (DLP) projectors use an array of thousands of individually controlled microscopic mirrors on a digital micromirror device (DMD) chip to display images on screen. The individual mirrors, only microns in size, independently tilt back and forth over a small arc to reflect or block light, as shown in Figure 5-15. When a mirror is tilted on, light reflects through the projection lens. When the mirror is tilted off, the light is reflected to a light absorber.

Figure 5-15 Microscopic mirrors in a digital micromirror device
Because DMDs have only two states—on and off—pulse-width modulation (PWM) is used to create shades of gray in images. In a PWM system, the ratio of “on” cycles to “off” cycles within a specific time interval creates a particular luminance value. The on-off cycle is so fast in a DMD that our eyes don’t perceive any flicker.
Color in DLP projection systems is created in one of two ways:
• 3DLP Similarly to a 3LCD system, light from the projector’s light source is split into the three video primary colors—red, green, and blue. Each color of light is directed at a separate DMD chip, which creates the pixel pattern for that color component of the image. The images from the three DMD chips are optically combined to form an additive full-color image.
• Single-chip DLP In these systems, a single DMD device produces the entire image. It is alternately illuminated at high speed by the component colors—usually, but not always, red, green, and blue—to form an additively mixed full color image due to the viewers’ persistence of vision. The alternating colors illuminating the DMD are usually generated by passing the white light from the projector’s light source through a rapidly spinning filter wheel that has segments of each of the component colors. The color wheel is synchronized with the patterns being sent the DMD chip.
Direct Laser
Direct laser projections systems use a scanning mirror device to draw out the image directly on the projection surface using separate primary color beams from a collimated, narrow-beam laser source. Each frame of the image is scanned line by line, similarly to the raster pattern on CRT screens.
Front Projection and Rear Projection
With front projection, the viewer and the projector are positioned on the same side of the screen. A front screen is simply a reflecting device. It reflects both the desired projected light and the unwanted ambient light back into the viewing area, so front-screen contrast is dependent on the control of ambient light.
Front-screen projection generally requires less space than rear projection. It offers simplified equipment placement. In front projection, the projector is in the same space as the viewer. This can result in problematic ambient noise from cooling fans in the projector. Another downside is that people, especially the presenter or instructor, can block all or part of the image by walking in front of the projected light. Ultra-short throw projectors have helped to address this problem by allowing substantial screen coverage from throws less than 18 inches (500mm). Front projection may be used because of its lower cost or because of space limitations behind the screen.
Rear projection is a transmissive system where light passes through a translucent screen toward the viewer. Rear projection needs more space for installation because it requires a projection room or cabinet behind the screen to accommodate the projector. Mirrors are commonly employed in rear projection applications to fold the projector’s optical path, thereby saving depth.
The primary advantage of using rear projection is that the equipment is not in the same room with the viewer, eliminating equipment noise and shadows on the screen when the presenter walks in front of the screen. Rear projection also handles ambient light issues better than front-screen projection.
Screens
Projectors require a surface to project upon. This surface is typically a screen. Optimum performance from any projection system is dependent equally on the screen and the projector.
A screen’s surface coating greatly influences the quality and brightness of a video projector’s image. A well-designed projection system incorporates a screen type that reflects projected light over a wide angle to the audience, while minimizing the reflection of stray light. Stray light causes a loss of contrast and detail, most noticeably in the dark areas of the image.
The commercial AV industry uses many types of screens, each suited to a particular purpose. The two major categories of screens are those used in front-projection applications and those used in rear-projection applications.
Screen Gain
Projection screens are passive devices and cannot amplify or create light rays. They can reflect light rays back at wide or narrow angles, thereby providing gain, or brighter images.
Screen gain is the ability of a screen to redirect light rays into a narrower viewing area, making projected images appear brighter to viewers sitting on-axis to the screen. The higher the gain number of a screen, the narrower the viewing angle over which it provides optimal brightness.
A matte white screen, such as the one shown in Figure 5-16, is usually made of magnesium carbonate or a similar substance that provides a perfect diffuser for the redistribution of light. In other words, the light energy striking the screen surface is scattered identically in all directions. Matte white is a reference surface, with a screen gain of 1.0 (also known as unity gain).

Figure 5-16 A classic matte white screen
Ambient light rejection generally increases as the gain of the screen increases. This is because as the screen gain increases, the angle at which light hits the screen becomes more important. Ambient light that is not on-axis with the projector and viewer is reflected away from the viewer. This makes the screen appear darker, increasing the contrast ratio.
Front-Projection Surfaces
A front-projection screen is a passive reflector of light. You can manipulate how it reflects the light to improve brightness. You can also apply the laws of physics by changing the screen’s surface, manipulating its position, and changing its contour.
Front-projection screens can be made of a variety of surfaces and are usually chosen based on application.
Matte white screens provide good color rendition, and they are well suited to data and graphic applications, while matte gray screens reflect less light but can produce images with higher contrast in dark areas of the image.
Angularly reflective screen surfaces reflect light at various angles, rather than a uniform 180-degree reflection. Such surfaces perform similarly to a textured mirror. The light is reflected back at the same angle that it strikes the screen, but on the other side of the screen’s axis. If a projector is mounted at a height equal to the top center of the screen, the viewing cone’s axis would be directed back at the audience in a downward direction. Most screens with a gain greater than five are of this type. This screen type works well for motion video.
Rear-Projection Surfaces
In general, rear-projection technology provides better contrast and color saturation in high ambient light environments. Rear-screen projection is more dependent on screen materials and installation design than front-screen projection. A wide range of screen materials is available for rear-projection configurations, each with different gain and directional properties. Rear-projection screens have either a narrow viewing area with high brightness or a wide viewing area with reduced brightness.
Some rear-projection screen applications use diffusion screen material. The screen substructure may be rigid acrylic, glass, or—for portable applications—a vinyl fabric. This material provides a diffused, coated, or frosted surface on which the image is focused. It provides a wide viewing angle, both horizontally and vertically, but with little or no gain. There may be some hot-spotting due to the transparency of the screen fabric, depending on the vertical placement of the projector with relationship to the audience. The light from the projector is transmitted through the screen with relatively little refraction. The ambient light rejection of this material is moderate and based on the viewer-side material’s reflectivity or sheen.
Projection and the Inverse Square Law
When you increase projection distance in an effort to create a larger image, the larger image is not as bright. The brightness of the image noticeably drops off, even when you move the projector back only short distances. This is a direct result of the inverse square law discussed earlier in this chapter.
As an example of the inverse square law in action in projection, suppose that you set up a front-screen projector for a small group presentation. There’s a lot of ambient light, but the projector’s brightness for the screen surface is acceptable. A larger group than expected joins the meeting, and it becomes necessary to pull the projector back and fit the image onto a bigger screen. But now the image is not as bright, and the overhead lights must be dimmed.
Typically, the brightness levels at the edge of the screen are lower than the brightness levels at the center of the screen. This is a characteristic of the compromises made in the design of projector optical systems, not the inverse square law.
Perceived Quality
How an image looks on a screen is called perceived quality. Image quality can be assessed using criteria such as contrast, luminance, color rendition, resolution, video motion rendition, image uniformity, and even how glossy a screen is. However, contrast remains the fundamental metric to determine image quality. Taking the viewing environment into consideration, the difference between system black and the brightest possible image is the system contrast ratio.
AVIXA developed the ANSI standard ANSI/INFOCOMM 3M-2011, Projected Image System Contrast Ratio, which sets out how to measure contrast ratios and what contrast ratios are suitable for different viewing requirements. As this standard is regularly reviewed and revised, you should confirm that you are using the most recent revision. The complete standard is available from the Standards section of the AVIXA web site at www.avixa.org, but here is a brief summary of the four viewing requirement categories and their required minimum contrast ratios:
• Passive viewing is where the content does not require assimilation and retention of detail, but the general intent is to be understood (e.g., noncritical or informal viewing of video and data). This requires a minimum contrast ratio of 7:1.
• Basic decision-making (BDM) requires that a viewer can make decisions from the displayed image but that comprehending the informational content is not dependent upon being able to resolve every element detail (e.g., information displays, presentations containing detailed images, classrooms, boardrooms multipurpose rooms, product illustrations). This requires a minimum contrast ratio of 15:1.
• Analytical decision-making (ADM) is where the viewer is fully analytically engaged with making decisions based on the details of the content right down to pixel level (e.g., medical imaging, architectural/engineering drawings, fine arts, forensic evidence, photographic image inspection). This requires a minimum contrast ratio of 50:1.
• Full-motion video is where the viewer is able to discern key elements present in the full-motion video, including detail provided by the cinematographer or videographer necessary to support the story line and intent (e.g., home theater, business screening room, broadcast post-production). This requires a minimum contrast ratio of 80:1.
Perceived quality also depends on image uniformity. Human eyes are good at averaging, so viewers can tolerate some variations in image brightness on a screen, but an image must look consistent across the screen. Some of the causes of inconsistent image brightness stem from a projector’s ability to produce an image of equal brightness from center to edge, while others may be screen-related.
Your goal is to provide the largest acceptable viewing area by selecting the best projection method, screen type, and placement for your project.
Viewer Placement
AVIXA has developed the standard AVIXA V202.01, Display Image Size for 2D Content in Audiovisual Systems (DISCAS), which provides a calculation and assessment tool for determining proper display image size and optimal viewing distances, based upon viewer needs. The following are some applications of the DISCAS standard for viewer placement.
Viewing Angles
These are the viewing angles:
• BDM In a basic decision-making situation (as defined earlier in “Perceived Quality”), it is recommended that the top of the image should be no more than 30 degrees above the eye level of the closest viewer, as shown in Figure 5-17. Horizontally, it is recommended that viewers are located within a 60-degree arc of the far edge of the screen being viewed, as shown in Figure 5-18.
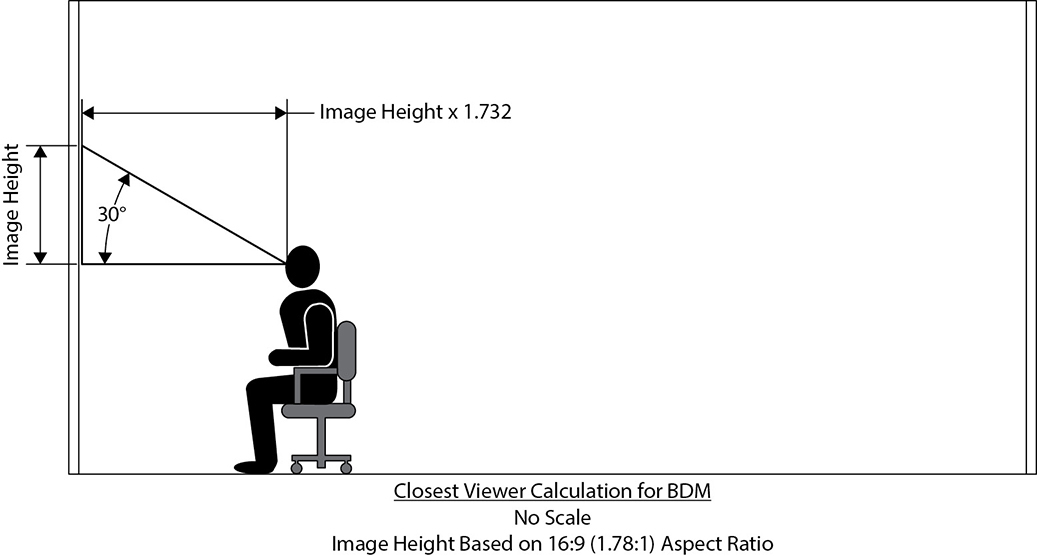
Figure 5-17 Vertical viewing angle for BDM

Figure 5-18 Horizontal viewing parameters for ADM
• ADM In an analytical decision-making situation (as defined earlier in “Perceived Quality”), as a viewer may need to closely approach the image to resolve pixel-level detail, there are no recommend vertical viewing angles for ADM. In the horizontal plane, it is recommended that viewers are located within a 60-degree arc of the far edge of the screen being viewed, as shown in Figure 5-18.
Viewing Distance
The recommended viewing distances calculated using the DISCAS standard are based on the level of detail in the image. Viewing distance calculations are based on element height. An element is a group of pixels conveying an item of information. It is the smallest discrete unit that a viewer must be able to discern and comprehend. The most familiar example of an element is a text character, although it could also be the intersection of lines on a graph, or a symbol on a plan or diagram.
Viewing distances in DISCAS are quoted in terms of the closest and farthest viewers. The closest viewer is a viewing position that defines how close one can comfortably sit in relation to a display and still assimilate content. The farthest viewer is a viewing position that defines how far away one can sit from a display and still discern the requisite level of detail.
• BDM In a basic decision-making situation, viewing distance calculations are based on percent element height (%EH), which is the percentage of the display that an element fills.
%EH = Element height / total image height
If a text character is 38 pixels high on an HD display (1920×1080), it has a %EH of 22. A symbol with a %EH of 5 is 54 pixels high. For any text font, element heights are taken from the lowercase characters, without including descenders. Figure 5-19 shows farthest viewer boundaries for a range of percentage element heights.
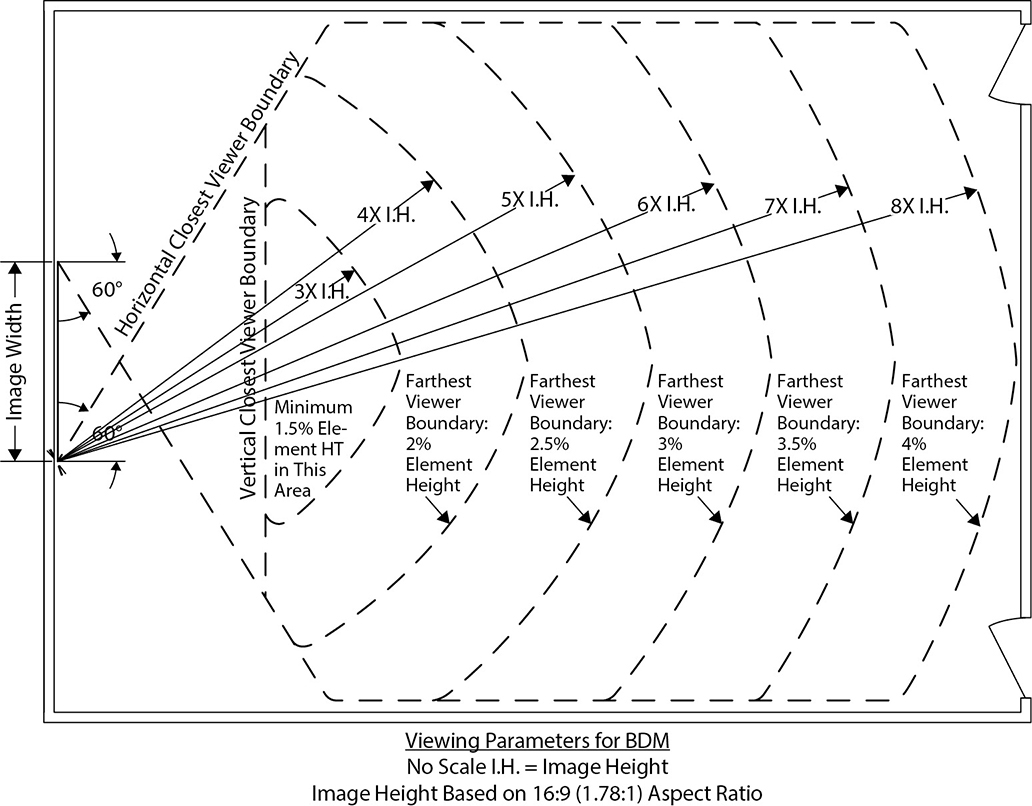
Figure 5-19 Horizontal viewing boundaries for BDM
• ADM In an analytical decision-making situation, viewing distance calculations in DISCAS are based on a single-pixel element height, as the viewer must be able to resolve every pixel in the image.
An online tool is available on the AVIXA web site (www.avixa.org) to perform the calculations contained in the DISCAS standard. (Figure 5-11 showed an example of the BDM calculator screen.)
You will learn more about addressing viewer placement in Chapters 13 and 14, where we’ll discuss how to assess the viewing environment and make suggested changes.
Throw Distance
Throw distance is the distance between the projector and the screen. An incorrect throw distance results in an image that is not the required size.
Most projectors come with a zoom lens that allows you to create the same size image from a range of throw distances. The closest acceptable distance from the projector to the screen is called the minimum projection distance. The farthest the projector can be from the screen and still create the required image size is the maximum projection distance.
You can determine throw distance by referencing a projector’s specifications, where multiple formulas are given.
• A formula for minimum distance to the screen from a specified point on the projector, like the tip of the lens or the front faceplate
• A formula for maximum distance to the screen from a specified point on the projector
• Possibly, a formula for the offset, which is the distance vertically that the projector can be from the bottom of the screen
Each projector formula is different. If the projector has multiple lenses, data will be given for each lens. Some formulas will require the use of the screen width; others may require the diagonal screen measurement.
The following is a sample formula. (The boldface data represents specs from a projector manufacturer.)
Max throw in meters = (5.05 × SW) + 0.2
Min throw in meters = (3.2 × SW) + 0.26
Offset = 0.03 × SW
where SW is screen width.
For a screen 1.83 meters high by 2.44 meters wide, calculate the maximum throw as follows:
(5.05 × 2.44) + 0.2 =
12.32 + 0.2 =
12.52 meters
And calculate the minimum throw like this:
(3.2 × 2.44) + 0.26 =
7.81 + 0.26 =
8.07 meters
Calculate the offset as follows:
0.03 × 2.44 =
0.07 meter
To make things easier, some manufacturers provide apps or web sites that calculate the throw distance for you. Most projector manuals include a simplified chart showing minimum and maximum projection distances for selected screen sizes.
Keystone Error and Correction
To provide an accurate, focused image on a screen, your projector must be set up in the proper location. If the projector is not located correctly, the image on the screen can become misshapen and lose its focus from corner to corner. This is because of the increased distance to a portion of the screen, allowing the projected light to spread out and cover a larger area. For example, this problem would occur if you set up a tripod screen, put the projector on the floor, tilted the projector’s legs up high, and aimed it at the screen. This type of image distortion is called a keystone error.
The following are some adjustments you can make to correct keystone errors:
• Tilt the screen toward the projector.
• Adjust the height of the projector, if the visual environment allows.
• Use electronic keystone adjustment, which reduces the number of activated pixels in an attempt to square the picture.
• Use optical correction by lens shift. Some projectors have motorized lens shift available in both vertical and horizontal directions. Vertical lens-shift keystone correction is the most common. This method of keystone correction is preferable to electronic keystone correction because it does not remove any pixels.
Figure 5-20 illustrates some of these adjustment methods.

Figure 5-20 Different adjustment methods for keystone correction
Digital Display Alignment
A projector lens typically does not have an autofocus feature, so it needs to be manually focused for a sharp image. You adjust the focus on some lenses by twisting the focus ring. Others are motorized and can be adjusted by pressing a button on the remote or the projector, as shown in Figure 5-21. The same is true for adjusting zoom—you may need to move the zoom ring or manipulate a motorized zoom using buttons.
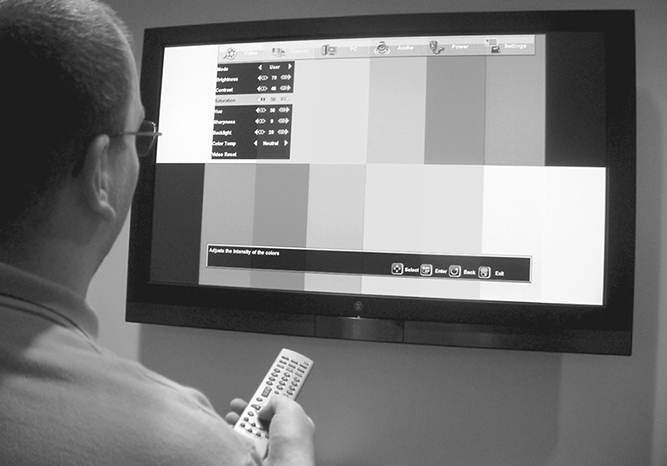
Figure 5-21 Using a remote control to align a display
You may need to make adjustments to the centering, clock, and phase.
Centering
Centering a display does not mean centering a projected image on a screen. It actually refers to centering the signal onto the imaging device—the LCD panel or digital light processing (DLP) chip inside the projector.
You can tell whether an image is centered by looking at the screen. If any image detail seems to fall off the edge of the projected image, it means that a few lines of pixels are actually not lined up correctly on the pixel matrix. In effect, they fell off the matrix. You need to shift the image so that all the pixels align correctly on the matrix. Using the centering function, the image is manipulated left, right, up, or down to shift the image one row or column of pixels at a time.
Professionals use a test pattern with a single-pixel-width outside border. This allows you to easily see the edges of the picture.
Clock Adjustments
A clock inside the projector defines the digital timing. The clock is the master timing for putting a picture on a digital display. The clock’s frequency needs to be synchronized with the incoming signal to display the image properly.
When connecting a source to a digital display, the image may be too large or too small for the device’s fixed matrix. By adjusting the clock, usually using a menu function, you can either stretch or shrink the image to properly fit the device’s matrix of pixels.
Phase Adjustments
After centering the display and adjusting the clock, it is time to fine-tune the image. If less than a pixel of visual information is falling off the edge of the projected image, it can be adjusted with the phase function. The full range of a phase adjustment is generally 1 pixel; larger adjustments are made with the centering function.
An error in an image phase occurs when the image mapping starts at the wrong time, misaligning the pixels. If the image phase is not adjusted correctly, fine detail in the image will be noisy and fuzzy.
NOTE The clock, phase, and centering controls are used together. After adjusting the phase, you may need to readjust the clock or centering.
Automatic Adjustments
Some projectors may include an automatic adjustment button. This will attempt to adjust the clock, phase, and centering for the incoming signal. Some fine-tuning may still be needed.
Projection System Brightness
The brighter a projection system, the better it stands up under ambient light. Display brightness specifications for projection systems are usually stated in lumens. The lumen is the unit of luminous flux—the total amount of light emitted by a light source. Rather than luminous flux, most light meters measure the illuminance of an emitting light source—in lux (lumens/square meter) or the U.S. customary unit foot-candles (lumens/square foot)—at a given point on the display. This is not a measure of a projector’s total output.
The average of full-field brightness is a one way to state a display’s brightness. To determine full-white-field brightness, a full-white field is projected, and the illuminance is measured at the brightest spot and the dimmest spot. The two measurements are averaged and multiplied by the area of the display. This number gives you an approximate, but not particularly accurate, idea of the amount of light actually produced by the display.
Although more accurate and more complex methods for calculating brightness have been developed, the nine-zone average brightness measurement method used in the ANSI lumen standards (ANSI/NAPM IT7.228-1997 and ANSI/PIMA IT7.227-1998) remain the most often quoted measure of display brightness. For this measurement, you project a full-white pattern onto the screen and focus at maximum aperture. For projectors with zoom lenses, set them to their midpoint before measuring. Divide the screen into nine equal areas, as shown in Figure 5-22.
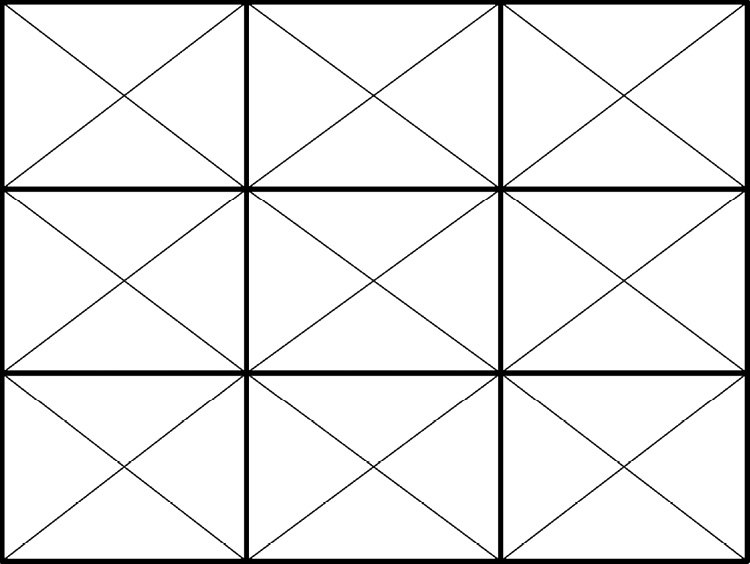
Figure 5-22 ANSI nine-zone grid for measuring brightness
Take an incident light-meter reading in the center of each area and average the nine results. Multiply that average by the area of the screen to convert to lumens.
L = SH × SW × AI

NOTE If incident light measurements are in lux, the screen area must be calculated in square meters (1 lux = 1 lumen/square meter). If incident light measurements are in foot-candles, the screen area must be calculated in square feet (1 foot-candle = 1 lumen/square foot).
Brightness and Contrast Adjustments
Once the monitor or projector image is centered and the viewing environment is set, final adjustments can be made to optimize image brightness and contrast. Setting brightness and contrast properly is important so that all detail in an image is represented accurately.
The brightness control is sometimes called the black-level control because it determines the black level of the image.
• If the brightness level is too high, the intended black areas of the image will appear gray.
• If the brightness level is too low, then areas with subtle differences in levels of black will all be represented as one shade.
The contrast control sets the range of difference between the lightest and darkest areas of the picture.
• If the contrast control is too low, the white details will appear gray.
• If the contrast control is set too high, then areas with subtle differences in levels of white will all be represented as one shade.
Many technicians use test patterns that incorporate a grayscale divided into bars or blocks. A grayscale test pattern permits you to verify that the complete range of intensities will be available on the screen. Each area of the test pattern should be distinguishable from other areas. Grayscale is used because equal amounts of red, green, and blue light form its levels. Adjusting light levels at grayscale ensures that all three colors are represented equally.
A grayscale test pattern displays the broadest range of intensities between black and white on the screen. Figure 5-23 shows an example of a grayscale test chart.
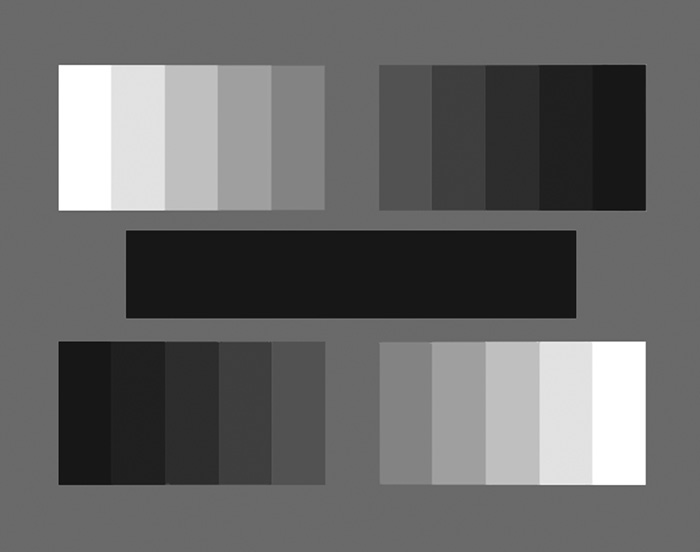
Figure 5-23 A grayscale test chart
Here is one basic method to set brightness and contrast accurately:
1. Start with the projector’s brightness and contrast controls, often called the picture controls, set to the midrange.
2. While looking at the white levels of the image, adjust the contrast control until the light-gray blocks are visible, stopping before areas show detail loss and become all white, indicating the contrast control is set too high.
3. Set the brightness control until the dark gray blocks are distinguishable, stopping before the true black value becomes gray.
Contrast and brightness adjustments typically interact with each other, so you may adjust each more than once. This is not a scientific adjustment, but you want to make sure that black is as truly black as the system will allow and white is truly white.
Chapter Review
Video is a major component of modern AV systems. To incorporate video correctly, it helps to understand the fundamentals, from how people see things to the basics of a video signal. With this foundation, you can learn how best to present video content in an AV system.
Review Questions
The following review questions are not CTS exam questions, nor are they CTS practice exam questions. Material covered in Part II of this book provides foundational knowledge of the technology behind AV systems, but it does not map directly to the domains/tasks covered on the CTS exam. These questions may resemble questions that could appear on the CTS exam but may also cover material the exam does not. They are included here to help reinforce what you’ve learned in this chapter. See Appendix D for more information on how to access the online sample test questions.
1. Electromagnetic radiation is categorized by its _____.
A. Spectrum
B. Visibility
C. Vectors
D. Wavelength
2. Generally, a _____ measurement of incident light is taken at a task area like a video screen.
A. Lumen
B. LED
C. Foot-candle
D. Lux
3. Illumination decreases by _____ when the distance from a light source is doubled.
A. 95 percent
B. 75 percent
C. 50 percent
D. 25 percent
4. The amount of ambient light in a displayed environment _____.
A. Negatively affects the quality of the displayed image
B. Does not affect the quality of the displayed image
C. Improves the quality of the displayed image
D. Complements the quality of the displayed image
5. The native resolution of display device is defined by its_______.
A. Contrast ratio
B. Horizontal rows and vertical columns of pixels
C. Horizontal and vertical sync signals
D. Aspect ratio
6. According to the Projected Image System Contrast Ratio standard, what is the minimum contrast ratio required for viewing full-motion video?
A. 16:9
B. 15:1
C. 2.39:1
D. 80:1
7. Four factors related to primary optics that influence the quality of the projected image are _____.
A. Reflection, curvature, spherical aberration, and dispersion of field
B. Reflection, dispersion, spherical aberration, and curvature of field
C. Refraction, presentation, spherical aberration, and curvature of field
D. Refraction, dispersion, spherical aberration, and curvature of field
8. Three of the major formats of digital signal connections are _____.
A. DVI, HDVI, and DisplayPort
B. DMI, HDVI, and DisplayPort
C. DVI, HDMI, and DisplayPort
D. DMI, HDMI, and DisplayPort
9. To measure the bandwidth of an image, you will need a _____.
A. Spectrum analyzer
B. Frequency analyzer
C. Output monitor
D. Bandwidth monitor
10. Rear-screen display applications are considered _____.
A. Remissive
B. Emissive
C. Transmissive
D. Reflective
11. LCDs first pass light through a ____, which blocks certain light waves.
A. Transistor mask
B. Polarizer
C. Pixel grid
D. Resistor network
12. When selecting a display type, what should be your first step?
A. Decide if you should use an analog or digital display
B. Figure out what type of mount you will need
C. Determine the distance of the farthest viewer
D. Determine what you want to display
13. The _____ the gain number of a projection screen, the _____ the image.
A. Higher; brighter
B. Lower; sharper
C. Higher; softer
D. Lower; brighter
14. What quality would the image have if the phase setting of a display needs adjusting?
A. Blurry only at the image center
B. Oversaturation of red and green
C. Edge of image in sharp focus
D. Fuzzy details
15. The formula for an ANSI lumen rating is _____.
A. L = SH × SW × AI
B. L = SH × SW × AH
C. L = SH × SA × SF
D. L = SH × SW × AS
Answers
1. D. Electromagnetic radiation is categorized by its wavelength.
2. D. Generally, a lux measurement of incident light is taken at a task area like a video screen.
3. B. Illumination decreases by 75 percent when the distance from a light source is doubled.
4. A. The amount of ambient light in a displayed environment negatively affects the quality of the displayed image.
5. B. The native resolution of display device is defined by its horizontal rows and vertical columns of pixels.
6. D. According to the Projected Image System Contrast Ratio standard, the minimum contrast ratio required for viewing full-motion video is 80:1.
7. D. The four factors related to primary optics that influence the quality of the projected image are refraction, dispersion, spherical aberration, and curvature of field.
8. C. Three of the major formats of digital video connections are DVI, HDMI, and DisplayPort.
9. A. To measure the bandwidth of an image, you will need a spectrum analyzer.
10. C. Rear-screen display applications are considered transmissive.
11. B. LCDs first pass light through a polarizer, which blocks certain light waves.
12. D. When selecting a display type, your first step should be to determine what you want to display.
13. A. The higher the gain number of a projection screen, the brighter the image.
14. D. If the phase setting of a display needs adjusting, the details of the image will be fuzzy.
15. A. The formula for an ANSI lumen rating is L = SH × SW × AI.