Chapter 12. Introduction to Business Intelligence
What Is Business Intelligence?
Business intelligence (BI) is the process of deriving meaning from data with the goal of supporting decision making. The term was coined in 1958 by Hans Peter Luhn of IBM as “the ability to apprehend the interrelationships of presented facts in such a way as to guide action towards a desired goal.” Over the years, a number of different marketing terms have been applied to this process, including Decision Support Systems (DSS), Executive Information System (EIS), Online Analytical Processing (OLAP), and business intelligence (BI). Regardless of the words we use, we are talking about the same thing: the process of extracting valuable information from our data to empower action.
In a sense, every computer system we interact with has elements of a transactional system designed to capture a specific event, such as help desk ticket creation and a business intelligence or reporting component designed to extract value from that captured data. Every scenario, be it online sales and marketing or checking into your flight at an airport has requirements around the reporting and analysis of that data.
The traditional definition of business intelligence meant data warehousing, decision support, and analysis. BI has evolved significantly over the past few years and has transformed into a broad and deep space as a key ingredient for aiding and executing business strategies. Understanding of the business is achieved through collation of information about business activities such as sales and services, and analyzing the behavior of customers, staff, and suppliers in order to enable leaders to make effective decisions. BI systems involve collecting data (data warehousing) and organizing it to facilitate analysis, reporting, data mining, and catering to more diverse analysis needs.
In today’s economy, businesses need to react to market changes quickly and optimize operations to drive down costs. Access to the right information at the right time is key and a driver of business intelligence efforts with large and small companies. According to a recent Gartner report, “It’s clear that BI continues to be at the center of information-driven initiatives in organizations.” The BI and analytics market brings in over 10 billion dollars a year.
This chapter will introduce the concepts and tools that have enabled this rapid growth. We will explore the problems that business intelligence can be used to solve and review the landscape of Microsoft tools upon which SQL Server 2012 builds. Within that context, the other chapters in this part of the book will discuss the new Business Intelligence Semantic Model and build a solution around our help desk database.
Applications of Business Intelligence
Business intelligence is used for many purposes, including Measurement and Benchmarking, Analytics, Reporting and Data Visualization, Collaboration and Electronic Data Interchange (EDI), and Knowledge Management. We will briefly explore how business intelligence enables each of these business processes with the goal of being able to discuss where the BI technologies in SQL Server 2012 and SharePoint can be applied.
Measurement and Benchmarking often involves the creation of performance metrics and scorecards to provide insights to the business about progress toward a set of goals. Steps include the identification of a process or requirement to be monitored, development of measures, and creation of targets to score progress. Measurement and benchmarking are key enablers of the Balanced Scorecard, which is the most widely adopted performance management framework as reported by Bain & Company.
Analytics is the application of computer technology and statistics to solve problems and gain insight into data. The analytic process applies statistical models to identify trend information from past data and to predict future data. Data mining and statistical analysis are often used as a part of analytics to understand retail sales, marketing effectiveness, credit risk, or even what books you are likely to enjoy based upon past purchases.
Reporting and Data Visualization is perhaps the easiest for us to understand. Reporting is quite simply the ability to extract huma- readable formatted outputs from our information system. These may be standard columnar or tabular reports, matrices that show trend or time information, or graphs that visually display data. The ideal data structure for reporting tends to be a de-normalized flattened table structure in contrast to the normalized database structure described in Chapter 4. Joining across many tables adds overhead to the database and we have no need to enforce relational integrity when reporting as it is a read-only process. For this reason, we often use an extract, transform, and load (ETL) process to move data from our transactional databases into a database designed for reporting.
Collaboration is an area that you may not have immediately identified as related to business intelligence. In business, collaboration is found both intra-organization and inter-organization. The process of collaboration is a social, communication-based way of working together in order to achieve a common goal. Enterprise collaboration tools such as SharePoint have features focused on employee networking, expert knowledge sharing, skill/expertise location, peer feedback, and the ability to partner with team members via asynchronous communication. EDI is the exchange of information across organizations using standard transmit mechanisms and data formats. An example of EDI would be a business-to-business supply chain ordering system. Business intelligence techniques are used to gather the ordering requirements via an ETL process and EDI enables the sharing of that data with another company’s order management system. While system-to-system EDI is beyond the scope of this book, it’s easy to see how one would use SharePoint to collaborate with others and share insights pulled from data.
Knowledge Management strategies often focus on better leveraging and sharing of information within an enterprise. Here again, we see the interaction between the social and collaboration capabilities in SharePoint and the data management and reporting abilities of SQL Server, enabling teams to create and share insights derived from data.
In order to support scenarios such as these, any BI solution must support the following:
Presentation of relevant and accurate information
Rapid return of query results
Slice-and-dice query creation and modification
An ability for information consumers to pose questions quickly and easily, and achieve rapid results
Now let’s talk about the tools and techniques that enable us to implement a BI solution.
Microsoft’s Tools for Business Intelligence
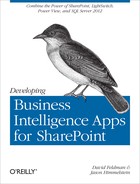
The Microsoft BI server offering is based on SQL Server and its many components, many of which are depicted in Figure 12-1. Over the years, SQL Server has grown from being a reliable database engine to an entire suite of products that can be leveraged in a BI solution. The suite includes Analysis Services, Integration Services, Master Data Services, Data Quality Services, and Reporting Services.
Servers | |
Database Engine | Relational database engine |
Analysis Services / PowerPivot | Multidimensional Online Analytical Processing (MOLAP) |
Integration Services | Extract, transform, and load (ETL) engine |
Master Data Services | Maintains and versions master data |
Data Quality Services | Improves data quality via rich client or ETL process |
Reporting Services | Delivers pixel-perfect reports on demand or on schedule |
Microsoft offers extremely diverse user experience BI solutions, including Reporting Services, Excel, Excel Services, PerformancePoint Services, and Power View. We will talk more about the user interface components and “what to use where” in Part IV, but the following table lists these with short descriptions.
User Interface | |
Reporting Services | Enterprise class reporting from transactional or OLAP data sources |
Excel/Excel Services | Familiar end user tool for advanced data exploration with pivot tables |
PerformancePoint Services | Rich professional BI toolset with scorecards and decomposition tree |
Power View | Fun, interactive graphical data exploration with output to interactive PowerPoint slides |
Finally, from a development perspective the SQL Server Data Tools and SQL Server Management Studio complete the story. SQL Server Data Tools replaces the Business Intelligence Development Studio (BIDS) from SQL Server 2008 R2.
Development and Administrative Tools | |
SQL Server Data Tools | Visual Studio-based development environment |
SQL Server Management Studio | Complete management of SQL Server |
Now, we’ll discuss the process by which these components are typically used to compose a solution.
SQL Server Database Engine
At its core, SQL Server is a relational database engine. SQL Server’s primary job as a database engine is to ensure that data is stored reliably and to ensure this by providing atomic, consistent, isolated, and durable (ACID) transitions.
- Atomic
Each transaction is “all or nothing,” meaning if one part of the transaction fails, the entire transaction is terminated, and the database is left unchanged. Any atomic system must guarantee atomicity in any situation including power failures, errors, and crashes. Think of the example where you attempt to withdraw cash from an automated teller machine, but the machine is out of money or an error occurs before dispatching the money. The entire transaction is cancelled and the funds remain in your account.
- Consistency
Ensures that any transaction will move the database from one valid state to another. Any data written to the database must pass all rules and validations including constraints, cascades, triggers, and any other database logic before being written.
- Isolation
Means that no transaction will be able to interfere with another transaction. This is typically implemented via locking mechanisms to ensure that no transactions that affect the same rows can run concurrently. Over time, many different locking mechanisms have evolved to balance scalability with this property of isolation.
- Durability
Guarantees that once a transaction has been committed, it will stay committed even in the event of power loss, crashes, or other failures. Once a group of SQL statements executes, the results are stored. If the database crashes immediately afterwards, the database will be restored to the state it was in after the last transaction committed.
So how does SQL Server ensure that transactions are managed in a way that preserves these ACID properties, you may wonder. The database engine uses two logical files to manage the storage of each database, the database and the transaction log, or the MDF and the LDF. Each transaction is first recorded to the transaction log (.ldf). Then changes are made to the database file (.MDF). Finally, the transaction log records a Commit statement saying that the transaction was successfully recorded. In the event of a failure, the database is automatically rolled back to the last committed statement.
SQL Server Analysis Services (Prior to 2012)
Analysis Services is Microsoft’s Multidimensional Online Analytics Processing (MOLAP) Server and is at the heart of Microsoft business intelligence solutions. MOLAP enables users to interactively slice and dice, roll up, and drill down through data along multiple dimensions. A MOLAP cube contains measures that are numeric in the nature of data and dimensions along which the measures can be sliced.
MOLAP cubes have gained popularity for answering complex analysis questions in a fraction of the time required by a traditional OLTP relational database. This performance is due to precomputation or processing of information to a cube based on the defined aggregations. When designing a traditional MOLAP cube. a BI developer will develop measures with defined aggregation patterns such as sum, count, min, and max, and dimensions such as product or date by which the measures may be sliced. At cube processing time, aggregations are computed and stored to disk to reduce the amount of work required to achieve an answer at query time.
There are advantages when using MOLAP:
Fast and flexible query performance due to optimized storage, and multidimensional indexing and caching
Smaller on-disk size of data compared to data stored in a relational database due to compression techniques
Automated computation of higher level aggregates of the data
Supports the discovery of trends and statistics not easily discoverable in normal queries
In MOLAP, both granular detail data and aggregated summary data are stored within the Analysis Services instance in a format that is designed for rapid data query and the efficient performance of complex calculations. The MOLAP storage mode is the default in Analysis Services, and offers the best query performance. Query response times are much faster because of the use of aggregations within a MOLAP data store in Analysis Services.
There are also, of course, challenges when using MOLAP:
Increased storage requirements as all detail data is stored in the cube
Longer CPU-intensive processing times when the data is aggregated from the relational source
Changes in the source database are not reflected until the cube is processed again
Complex conceptual model for non-BI professionals to grasp and develop
When using MOLAP, the cube is processed via a scheduled task that is often run during the night. When less data latency is required, techniques such as incremental updates or the use of a separate processing server can allow for more regular updates to a cube.
Development of SQL Server Analysis Services (SSAS) Cubes is traditionally done via the development of a Unified Dimensional Model (UDM) that is designed for rapid ad hoc data retrieval. This model was designed to be the bridge between the data sources and the dimensional model experience by the end user. The UDM that expresses the measures and dimensions can be enriched to encapsulate business rules and calculations as well as advanced BI features including key performance indicators (KPIs), partitions, and actions such as drill-down to custom reports or hyperlinks.
As of SQL Server 2008 R2, Analysis Services represented a mature product offering with Gartner magic quadrant respondents reporting deployment sizes double any other vendor. Microsoft was seen as a leader and a visionary in the professional business intelligence space.
PowerPivot for Excel and SharePoint
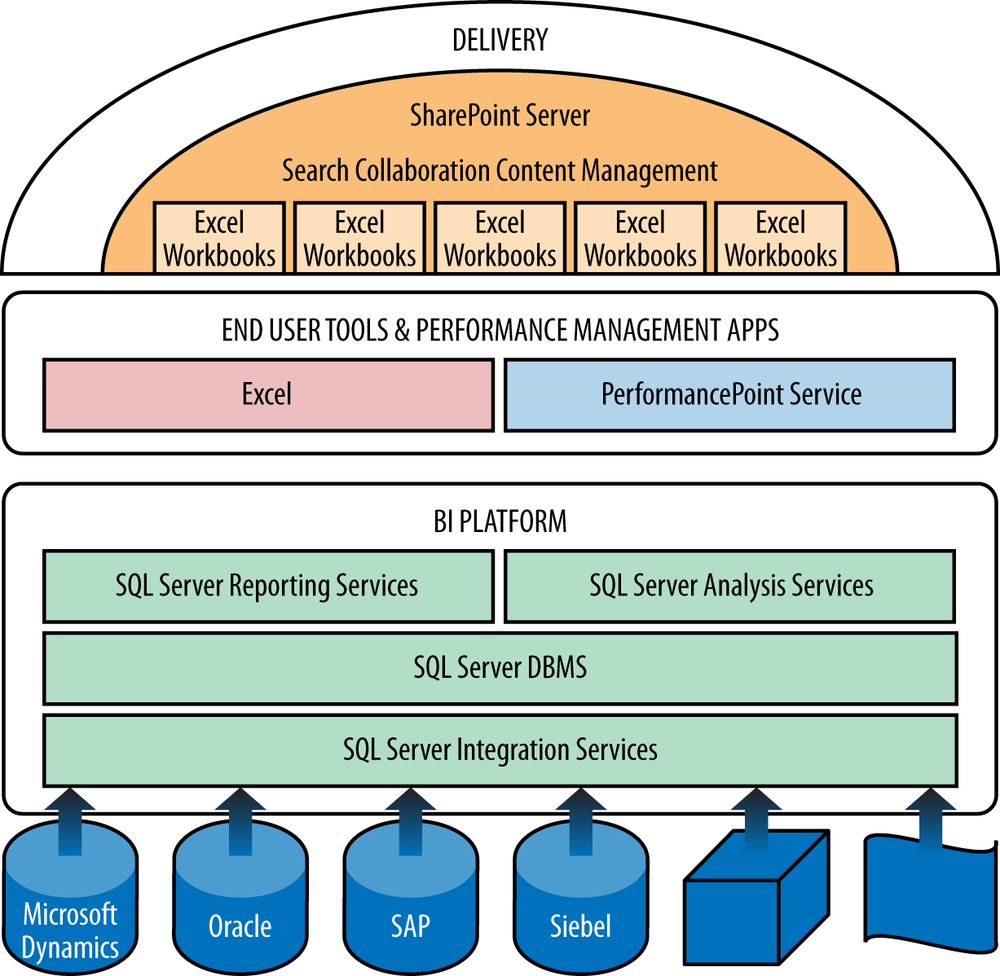
Microsoft PowerPivot enables powerful self-service ad hoc analysis of extremely large datasets all within the familiar Excel 2010 environment. You can perform server-less, in-depth, multidimensional, OLAP-style, and columnar analysis, as well as create your own column and table calculations. PowerPivot version 1 was a component of SQL 2008 R2 and shipped as an add-in for Excel 2010 and a new Service Application for SharePoint 2010. With the release of PowerPivot, Microsoft expanded their product offerings beyond traditional organizational BI, creating offerings for self-service personal and community BI.
PowerPivot is a free add-in for Excel 2010 that allows users to quickly analyze millions of rows of data without the need of a data warehouse, BI professional, or even a server infrastructure. The goal of this product is to enable end users to independently craft solutions over a mix of data from organizational sources such as SQL Server or Analysis Services, but also from sources not stored in IT-governed systems such as Excel or even from tables of data on web pages.
Behind the scenes, PowerPivot really brought an Analysis Services engine to the desktop and SharePoint (Figure 12-3). Unlike the traditional Unified Dimensional Model (UDM), which processes the cube and stores it to disk, PowerPivot leverages a tabular data model stored in memory with the help of columnar compression. Rather than storing data in rows as a traditional database would, PowerPivot compresses the unique values in each column. Microsoft coined the term xVelocity to describe this storage mode for SSAS. As an example, a column that contains US states would only have a potential of 50 unique values. Data within a column compresses so well that PowerPivot is able to keep the model in memory rather than writing it to disk. This makes PowerPivot results blazingly fast and enables users to have millions of rows in Excel or SharePoint.
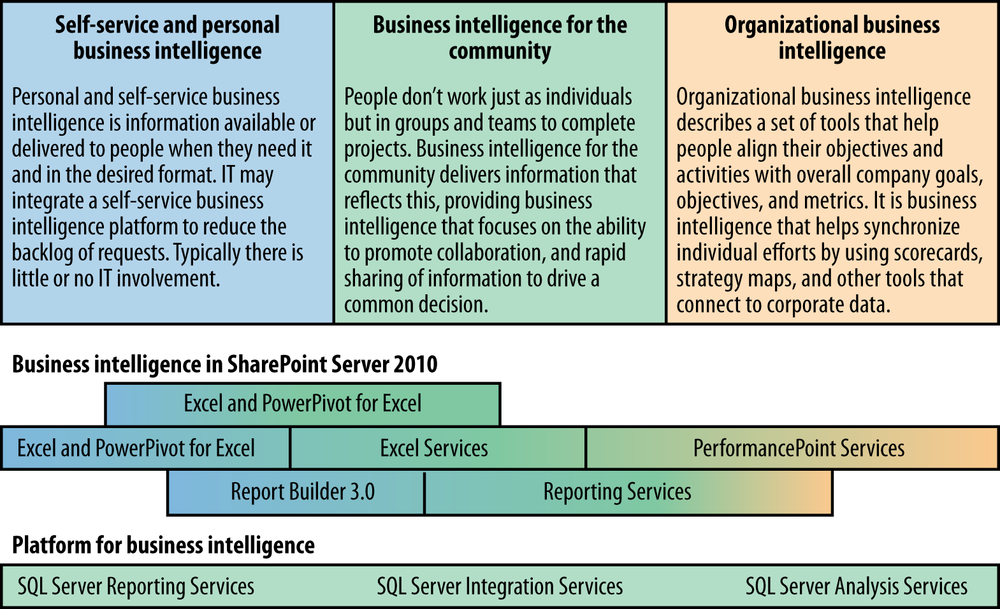
Once users have developed a solution, it can be easily shared with the community via PowerPivot for SharePoint, also released as part of SQL Server 2008 R2. PowerPivot for SharePoint runs a dedicated instance of Analysis Services on a SharePoint application server also leveraging the xVelocity storage mode. PowerPivot for SharePoint also adds new abilities for IT to gain insight into the solutions that are becoming popular in the environment by leveraging a dashboard stored in central admin.
This built-in dashboard visualizes the health of the server over time, the response times that users are experiencing, and the size and popularity of the solutions hosted in PowerPivot for SharePoint. PowerPivot version 1 allows end users to create business intelligence solutions using the familiar Excel environment. Data Analysis Expressions (DAX) enables users to enrich the model with business logic using Excel-like syntax, which should be familiar to end users. Finally, SharePoint provides a deployment scenario where users can share solutions and schedule regular refreshes to their data.
Summary
We started this chapter with a definition of business intelligence and a discussion of its roles and value within a company or organization. Microsoft has grown a complete set of solutions targeted both at organizational business intelligence developers and a distinct offering for end user self-service business intelligence.
In the next chapter, we will introduce the Business Intelligence Semantic Model (BISM), which is new in SQL Server 2012. BISM will build on what we’ve discussed in this chapter by bringing UDM and tabular models together into a single experience.