Chapter 18. SQL Server Analysis Services (SSAS)
One of the best things about the Microsoft business intelligence stack is the ability to scale from solutions designed and run within Excel, to collaborative solutions published to SharePoint Server, to enterprise-scalable solutions running on high-powered Analysis Services. This flexibility of designing in Excel allows you the agility as IT professionals to respond to the needs of the business and deliver real value when your customers need it. If you ever dreamt as a child of being a magician or a superhero, PowerPivot is your chance to do that at work. You will literally hear your customers gasp when you show them what you built in an afternoon. That ability to impress may get you nominated for your next promotion. However, this amazing newfound success brings with it a new set of challenges for us to address: How do we manage and control the solution? What about scalability? What about security?
The power of Analysis Services allows you to deliver scalability and the IT governance required for business-critical applications. When you find that you’ve created something really important in PowerPivot, it may be time to consider scaling up. In this chapter, we’ll hit the highlights around why you would choose to “go SSAS” and how you can do it easily.
Scalability
PowerPivot has a 2 GB limit for the size of the Excel file. If you are running a solution in Excel on your local machine, the resources available may further impact your maximum size. Tabular SSAS models do not have an upper size limit.
Tabular models have partitions, which can be used to manage processing of large data volumes by breaking them into smaller chunks of work. PowerPivot does not have partitions.
Tabular SSAS models support DirectQuery against your data sources. You can consider DirectQuery almost as a scaling feature as it allows you to avoid processing large data volumes altogether. PowerPivot only queries the in-memory xVelocity cache.
Manageability
PowerPivot allows for a daily scheduled data refresh in SharePoint and checks on usage data via central administration. Managing tabular SSAS models is similar to multidimensional models with the full power of SQL Server tooling and APIs.
SQL Server management has all the backup, restore, attach, detach, and delete features that you would expect. It also allows for scripting out from SSMS, browsing your cube, and querying your cube using MDX. These features are identical across multidimensional and tabular models. There are also unique features for tabular models, such as DAX queries and restoring from a PowerPivot workbook.
You can create or modify Analysis Services objects using Analysis
Management Objects (AMO) or XML for Analysis (XMLA) commands containing
Analysis Services Scripting Language (ASSL) elements. These work
consistently across tabular and multidimensional models. The deployment
wizard also works just fine for both tabular and multidimensional models.
PowerShell cmdlets work for both multidimensional and tabular, except
Invoke-ProcessCube is not supported for
tabular models. Integration Services tasks work for tabular models.
Finally, msbuild integration is new for tabular models, allowing you to
automate nightly builds.
Security
PowerPivot is designed to provide a rapid development solution that is contained within an Excel workbook. As such, the security model of PowerPivot is constrained to workbook-level security. Either you have access to the workbook or you do not.
In tabular models, roles define permissions for a model. Each role contains members, by Windows username or by Windows group, and permissions (read, process, administrator). Members of the role can perform actions on the model as defined by the role permission.
Row filters define which rows in a table can be queried by members of that role. Row filters are defined for each table in a model by using DAX formulas. Row filters can be defined only for roles with “Read” and “Read and Process” permissions. If a row filter is not defined, members of a role that have “Read” or “Read and Process” permission can query all rows in the table.
Once a row filter is defined for a particular table, a DAX formula that must evaluate to a TRUE/FALSE value defines the rows that can be queried by members of that particular role. Rows not included in the DAX formula cannot be queried. These filters apply to related rows as well. When a table has multiple relationships, filters apply security based upon the active relationship.
Dynamic security provides a way to define row-level security based
on the username of the user currently logged on or the CustomData property returned from a connection
string. This is simply implemented by filtering your data using the userID
of the logged-in user to filter a given dimension.
To implement dynamic security, you can use the following functions
as part of a DAX formula to return the user name of the user currently
logged on, or the CustomData property
in a connection string. The USERNAME
function returns the Active Directory domainusername of the user
currently logged on. Alternately, you can use the CUSTOMDATA function to return the CustomData property in a connection string. A
best practice is to use the LOOKUPVALUE
function to return values for a column in which the Windows username is
the same as the username returned by the USERNAME function or a string returned by the
CustomData function. Queries can then
be restricted where the values returned by LOOKUPVALUE match values in the same or related
table.
Development Tools
One of my favorite things about PowerPivot is how easy and fast it is to whip something together in Excel and publish it out to SharePoint. There is no server to think about or big heavy development tool suite to load up. I probably had Excel open to look at some data anyway so it’s pretty quick and easy. If I’m building something really important and want to make sure I don’t mess it up, sometimes I’ll back up my Excel workbook before making changes. As developers, we are all used to a more robust integration application life cycle management solution.
Tabular SSAS models live in the Visual Studio and benefit from services such as integrated source control, Team Foundation Server work item and bug tracking, and Team Build integration. The editing environment can be extended using Visual Studio extensions, such as the DAX Editor, which adds language services for DAX into Visual Studio.
The other life cycle benefit is that because tabular models live in Visual Studio, there is a natural separation between development, test, and production deployment. A workspace server is specified for the hosting of the development tabular model and a deployment server is specified for deployment of the finished cube. Visual Studio support also includes the ability to preview the cube you’re developing in Excel. Finally, the deployment wizard can alter connection strings, retain role members, and deploy your changes to a model to production.
Direct Feature Comparison
Feature | PowerPivot for Excel | PowerPivot for SharePoint | Analysis Services Tabular | Analysis Services Multidimensional |
Scalability # of users | One, or Very Small (Personal BI) | Small to Medium (Team BI) | Large (Corporate BI) | Large (Corporate BI) |
Software required | Office 2010 with PowerPivot download | SharePoint 2010 Enterprise & SQL Server 2012 BI or Enterprise Edition & PowerPivot for SharePoint | SQL Server 2012 Enterprise or BI Edition | SQL Server 2012 Enterprise or BI Edition |
Design Environment | Excel 2010 | Excel 2010 | SQL Server Data Tools in Visual Studio | SQL Server Data Tools in Visual Studio |
Query Language | DAX (if MDX is passed it is resolved internally as a DAX query plan) | DAX (if MDX is passed it is resolved internally as a DAX query plan) | DAX (if MDX is passed it is resolved internally as a DAX query plan) | MDX |
Location of Data Model | PowerPivot Add-in to Excel | PowerPivot for SharePoint (a dedicated Analysis Services PowerPivot instance) | Analysis Services Tabular | Analysis Services Multidimensional |
Data Accessibility to Reporting Tools | Excel | Excel Power View PerformancePoint Reporting Services | Excel Power View PerformancePoint Reporting Services | Excel PerformancePoint Reporting Services |
Ability to use Power View | No | Yes (because it uses DAX) | Yes (because it uses DAX) | No |
Type of Database Engine | xVelocity (all data is highly compressed and fits into memory) | xVelocity (all data is highly compressed and fits into memory) | xVelocity (all data is highly compressed) | OLAP |
Size of Dataset | File size: 2GB limit (after compression) Memory limit: 2GB (32-bit) or 4GB (64-bit) | File size: 2GB limit (after compression) (SharePoint size limitation) | Large (Partitions; DirectQuery) | Extremely Large (Partitions; can use MOLAP and ROLAP) |
Usage of Many Disparate Data Sources | Yes (very suitable) | Yes (very suitable) | Yes (very suitable) | Yes (less suitable without underlying DW or ETL processes to integrate) |
Ability to Pass Through Query to Underlying Data Source | No | No | Yes (DirectQuery) | Yes (ROLAP) |
Row Level Security Supported | No | No | Yes (Windows authentication only; row filter security only) | Yes (Cellset or Dimensional; Windows authentication only) |
Ability to Manage Data Refreshes on a Schedule | No | Yes | Yes | Yes |
Development Integrated with Visual Studio | No | No | Yes | Yes |
Support for Source Control | No | No | Yes | Yes |
Support for IT Auditing & Management | No | Yes (PowerPivot Management Dashboard) | Yes | Yes |
Many-to-Many Relationships Supported | Yes (created via DAX, not built into the model directly) | Yes (created via DAX, not built into the model directly) | Yes (created via DAX, not built into the model directly) | Yes (built in the model) |
Ability to Use Actions | Drillthrough (default - not customizable) | Drillthrough (default - not customizable) | Drillthrough (default is not customizable; can use Tabular Actions Editor in BIDS Helper to customize columns or to create Report, Rowset, and URL Actions) | Drillthrough Reporting Standard |
Upgrading a PowerPivot Workbook to a Tabular Model
As stated at the beginning of this chapter, the power of Analysis Services allows you to deliver scalability and the IT governance required for business-critical applications. The method for scaling up is to upgrade from a regular PowerPivot workbook to a full tabular cube.
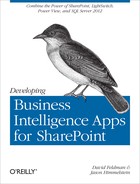
Open SQL Server Data Tools.
Create a New Project and select Business Intelligence → Analysis Services → Import from PowerPivot as shown in Figure 18-1.
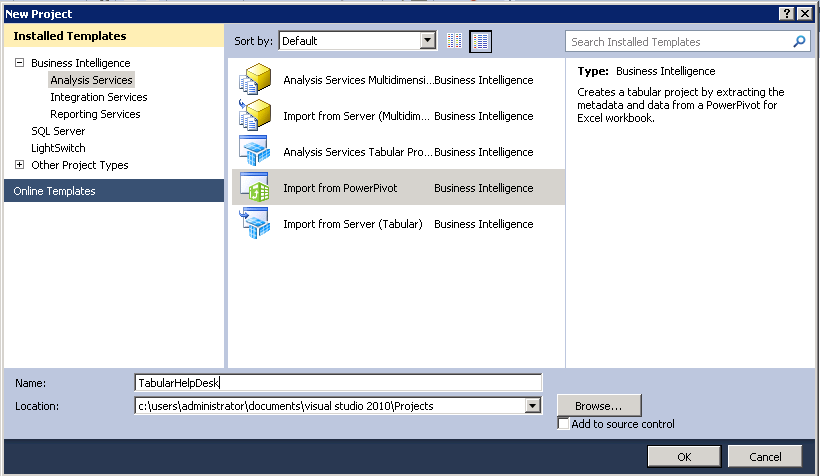
The wizard to import a PowerPivot workbook is not very complicated, but let’s walk through it. First, you are prompted for a default Analysis Services server that is running in tabular mode. Remember that an Analysis Services server is configured to support either tabular mode or multidimensional (OLAP) mode. If you have both types of cubes, then you need two instances of Analysis Services running.
Simply provide the name of your SSAS tabular mode server, as shown in Figure 18-2.
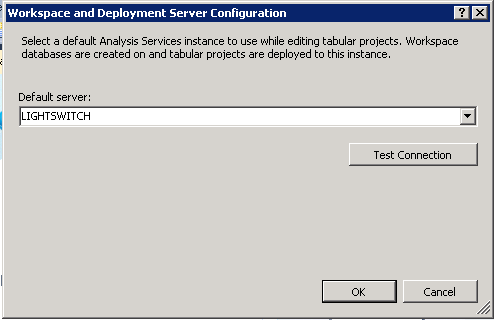
Next you’ll browse for the PowerPivot workbook you’d like to import. This workbook can either be on your local file system or you can paste the URL of your SharePoint site into the browse path to import your model from SharePoint. Both techniques work equally well (see Figure 18-3).
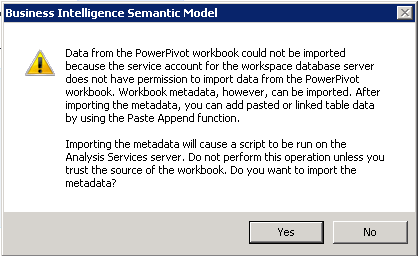
You may get the message shown in Figure 18-4 informing you that the data will not be imported due to permissions between the workspace server and your local PowerPivot model. Don’t worry about it. The metadata that defines the cube is really all you want to import. You will process the partitions in Visual Studio and at deployment time, load in the data from your data sources. So go ahead and click Yes.
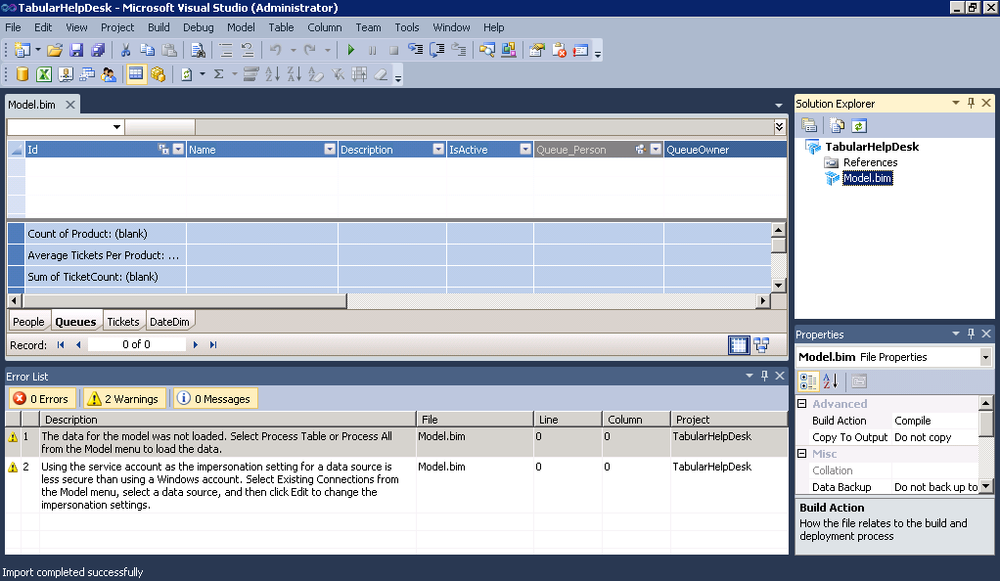
When the import completes, you’ll see your model reflected in Visual Studio, as shown in Figure 18-5. Note that your tables are each reflected as tabs. The main window has a split layout with the columns of the table on top and the imported measures shown below.
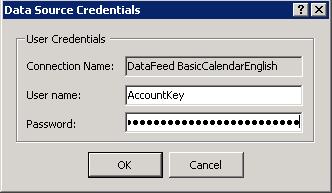
When you process your cube from the model drop-down menu, you will be prompted for credentials for each of your data sources. If you are using Windows authentication, this may just be a pass through, but for accounts where a username and password are required, you’ll need to specify them as shown in Figure 18-6.
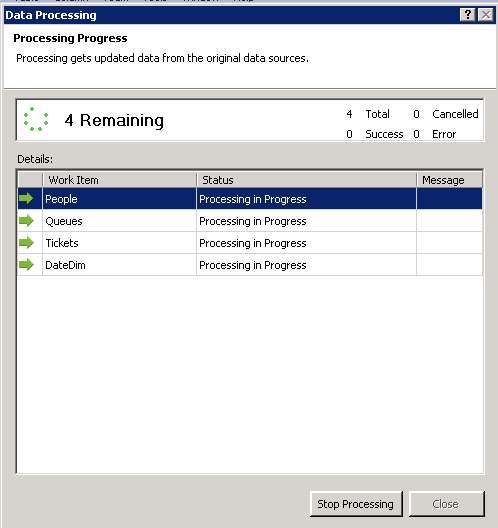
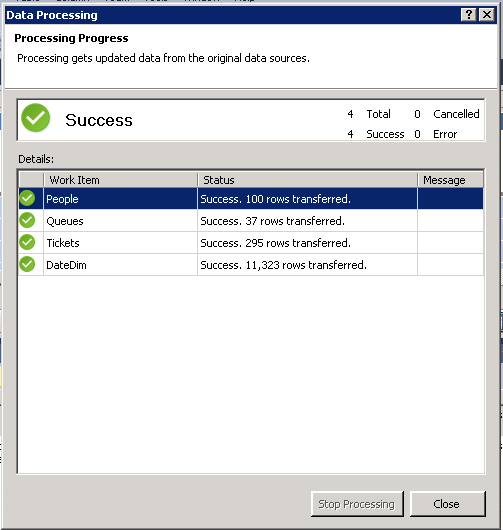
It’s really that easy to upgrade your solution from PowerPivot to a SSAS tabular model. The cube will process as shown in Figure 18-7 and will then show you the confirmation of success as shown in Figure 18-8.
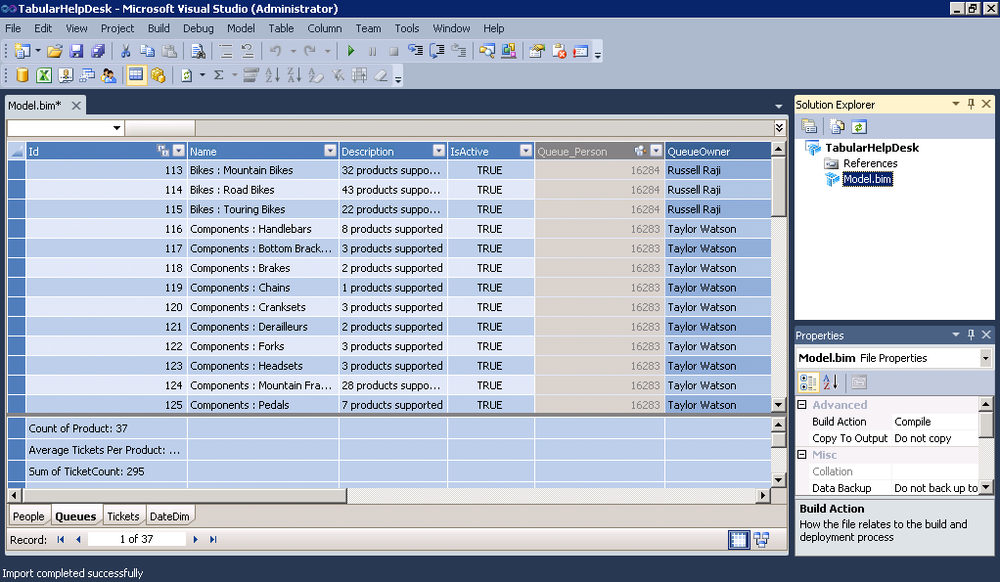
At this point, you’ll see all your data loaded in the Visual Studio–based designers, as shown in Figure 18-9. You can further refine your model as needed using the same techniques you learned in the previous chapter.
To get this project deployed to our production server, we’ll need to configure a deployment server. Open the property pages for the project by right-clicking on the project name in Solution Explorer and clicking Properties.
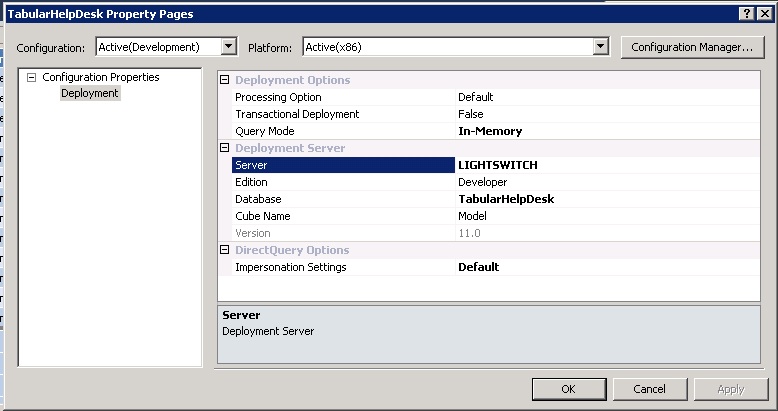
Figure 18-10 shows the Property Pages dialog where we can configure the name of the server to which we will deploy, the edition of SQL Server we are running, and the name of the database and cube we want our users to connect to. Set up your preferred options here and click OK.
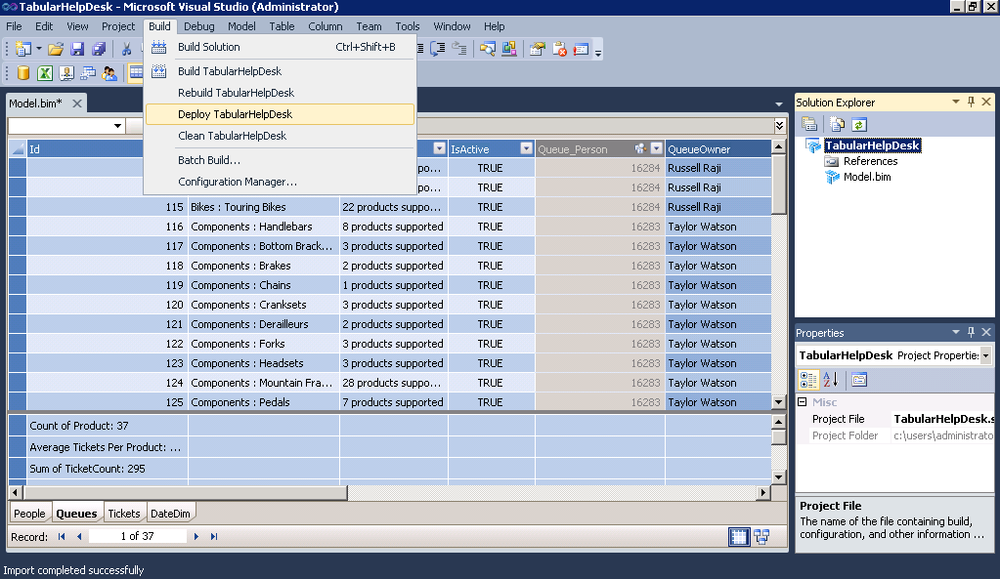
The Build drop-down menu gives us the ability to deploy our new tabular model out to production, as shown in Figure 18-11. Of course, this does assume that you have rights to your production server.
Validating the Deployment
After that process completes, we will validate by connecting to and browsing the model.
Open SQL Server Management Studio.
Connect to Analysis Services.
Specify your server name and click OK.
You will see your new database shown in Object Explorer on the left.
Right-click on your database.
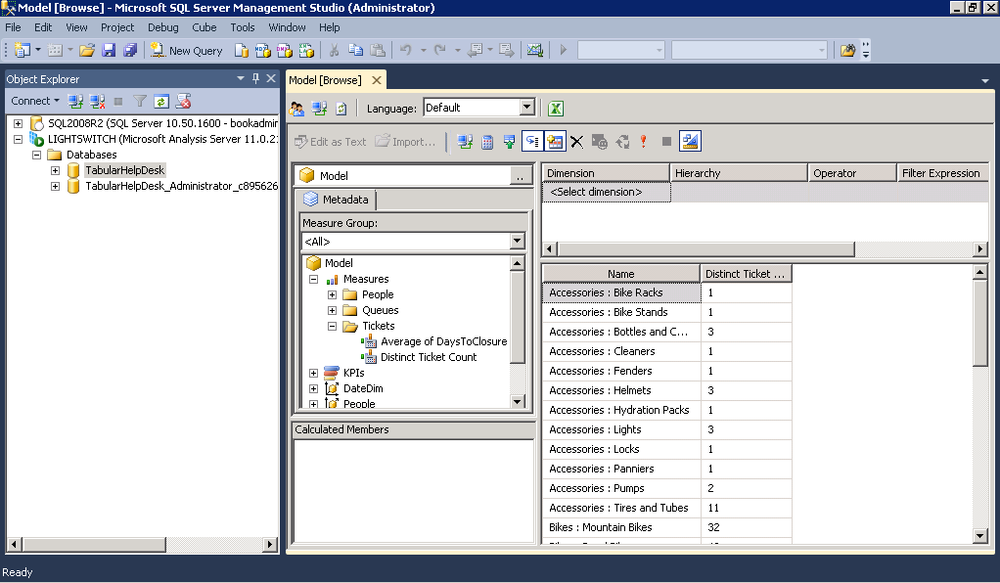
Choose Browse to launch the Cube Browser shown in Figure 18-12.
You are now connected to your cube running on your production server and you can browse it simply by dragging measures and dimensions onto the query design surface. Remember that you will need both measures and dimensions on the surface before starting to see data.
Automating Processing Your Cube
The tabular model is an in-memory cache of your data. This makes querying very fast, but it also means that as your source data changes, you will be looking at stale data. One approach we’ve seen people take is making the junior person on the team log in at 6 a.m. and manually refresh the data. We don’t recommend that approach, as they won’t stick around very long.
Every SQL Server database administrator and even most developers will be familiar with using SQL Server Agent to schedule tasks that you would like to run automatically. It’s reliable, quick, and easy to configure and can even send you an email if something goes awry—seems like a better solution then the junior guy already!
Setting this up isn’t too hard either. Management Studio has the ability to generate scripts after walking through a wizard and we’ll use that to help us automate this. Let’s get started.
Open up SQL Server Management Studio.
Connect to your Analysis Server.
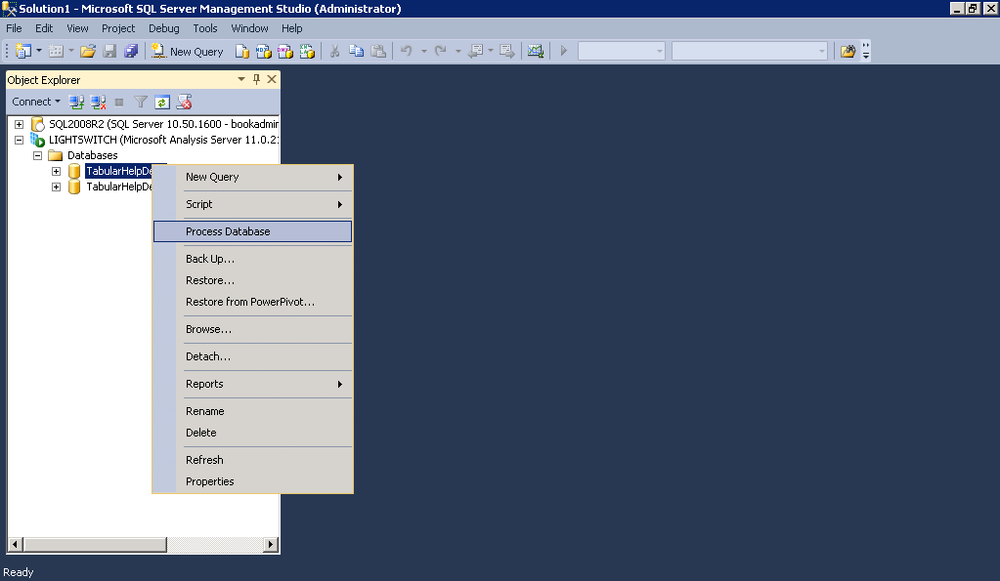
Right-click on the name of your database.
Select Process Database (see Figure 18-13).
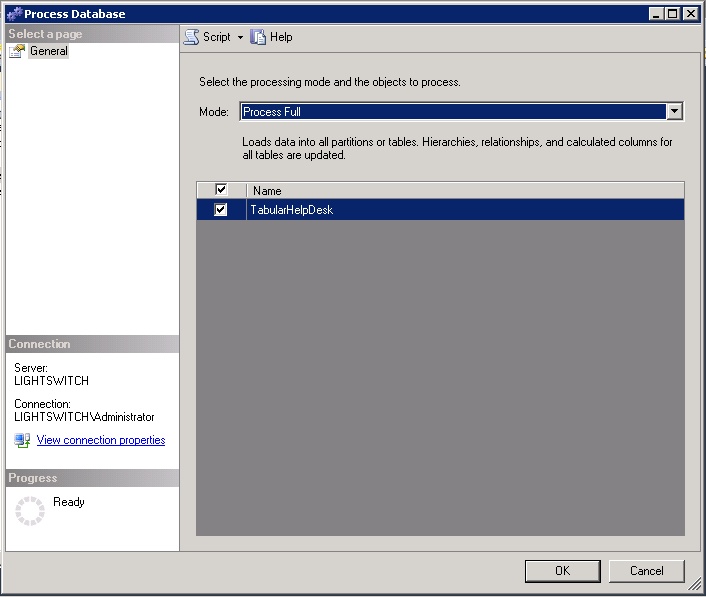
This launches the Process Database wizard. Only a few options present themselves here, but we’ll walk through them. The mode you choose determines what steps Analysis Services goes through when processing your cube. If you want to reach out to your data sources and pull in new data, you’ll want to do a full process as seen in Figure 18-14. If we had a solution with multiple partitions, they would each be displayed at the bottom. Furthermore, you can uncheck partitions that you don’t want to update. This is great if you have some large reference data that doesn’t change with the same frequency as your transactional data.
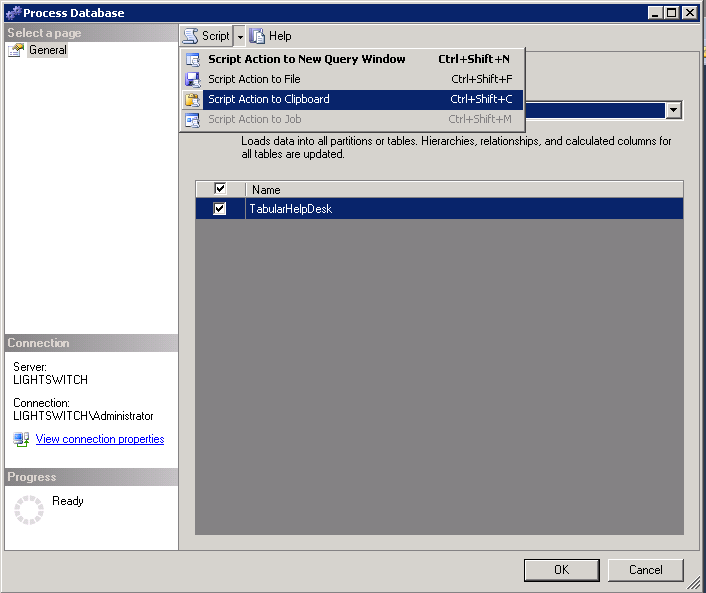
If you don’t know it’s there, then you probably didn’t notice that in the top of our Process Database wizard, there was a drop-down menu labeled Script. They say that knowing is half the battle but in this case it’s more like 90%. After you’ve set your options just select Script Action to Clipboard as shown in Figure 18-15.
What’s produced by this is really not all that complicated. In fact, before realizing that you could script the output of the wizard, most Analysis Services developers used to write this XML by hand. Check out the XML produced by the Process Database wizard.
<Process xmlns="http://schemas.microsoft.com/analysisservices/2003/engine">
  <Type>ProcessFull</Type>
  <Object>
    <DatabaseID>TabularHelpDesk</DatabaseID>
  </Object>
</Process>
Finally, all we need to do is get this scheduled by setting up a job in SQL Server Agent. SQL Server Agent is managed via the database engine, so we’ll need to connect to our database engine with SQL Management Studio to set this up.
Connect to the database engine via SSMS.
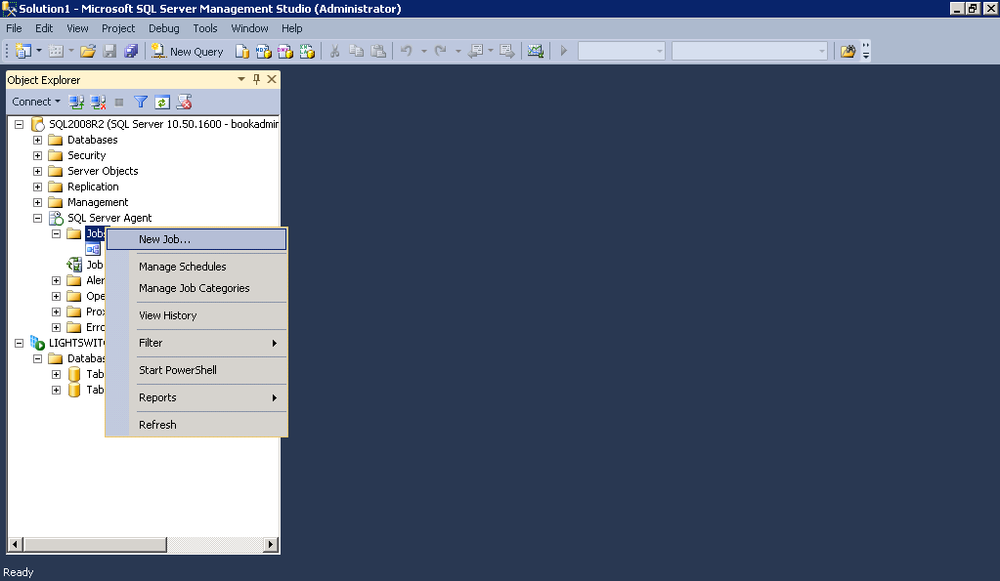
Expand the SQL Server Agent node in Object Explorer on the left.
Right-click on Jobs and select New Job, as shown in Figure 18-16.
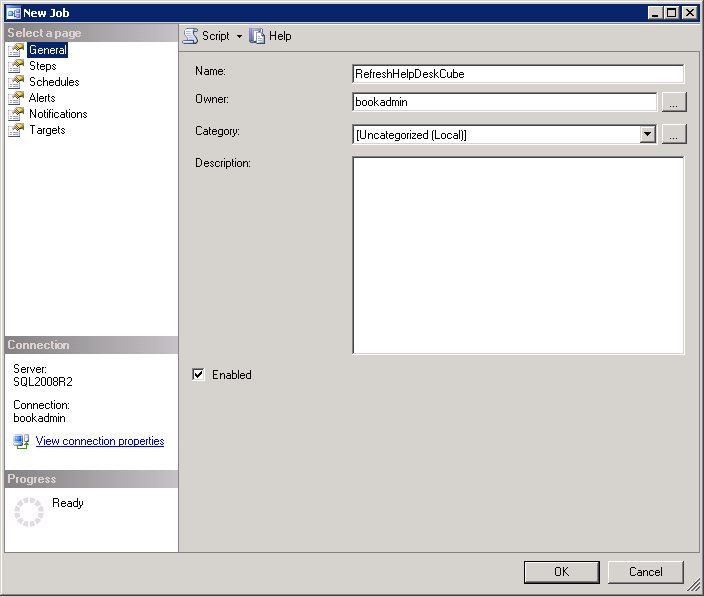
Once again, we get a wizard to walk us through this configuration process. On the General tab, simply provide a name for the new job and add any description information to identify it to your administrators (see Figure 18-17).
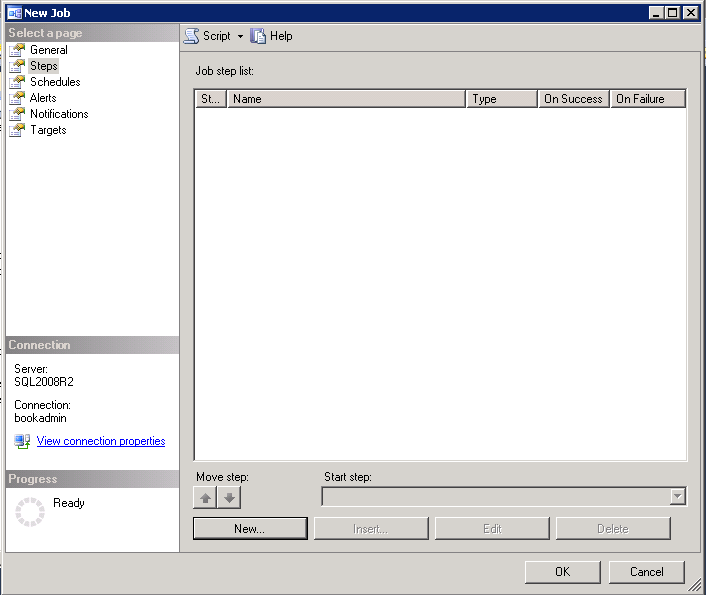
SQL Server Agent jobs are composed of a series of steps that are executed in order. Select the Steps table and click the New button to add a step, as shown in Figure 18-18.
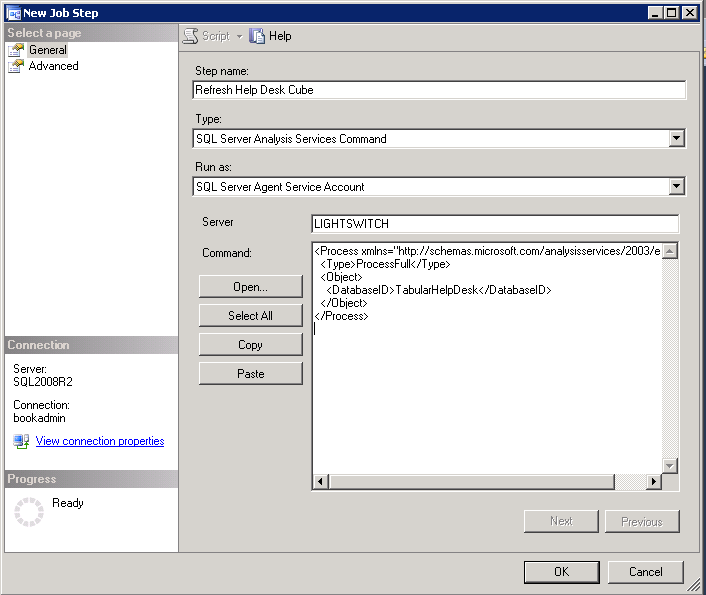
Provide a name for the Step and choose SQL Server Analysis Service Command as the Type.
Choose the account to Run this step as. This account must have rights to process your database.
Specify the server name and paste the SSAS Command into the window, as shown in Figure 18-19.
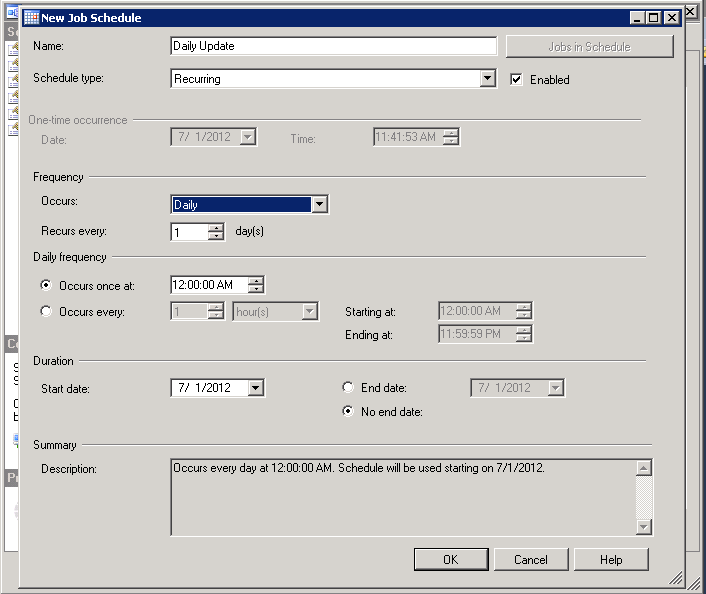
You will see that the step was added successfully and now, can move to the Schedule tab to set up the times you’d like the job to run. The dialog shown in Figure 18-20 is self-explanatory. We can run hourly, daily, weekly, or whatever schedule you need. Remember that processing your cube does take server resources on both the database servers that hold your source data and on your Analysis Services server where the cube will be processed. For large cubes, it’s a best practice to update outside of business hours in order to not impact performance if that schedule is compatible with your requirements.
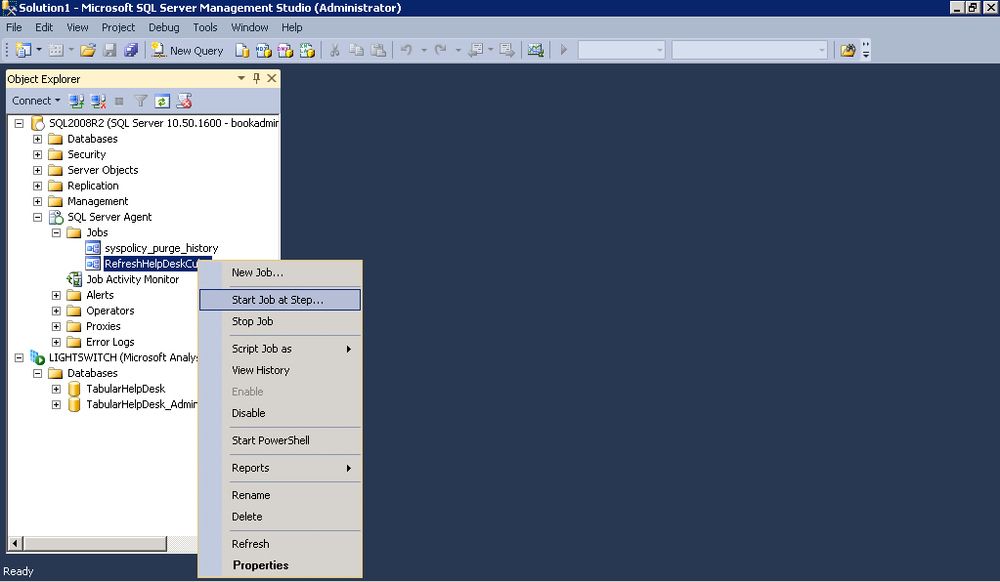
Once you’ve completed configuration of your new job, it’s a really good idea to give it a run. This helps you validate that the account you are running as has the appropriate rights on your server and that everything goes as planned. Just right-click on the job in Object Explorer and select Start Job at Step... (see Figure 18-21).
Summary
In this chapter, we took a PowerPivot model from either Excel or SharePoint and upgraded it to a full-featured SSAS tabular model. By developing in Visual Studio, you get the full professional developer solution with integration into TFS and development, test, and production release cycles.
This completes the development of your BI Semantic Model. In the next part, we will explore the various clients that you can use to explore and visualize your data including Excel, Power View, and Reporting Services and how they link into SharePoint.