
Chapter 17. Deploying to SharePoint
Sharing with Your Team
If a tree falls in the forest and no one is around to hear it, does it make a sound? Philosophers have debated this question since early in the 1700s. The key to this highly philosophical question is whether an object only exists if it perceived.
At this point, you have created a strong and streamlined business intelligence solution that allows you to gather insight from your data, but it exists only on your local PC. To increase the impact of this solution, you’ll need to share it with your team or larger enterprise.
With the SQL Server 2008 R2 release, Microsoft introduced PowerPivot, and the term Business Intelligence Continuum was coined to describe the range of solutions starting with personal BI, progressing to team BI, and then to organizational BI. Figure 17-1 shows the range of these solutions and their division across PowerPivot and SQL Server Analysis Services. In the SQL Server 2012 release, the addition of tabular cubes to the story makes it even better.
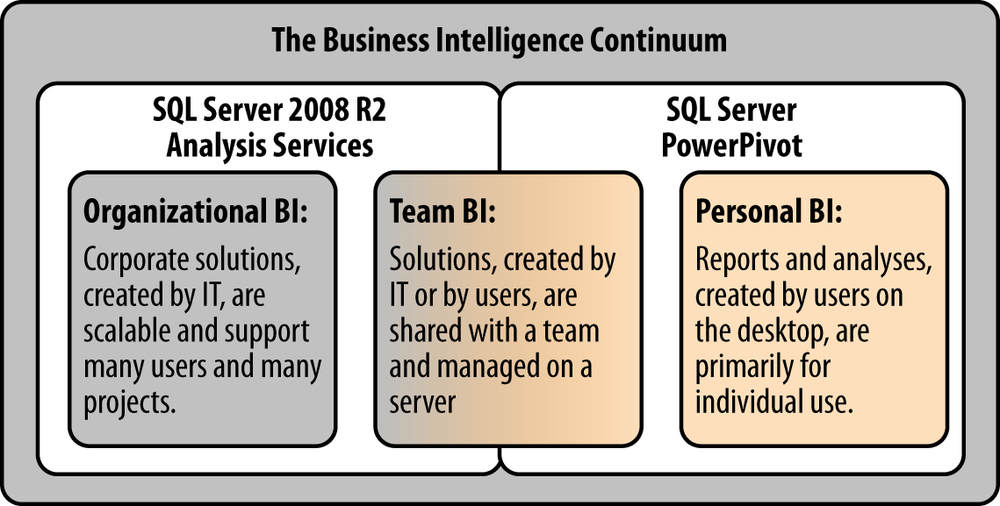
In this chapter, we walk through the deployment story from PowerPivot for Excel to PowerPivot for SharePoint. This allows us to take a personal BI solution that was created and managed in Microsoft Excel and promote it to a team BI solution hosted in Microsoft SharePoint. In Chapter 18, we will continue the journey and promote from PowerPivot for SharePoint to SQL Analysis Services 2012 Tabular, moving from team BI to organizational BI, completing the continuum.
To get started, we return to our SharePoint site. To complete this portion of the example, you will need to have a SharePoint 2010 server with PowerPivot installed from the SQL Server 2012 release. More information on performing this configuration is available in Part V of this book.
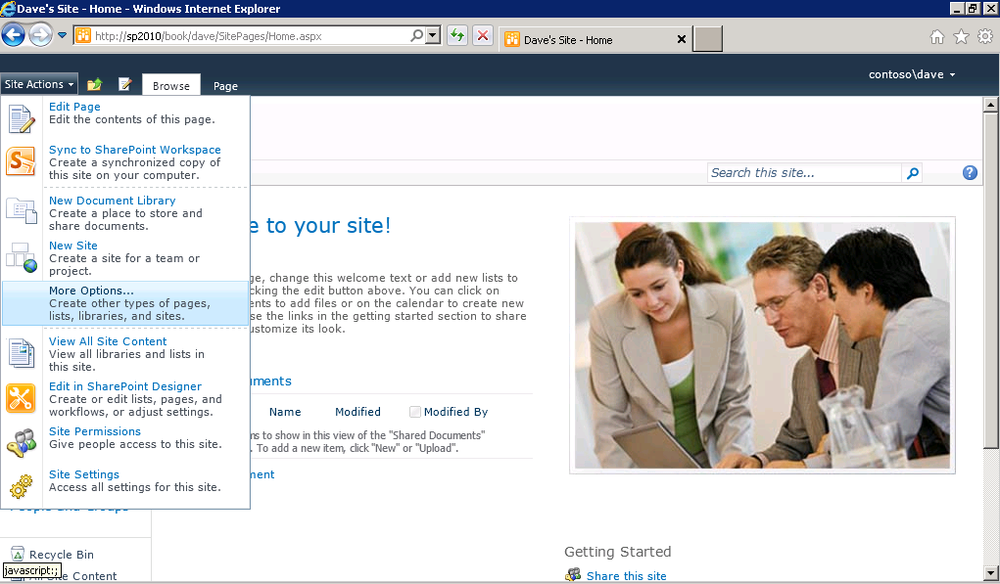
Let’s begin by creating a new PowerPivot Gallery. From the Site Actions menu, select More Options (see Figure 17-2) to launch the Create dialog shown in Figure 17-3 to create a new PowerPivot Gallery. The PowerPivot Gallery is a feature installed from SQL Server 2012. You need to have owner rights on your SharePoint site to perform this task.
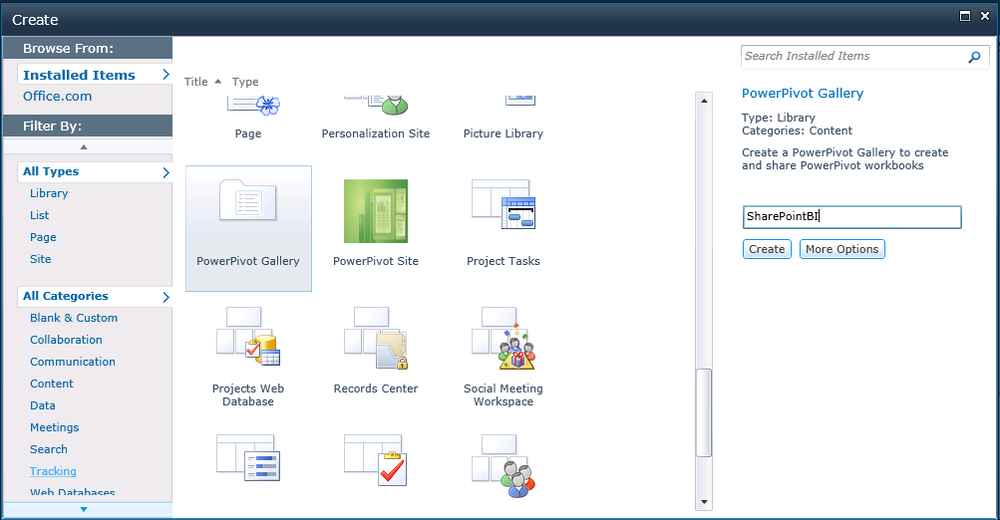
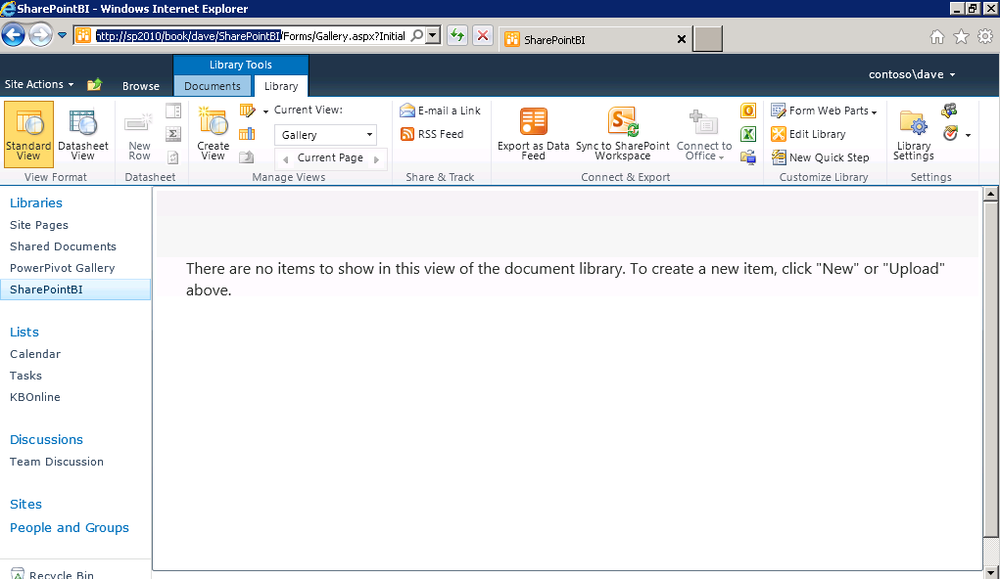
The PowerPivot Gallery is a special document library with a Silverlight viewer providing previews and rich interaction with your BI assets. Simply enter a name for your new library and click Create. You’ve just created a new library that should look like Figure 17-4. As you can see, it’s still empty and suggests uploading assets from the Documents tab of the ribbon. You may notice that we have part of the URL highlighted, in fact just the path to the new Gallery. We don’t want the portion of the URL with the /Forms/Gallery.aspx... so just highlight through the path of our PowerPivot Gallery and copy that using Ctrl-C.
We’re going to publish our PowerPivot directly from Excel so let’s return to Excel with our PowerPivot solution open. When you click the File menu in any of the Office 2012 applications, a new feature known as the Backstage is displayed, giving robust options for printing or saving files.
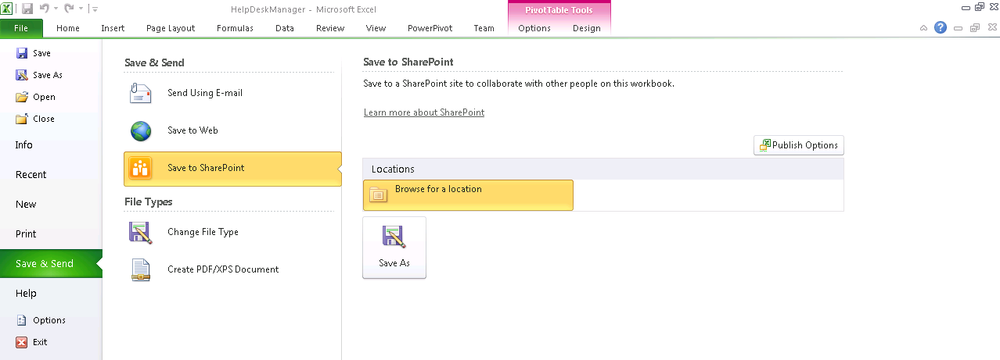
From the Backstage, as shown in Figure 17-5:
Select Save & Send.
Select Save to SharePoint.
Select Browse for a location.
Note
Any locations to which you have recently saved files in Excel are also displayed in the Locations section of the screen. This will make the process even easier when you wish to save your next solution to the same Gallery.
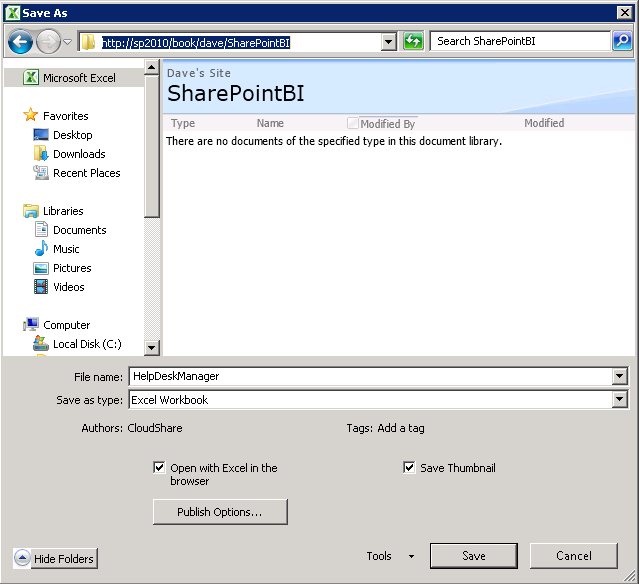
The normal Save As dialog box is displayed when you select Browse for a location. You may not have noticed in the past that you can replace the location in the URL bar. In our case, highlight the path that was displayed and hit Ctrl-V to paste the path of your PowerPivot library. You’ll notice that the dialogs correctly render to SharePoint-based paths, and any existing files in our PowerPivot Gallery will be displayed. Simply enter the filename as shown in Figure 17-6 and click the Save button.
Excel will proceed to upload your PowerPivot to the server. This may take a minute so be patient because amazing things are happening during this process! Unlike a normal Excel file that is saved to SharePoint, the server detects that this file contains a PowerPivot model so a new cube is created on the PowerPivot instance of Analysis Services running on the application server that is based on your model.
When the process is complete, Excel Services displays a web-based rendering of your Excel sheet as shown in Figure 17-7. While this may seem simple, try selecting a new item on the slicer and you’ll find that the web-based spreadsheet is interactive and calls back to the server to refresh the data on each click.
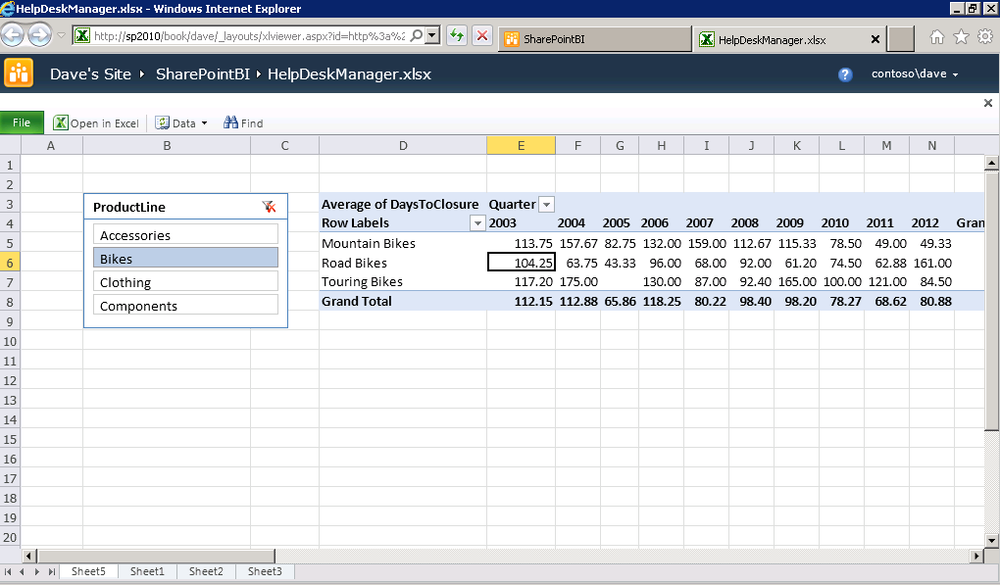
If you were to take the full URL of this Excel sheet that is stored in SharePoint, you could actually use it in place of a server name for any Analysis Services client. We will talk more about this in Part IV of this book when we look at clients.
Summary
We have now taken a solution that we created in Excel and used SharePoint and PowerPivot to create a web-based solution that can be shared by our team. Instead of requiring each individual to have a copy of Excel and PowerPivot installed on their local computer, we are using SharePoint to share a single copy of our data.
In the next chapter, we will discuss moving from team BI to organizational BI with Analysis Services.