Chapter 5. Basics of Using Reporting Selection Screens
In this chapter
The Reporting Selection Screens 56
Maximizing the Use of Selection Screens in SAP Query 61
Understanding Output Options on the Selection Screen 63
Now that you have created several test reports and learned about the fundamentals of reporting with the SAP Query tool, it important to leverage your knowledge of how to correctly use reporting selection screens. This chapter covers everything you need to know to maximize the reporting potential in SAP via the use of reporting selection screens.
The Reporting Selection Screens
When you execute virtually any report in the SAP R/3 environment—whether it is a system-delivered canned report, a query, or a custom-coded ABAP report—you are likely to see a selection screen that gives you the opportunity to specify exactly what you want.
Selection screens in SAP contain data relevant to the report being executed. For example, if you were running a report based on a SAP test flight scheduling system (as used in earlier chapters), your selection screen would automatically contain values relevant to that application (see Figure 5.1).
Figure 5.1. The standard selection screen used with all reports created using the flight scheduling system application is based on the F1S logical database.
Recall from Chapter 2, “One-Time Configuration for Query Tool Use,” that logical databases were used to build the InfoSets that you use for SAP query reporting. Remember that an InfoSet is the data source that houses the data you use in reports. If you look back to Figure 1.2 in Chapter 1, “Getting Started with the SAP R/3 Query Reporting Tools,” you’ll see that the logical databases are part of the InfoSet. A logical database is a prearranged grouping of data where fields from a similar application or module area are grouped hierarchically to allow for reporting.
How the Selection Screens Work
I love Italian food, and my husband and I often eat at a local Italian place, Mama Tricarico’s, whose menus come with crayons. Instead of just selecting a dish from the menu, I can create a dish exactly the way I want it by writing on the menu and selecting the items I want. The menu lists each of the different types of pastas, sauces, and add-ins, from which I simply select what I want (see Figure 5.2).
Figure 5.2. The menu from my favorite Italian restaurant, which gives diners the option to choose precisely what they want.
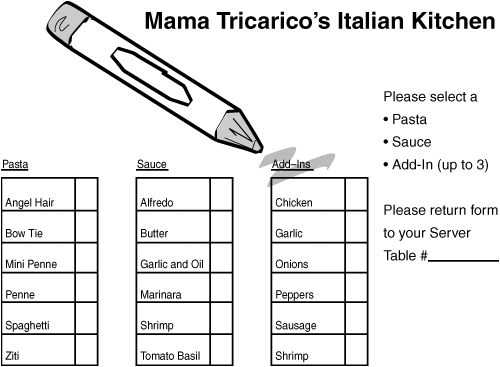
The reason I like the restaurant so much, besides the food, is that it allows for flexibility for every individual diner. If you are at all like me, you are hungry by now, but we’re really here to talk about reporting selection screens. As you learned in Chapter 3, “Creating Basic Reports with the SAP Query Tool,” reporting selection screens allow you to specify what you want in your report—similar to the way Mama Tricarico’s lets you specify what you want in your meal. Table 5.1 shows an example of a basic SAP query report. By using a selection screen, you can simply pick and choose the data you want to include in your finished report output. For example, in Chapter 4, “The Fundamentals of Reporting with the SAP Query Tool,” if I wanted to run a report of flights from the SAP test flight scheduling system where the flight date was June 1995, I could do so just by indicating June 1995 on the report’s selection screen prior to executing the final report output.
Table 5.1. All Associates of Mama Tricarico’s in the SAP HCM Module in a Basic Report List
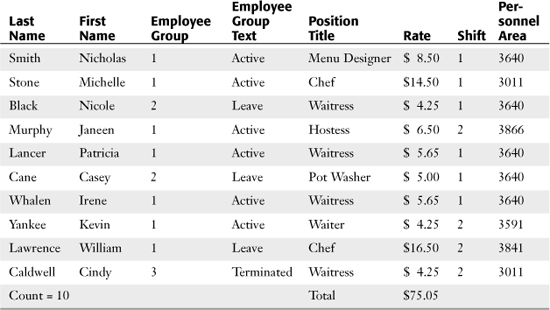
Creating a basic SAP query report to display the Table 5.1 data from SAP is easy, using the basic instructions outlined in Chapter 3. (Note that it is not required for you to have the HCM module installed in order to proceed with this chapter, because you will not be creating any actual reports.) The fictional Table 5.1 is helpful in providing an overview of all the associates in the organization. However, as mentioned before, virtually any time a report is run in SAP, a selection screen is shown, giving you an opportunity to further specify your selections. The selection screen often comes from the logical database used in the data source (that is, the InfoSet). In this particular example, the SAP logical database PnP is used. PnP is one of the SAP standard logical databases used in the Human Capital Management (HCM) module. (You will learn more about human resources reporting in Chapter 15, “HR and Payroll Reporting Options in the HCM Module.”) The standard PnP selection screen is shown in Figure 5.3.
Figure 5.3. The fields included in the Period and Selection sections are specific to the Personnel Administration section of the HCM module.
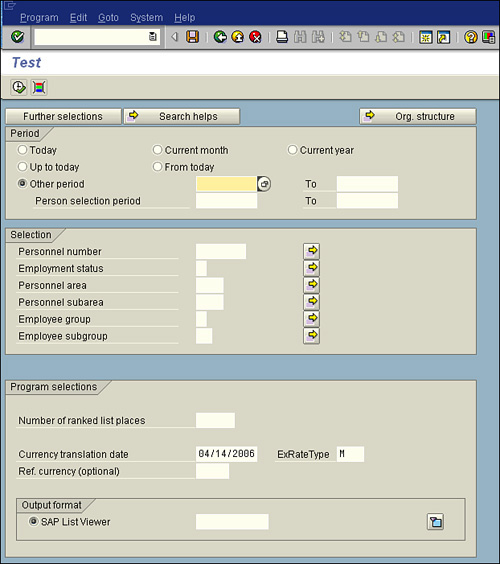
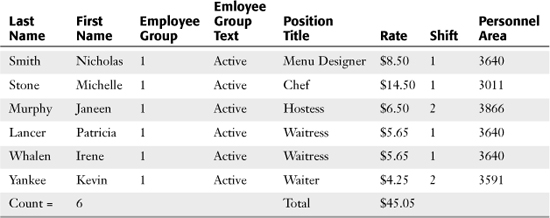
The specifics of the Period section of the selection screen are covered in Chapter 15. For now, let’s look at the Selection section, which contains fields specific to reporting in the HCM module. You may recognize two of the fields as ones that are included in the HCM sample report output displayed in Table 5.1 (Employee Group and Personnel Area). Having those fields allows you to use the selection screen to modify your criteria. For example, if you were to run the report shown in Table 5.1 and input NOTHING on the selection screen, that is what you would get. However, if you wanted to create a list of all “active” associates, you could easily do so by placing the appropriate value that designates an associate as active in the appropriate Employee Group field, as shown in Figure 5.4. The resulting report is shown in Table 5.2.
Figure 5.4. The selection screen from a basic SAP Query HCM report, showing the value options for the Employee Group field with the value selected.
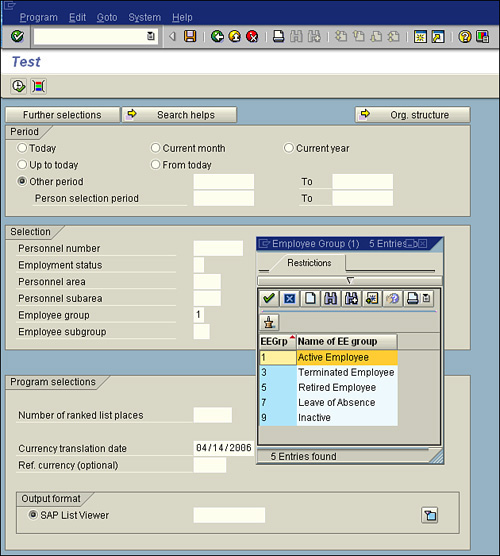
Table 5.2. All Active Associates of Mama Tricarico’s in the SAP HR Module in the Basic Report List
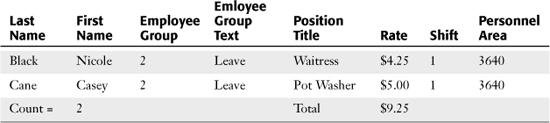
By making one simple change to the report’s selection screen, you can change the report. Let’s view another example. This time on the selection screen, I specified that I wanted to include all associates who are on leave in Personnel Area 3640, as shown in Figure 5.5. The resulting report is shown in Table 5.3.
Figure 5.5. The selection screen from a basic SAP Query HCM report showing specifications in two fields.
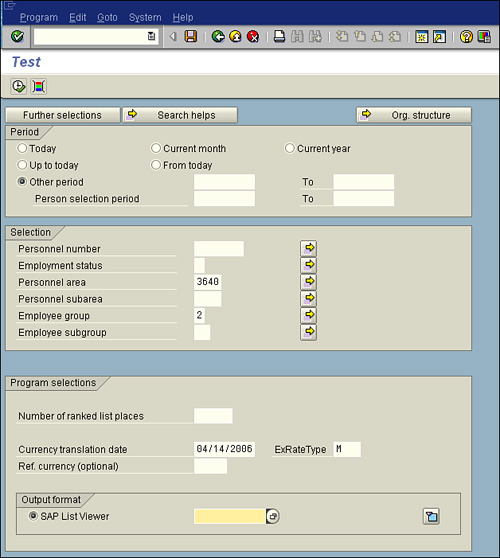
Table 5.3. All Associates of Mama Tricarico’s Who Are in Personnel Area 3640 and Who Are Classified as on Leave in the SAP HR Module in the Basic Report List
As with the Mama Tricarico’s menu, you can simply select what you want from a SAP report’s selection screen.
Maximizing the Use of Selection Screens in SAP Query
As mentioned in Chapter 4 and shown in the examples in the preceding section, a user can create a single report and use it for multiple purposes. It is important to note that the use of selection screens is not a concept that is unique to query reporting. Selection screens appear for almost any type of report executed in SAP. With the SAP Query tool, customizing selection screens is easy. Recall from Chapter 3 that the SAP Query tool has five basic screens:
• Title, Format
• Select Field Group
• Select Field
• Selections
• Basic List Line Structure
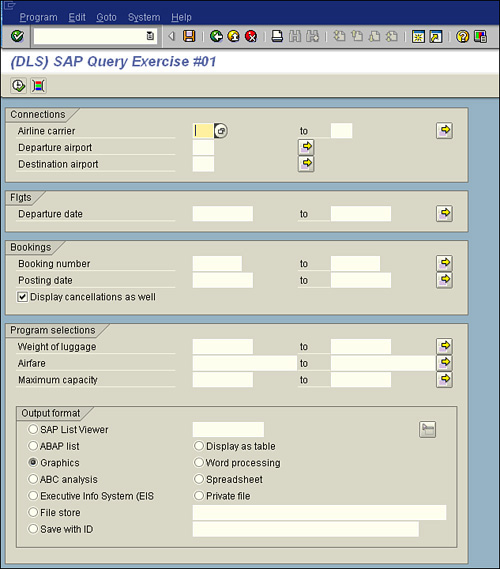
Of these five screens, the Selections screen, shown in Figure 3.5 in Chapter 3, is the one that provides the most leverage for maximizing the use of selection screens. This is where things get confusing. The Selections screen in the SAP Query tool is where you add additional fields to appear on your report’s selection screen that you will see when your report is executed. To make this confusing concept a little less so, let’s take a look. The Selections screen is shown in Figure 5.6, and the corresponding selection screen for that report is shown in Figure 5.7.
Figure 5.6. Any field indicated on the Selections screen of the SAP Query tool shows up on the report’s selection screen when the report is executed.
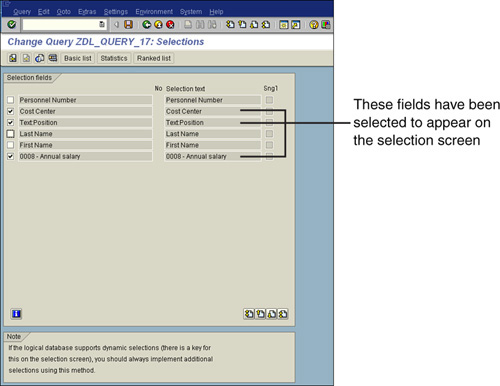
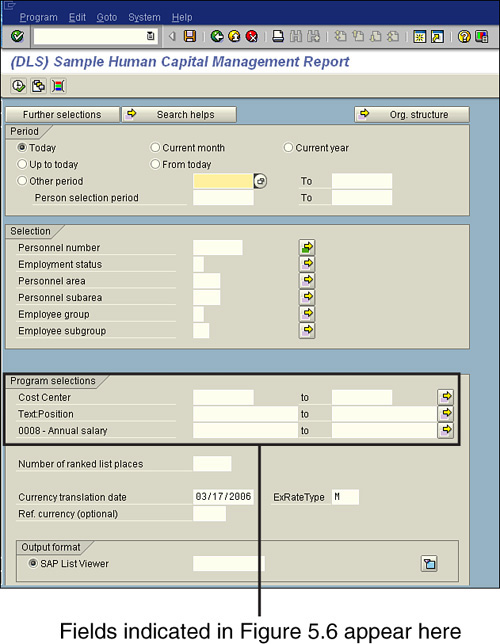
Figure 5.7. Fields listed under the Program Selections heading on the report’s selection screen were designated on the Selections screen of the SAP Query tool.
The Selections screen of the SAP Query tool gives you the opportunity to add to your report’s selection screen any field that you selected on the Select Field screen of the SAP Query tool. You can therefore add any relevant field to appear on the selection screen so that you can further specify your output, whether or not you wish to actually output data from that field in your report.
Understanding Output Options on the Selection Screen
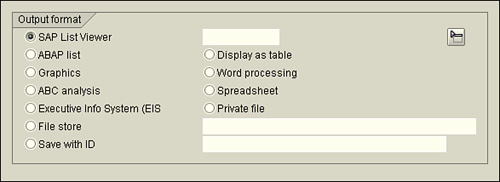
As mentioned earlier in this chapter, the values on your selection screen vary, based on the logical database selected in your report’s InfoSet. However, one item is standard on all selection screens: the Output Format section (see Figure 5.8).
Figure 5.8. The Output Format section of the screen is where you identify the desired format you prefer for the specified report.
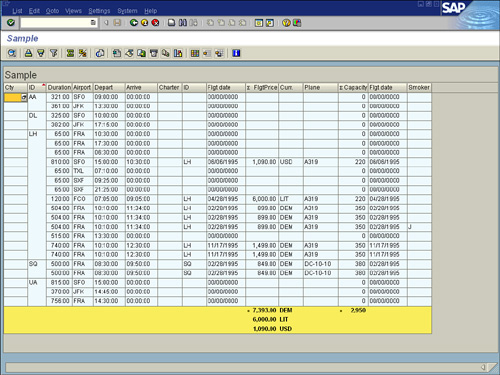
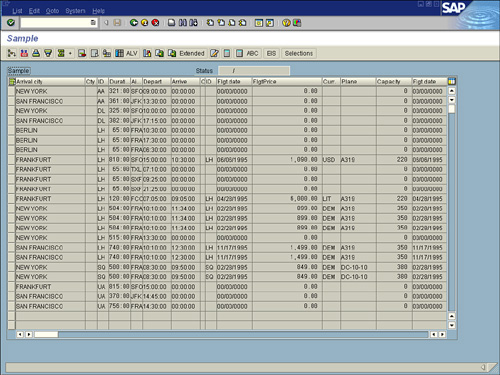
By default, in version 4.6C of SAP and higher, SAP List Viewer is the selected option for almost all reports. The SAP List Viewer was introduced in version SAP GUI 4.6C as an easier way to review and work with reports in a table view (similar to Microsoft Excel). In releases prior to 4.6C, the SAP List Viewer was called the ABAP List Viewer (ALV). Figure 5.9 shows an example of an SAP test flight scheduling system report displayed in the SAP List Viewer.
Figure 5.9. In versions of SAP earlier than 4.5, the standard display was in an ABAP list, without the table view.
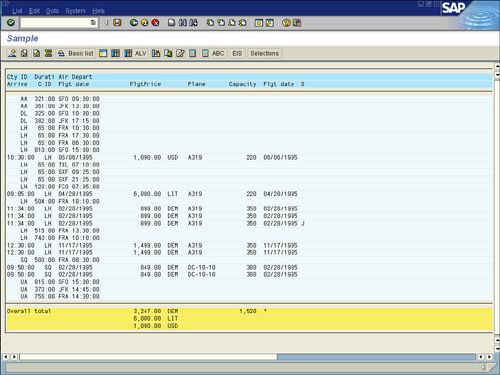
In versions of SAP earlier than version 4.5, the second option in the Output Format list, ABAP List, was the default view. Figure 5.10 shows an example of the same SAP test flight scheduling system report shown in Figure 5.9, but this time displayed in ABAP list view.
Figure 5.10. Without previously indicating any special formatting, the report text is likely to wrap to the next line at 80 characters.
Chapter 6, “Using Reporting Selection Screens: Advanced Skills,” discusses advanced query-based reporting options, including how to vary the output of your data when it is displayed in a basic list.
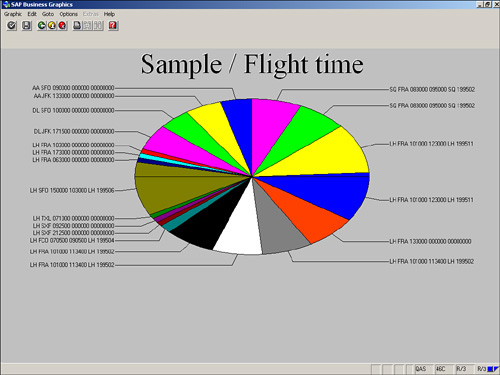
The third option in the Output Format section, Graphics, is tied to the Business Graphics application in SAP, which is designed to allow you to create reports in a variety of different graphical formats. Simply selecting the Graphics option launches Business Graphics. When you select the Graphics option, SAP graphs the first numeric listing. Figure 5.11 shows an example of the same SAP HCM report from the preceding figures, this time displayed in graphical format.
Figure 5.11. There are multiple options for graphical reporting, including pie charts and polar diagrams.
The fourth available option in the Output Format section is ABC Analysis. When you select this option, a dialog box labeled ABC Analysis: Strategy appears (see Figure 5.12).
Figure 5.12. ABC Analysis can also be performed on SAP data in Microsoft Excel.
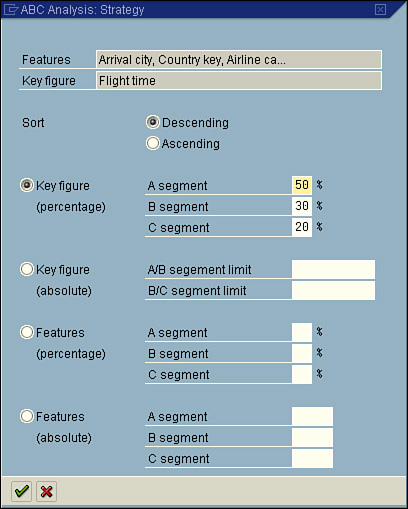
You can use the ABC Analysis: Strategy dialog box to stipulate how many data records a group (A, B, or C segment) is to contain. An ABC analysis divides the records of a dataset into three distinct segments (A, B, and C). These records must each contain a key figure (a numeric field) and any number of attributes (nonnumeric fields). The dataset is first sorted in descending or ascending order, using the key figure. This function can be used for any single-line basic lists, statistical lists, and any ranked lists that contain at least one numeric field. ABC analysis is most popular in financial-type analysis.
With the key figure strategy of ABC analysis, the percentage proportion of the key figure total must correspond to the overall total in this specification.
With the attribute strategy, the percentage proportion of the number of data records must correspond to the total number of data records in this specification. For example, if the specifications are A = 50%, B = 30%, and C = 20%, the transition from the A segment to the B segment applies when the percentage proportion exceeds 50. The transition from the B segment to the C segment applies when the percentage proportion exceeds 80 (50+30).
The next available output option is Executive Info System (EIS). This option is not utilized very often because it requires that an interface and separate database structure be in place. Indicating this output format in your SAP query provides a link to the EIS and, via an interface, transfers the report data to the EIS database for further analysis. Upon activation, a dialog box offers additional selections for formatting, sending, and storing the data.
The next option in the Output Format section is Display as Table. This option displays your report output in an SAP table control. It does not have the advanced functionality that the SAP List Viewer has, but it presents the data in a table format, which makes it easy to read. Figure 5.13 shows the same SAP HCM report shown earlier, this time displayed after the Display as Table option is selected.
Figure 5.13. The application toolbar contains various options but not as many as with the SAP List Viewer option.
You use the next available option in the Output Format section, Word Processing, to create a Microsoft Word form letter with the data from your SAP query. Creating form letters using your SAP data and Microsoft Word is discussed at length in Chapter 22, “SAP Query Reporting with Microsoft Word and Outlook.” Chapter 21, “SAP Reporting with Microsoft Excel,” provides an overview of using SAP with Microsoft Excel.
When you select the Spreadsheet option in the Output Format section, a dialog box appears, asking which of the following formats you want to use for the spreadsheet:
• Store as PC File—This option allows you to save the report in a spreadsheet format in a designated location.
• Excel SAP Macros—This option launches the Microsoft Excel <> SAP Communication window, which displays the report output in SAP Excel List Viewer format, with active macros in place.
• Table > Excel—This option launches a dialog box that lists a single option, Microsoft Excel. When you select this option, Microsoft Excel opens and displays your report data in a Microsoft Excel window in a basic datasheet view.
• Pivot Table—This option launches a dialog box that lists a single option, Microsoft Excel. When you select this option, Microsoft Excel opens and displays your report data in a Microsoft Excel window in a formatted PivotTable view.
Helpful Hint
If you ever experience a problem getting your SAP and Microsoft Excel applications to work in harmony, be sure to confirm that your Excel security is set to Medium. To do so in Microsoft Excel 2003, follow these steps:
1. Open the Excel document.
2. Select Tools, Macro, Security.
3. Set the Security to Medium.
4. Select the Trusted Sources tab.
5. Check the Trust All Installed Add-ins and Templates and Trust Access to Visual Basic Project check boxes.
6. Click OK.
7. Close Excel.
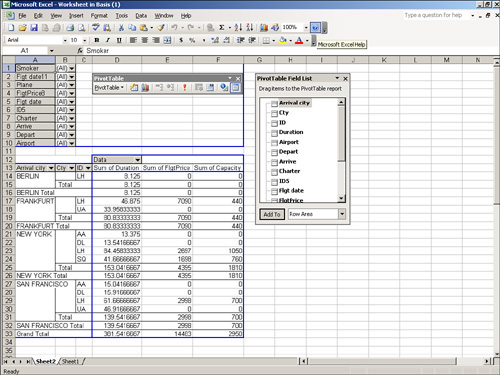
Figure 5.14 shows an example of the same SAP test flight scheduling system report as before, this time displayed in spreadsheet (PivotTable) format.
Figure 5.14. PivotTables in Microsoft Excel allow for instant analysis of the report data, and the raw, unformatted data can be found on a separate sheet in the existing workbook.
The Private File option in the Output Format section passes the report directly to a function module upon report execution instead of displaying it onscreen. This SAP enhancement is virtually obsolete. SAP continues to support this option for compatibility, but SAP recommends that you not use it and that you redefine any private files currently in use to other formats. (Please see the SAP Help if you require more information.)
The File Store option in the Output Format section allows you to select a destination and filename for your report output to be sent to. This option is popular for scheduled reports that are run in the background. To use this function, you simply type a destination address (for example, c:filename.asc) in the blank input field next to File Store. Files can be stored in the following formats:
• .asc (ASCII)
• .bin (binary)
• .dat (ACSII data table with column tab)
• .dbf (DBASE)
• .ibm (ASCII with IBM code page conversion)
• .wk1 (Lotus spreadsheet format)
The last available option in the Output Format section is Save with ID. To use this option, you type a user ID in the blank field next to File Store, and the list is then saved under that designated ID.
In the Output Format section, often by default all the options with the exception of the default are hidden. To see the full list, select the expand arrow to the far right of the SAP List Viewer radio button.
Why Do the Output Format Options Look Familiar?
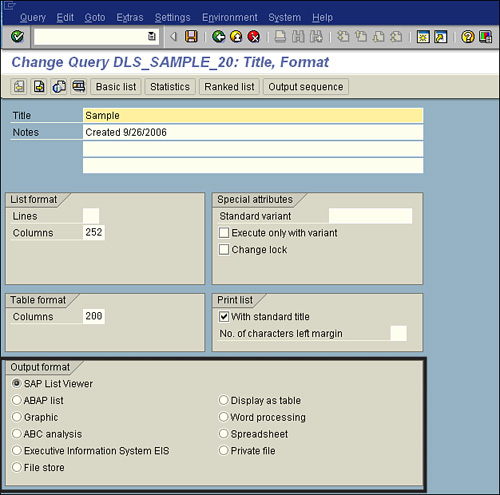
The options in the Output Format section look familiar because they are the same as the options that are available in the Output Format section on the Title, Format screen of the SAP Query tool (see Figure 5.15).
Figure 5.15. The Output Format options for a SAP query are available in at least two places in the SAP Query tool: on the Title, Format screen and on the report’s selection screen, which is visible upon report execution.
The Output Format options are available in two places. Which section works better—the Title, Format screen of the SAP Query tool or the report’s selection screen? If no variant is set (variants are discussed in Chapter 6), the report output value indicated on the Title, Format screen is automatically used in the Output Format section on the report’s selection screen when the report is executed. However, you can override those settings on the selection screen before final execution and display of the report output.
Things to Remember
• You need to have a thorough understanding of the use of selection screens in order to produce valid report output.
• The data that appears on a selection screen varies, based on the data available in the logical database used in the report’s InfoSet.
• You have multiple output options for a report, including Microsoft Excel, a data file, or a Microsoft Word merge file.
• When reporting in the SAP Query tool, you can set the output option on the Title, Format screen of the SAP Query tool or on the report’s selection screen, which is displayed when the report is executed.