
Wind Energy
Abstract
Wind Energy, on the other hand, is relatively cost-competitive with other energy sources, but it has the same reliability issues as solar energy. Wind does not blow all the time and cannot be turned up when the electricity demand increases. As its use becomes more widespread, the environmental impacts of wind energy production are also coming to the fore, as wind farms create noise and visual pollution such that people object to living next to them.
Wind energy is relatively cost competitive with other energy sources, but it has the same reliability issues as solar energy. The wind does not blow all the time and cannot be turned up when the electricity demand increases. As its use becomes more widespread, the environmental impacts are also coming to the forefront. Wind energy creates noise and visual pollution and health effects such that people object to living next to them or placing them where they can be seen. Advocates claim that wind power has the lowest external costs when considering human health and ecological impacts, building and crop damage, global warming and loss of amenities when compared to coal, oil, gas, biomass, nuclear, hydro and solar power.
Energy derived from wind power consumes no fuel and consequently emits no air pollution. But is there any environmental impact during the manufacture of the turbines? A study by Lenzen and Munksgaard of the University of Sydney (Australia) and the Danish Institute for Local Governmental Studies reported that the energy consumed in manufacturing and transporting the materials used to build a wind power plant is paid back within a few months.
There are reports of bird and bat mortality at wind turbines, as there are around other artificial structures. Overall, the ecological impact of wind turbines on these species is not significant; however, depending on the particular site, prevention and mitigation of wildlife fatalities can affect the siting and operation of the turbines. There are also claims about the health impacts that may occur as a result of the noise pollution generated from the wind turbines. These issues are discussed in more detail later in this chapter.
Wind Energy Statistics
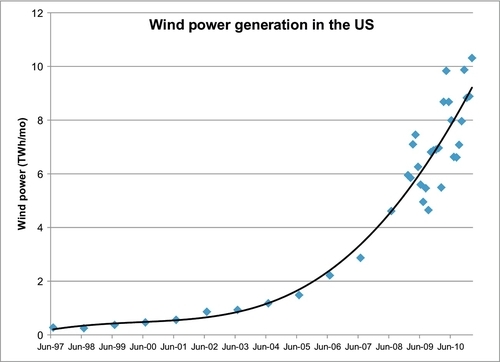
Figure 9.1 shows the statistics of electricity generation from wind power in the United States. In early 2011, the United States was generating about 10 TWh/month of electricity from wind out of a total electricity generation that ranges from a low of 305 TWh/month in November to a high of 410 TWh/month in July (when air conditioners are running full blast). Currently, wind power ranges from 2.5% to 3% of the total electricity demand. This has increased substantially from about 0.1% of the total electricity demand in 1997 and is still increasing as shown in the attached plot in Figure 9.1. Though wind power is rising and outperforms solar, biomass (wood), geothermal and petroleum as electricity fuel sources, it still trails coal, gas, nuclear and hydroelectric by a large margin. By contrast, coal comprises 45% of the electricity generation market, natural gas is 25%, nuclear is 20% and hydroelectric is 6%. There is no doubt, however, that wind power is gaining in importance.
The installed capacity of U.S. wind generators is currently 46 GW (2011 estimate). The total generating capacity is thus 33.3 TWh/mo. The 10 TWh/mo actually generated represents a capacity factor of 30%. This capacity factor has also been rising rapidly, up from 22.5% in 2005 and 23.5% in 2008. Current design strategies are aimed at maximizing this capacity factor by minimizing the generator size on each turbine, as explained in the next section.
Even though the installed capacity of wind power in the United States has been rising rapidly, it still trails Europe by a wide margin and was recently overtaken by China, which has been installing wind generators at a faster rate than the United States. In 2010, Europe had an installed capacity of 84 GW and was expected to reach 100-GW capacity by 2012. In 2010, China had an installed capacity of 42 GW and was expected to reach 70-GW capacity by 2012.
Physics and Engineering of Wind Power
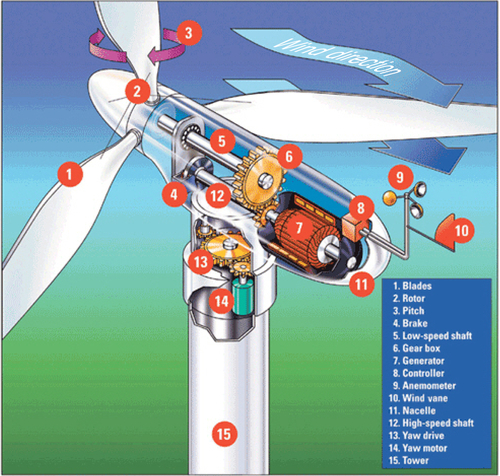
A wind turbine converts the kinetic energy of the wind into electrical energy. The elements of a wind turbine are shown in Figure 9.2. Wind power has also been used to grind grain (the traditional windmill) and pump water, but the large application in today’s energy environment is electricity generation. This is a relatively new application.
The equation for kinetic energy is:
Where
m = mass = density × volume = ρV
v = velocity of the wind
E = energy
The volume (V) can be calculated from the area (perpendicular to the flow) by the length. The length is equal to the velocity by time. The area perpendicular to the flow is given by:
![]()
Where D is the diameter of the turbine blades, ρ is the density of the air, t is the time, and V is the volume of the air
Using the first law of thermodynamics, the energy extracted by the turbine is given by the kinetic energy of the air flowing into the turbine blades minus the kinetic energy of the wind flowing out of the turbine blades minus any frictional energy lost in the moving parts of the turbine and the generator:
Where vin is the velocity of the air flowing into the turbine, vout is the velocity of the air flowing out of the turbineThe velocity of the wind leaving the turbine, vout, cannot be zero because this would stop the air flow and no new air could flow into the turbine. In practice, the energy lost to friction and the energy lost to the air flowing back out of the turbine are expressed as turbine inefficiency.
Equation 9.2 can be written in terms of the wind velocity, v, of the air flowing into the turbine and the energy conversion efficiency, η, as follows:
Where η is the turbine efficiency
Even if there were no frictional losses, the turbine efficiency (η) could not be more than 59.3% because of the velocity of the air leaving the turbine. This limit is known as the Betz limit, after Albert Betz who published this result in 1920. It is relatively easy to derive this limit using the principles of conservation of energy, the conservation of momentum, the conservation of mass and the well known Bernoulli’s equation for fluid flow. Using these principles, Betz showed that the theoretical efficiency of a frictionless turbine is given by:
It is then simple to demonstrate that the maximum efficiency is η = 16/27 (≈ 59.3%), which occurs when vout/vin = 1/3. This means that if you could design a wind turbine such that the velocity of the wind flowing out of the turbine was one-third of the velocity of the wind flowing into the turbine, and the turbine had no frictional losses, the efficiency (η) of the turbine would be 59.3%, which is the absolute maximum that could be achieved. In practice, the value of η for large commercial turbines ranges from 40% to 45%.
Converting the mass to a density × volume (ρV) and the volume to area × velocity × time (¼πD2vt) leads to Equation 9.5
Power is the rate of energy conversion, calculated using energy (E) divided by time (t). The t can be eliminated from Equation 9.5 by writing the equation in terms of power (P):
The density of air varies according to the temperature, humidity, and pressure. At higher elevations, the pressure and temperature decrease, as does the density. At sea level with an atmospheric pressure of 1075 millibars (mb), a temperature of 30°C (86°F), and a dew point temperature of 20°C (68°F), the density of air is 1.225 kg/m3. At an elevation of 2062 m (6762 ft., e.g., Rawlins, WY) with an atmospheric pressure of 844 mb, a temperature of 20°C (68°F), and a dew point temperature of 0°C (32°F), the density of air is 1.000 kg/m3. With an assumed turbine efficiency of 40% at sea level, Equation 9.6 becomes (using SI units):
With an assumed turbine efficiency of 40% at an elevation of 6762 ft., where the density of air is 1 kg/m3, the equation (in SI units) would be:
Notice that the power that can be delivered by the turbine is proportional to the cubic power of the wind speed.
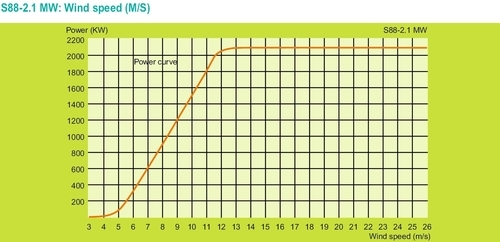
As an example, the Suzlon S88 wind turbine has blades with a diameter of 88 m (288 ft.) and is rated to operate in winds up to 25 m/s (56 mph). The turbine and generator sit on a 79-m tower. If you are wondering about the geometry of an 88-m diameter turbine sitting on a 79-m tower, just remember that the blades only extend down 44 m from the top of the tower and 44 m up above the tower. Above the maximum allowable wind speed of 25 m/s, the turbine is shut down to avoid blade and tower damage. The rated wind speed is 14 m/s (31.3 mph). This is the speed where the turbine is guaranteed to produce the rated power. This rated wind speed is slightly above the actual wind speed where maximum power is achieved.
Using those numbers, including the maximum allowable wind speed of 25 m/s in Equation 9.6, the power output of the turbine can be calculated:
![]()
If you look up the specifications of the Suzlon S88, you will find that the generator attached to the turbine can only generate 2.1 MW. This is because the turbine is not regularly exposed to 56-mph winds. There is no use putting a very expensive 23-MW electrical generator on the turbine if the winds speeds are usually not fast enough to generate that power. To generate 2.1 MW, the wind speeds would have to be 11.2 m/s (25 mph). If the wind speed is less than 11.2 m/s, the turbine will generate less than the rated 2.1 MW. If the Suzlon S88 was fitted with a generator twice the size (4.2 MW), it would only harness maybe 10% more energy (depending on the wind profile) and its capacity factor would decrease substantially.
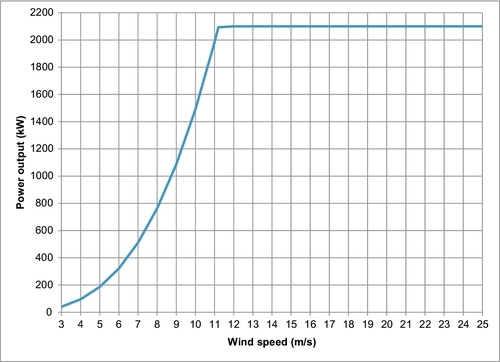
The power generated by the Suzlon S88, calculated from Equation 9.7, is shown in Figure 9.3. Compare this with the published power curve for the S88 shown in Figure 9.4. The power generated increases with a cubic exponent up to the wind speed of 11.2 m/s (25 mph). From 11.2 to 25 m/s, the power generated remains constant at 2.1 MW. To achieve this constant power output, the pitch of the blades is feathered to reduce the efficiency further and keep the power at 2.1 MW. At 25 m/s (56 mph), the turbine is shut down to avoid damage that might be caused by high winds. It is allowed to restart when the wind speed has decreased significantly.
In any given area, the wind speed tends to follow a Rayleigh distribution in terms of the time spent at each wind speed. Without going into the equations for a Rayleigh distribution, this means that if you plotted the number of hours that the wind blows at a particular wind speed versus the wind speed, it would look like Figure 9.5. The plot in Figure 9.5 has put all the wind speeds into bins that are 1 m/s wide and plotted the annual hours for each wind speed. The Rayleigh distribution does not model the zero wind speed particularly well because it assumes that the wind blows at zero speed for zero hours, which is obviously not true. The fact that this distribution is not valid for zero speed is of no consequence because no power is generated at zero speed anyway and, in the case of the S88, the turbine does not even start turning until a cut-in wind speed of 4 m/s is reached.
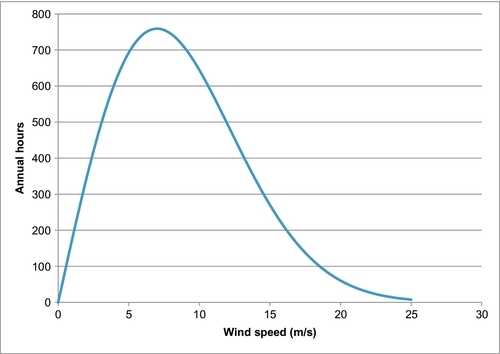
In the example given in Figure 9.5, the most common wind speed (the modal speed) is 7 m/s (15.6 mph). At 7 m/s, the Suzlon S88 turbine would only generate 511 kW, even though it has a capacity of 2.1 MW. The S88’s minimum wind speed is 4 m/s where the turbine first starts generating power. At 4 m/s the turbine generates only 95 kW. This illustrates one of the problems with wind turbines. Most of the time they cannot generate their full capacity and, when the wind is not blowing, they cannot generate any power. Moreover, the generator is deliberately undersized so that it matches the more common wind speeds, not the high wind speeds. Doing this raises the so-called capacity factor for the turbine but not the power output. It also allows the turbine to produce constant power over a wider range of wind speeds. The capacity factor is the actual energy generated divided by the theoretical maximum energy that could be generated if the turbine was generating electricity at the maximum rate 100% of the time.
Theoretically, the Suzlon manufacturers could put any size generator on the S88 up to the full 23.3-MW capacities. Figure 9.6 shows what the power profile would look like with four different generators ranging from 1.1 MW up to 6 MW. As the size of the generator increases, the amount of energy that can be extracted from the wind increases, but not directly proportional to the size of the generator, and the capacity factor decreases (see Figure 9.7). The amount of energy that can be extracted from the wind is not directly proportional to the size of the generator because of the wind profile. For example, if a 6-MW generator was attached to the Suzlon S88, it would not reach full capacity until the wind speed reached 16 m/s (36 mph). If this turbine was placed in an area where the Rayleigh distribution of the wind speed looked like Figure 9.5, it would only be generating the full 6 MW when the wind speed was at or above 16 m/s, which would only be 8% of the time. If the wind frequency profile looked like Figure 9.5, the S88 could generate 14 GWh/yr with a 6 MW generator compared to 9 GWh/yr with the 2.1-MW generator normally supplied with the S88. The capacity factor, however, would decrease from 49% with the 2.1-MW generator to 27% with the 6 MW generator. These calculations do not allow for repair and maintenance downtime, which would decrease the estimates for the capacity factor and total energy generated. It also does not take into account the economics of using a larger generator. I have no data on the increased capital and maintenance cost of the larger generator to determine if this would be worthwhile.
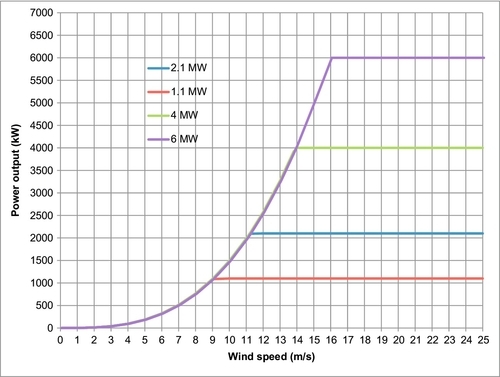
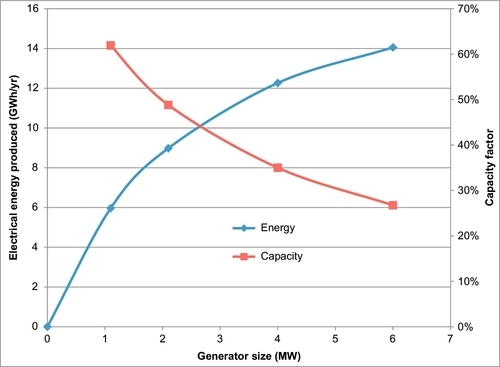
Figure 9.6 shows how both the energy generated and the capacity factor change when the generator size changes.
The technical specifications for other commercial wind turbines are shown in Table 9.1. Blade diameters range from 62 to 100 m with installed generator capacity in the range of 1-3 MW per turbine. Notice that the Vestas V90 comes with generators of two different sizes. As its name implies, the turbine blades have a diameter of 90 m, but they can be ordered with either a 1.8-MW generator or a 3.0-MW generator. The smaller generator is designed to be used in areas with lighter winds so that the capacity factor can be maintained at a higher value in the less windy areas.
Table 9.1
Technical Specifications on Selected Commercial Wind Turbines
| Model | Capacity (MW) | Blade Length (m) | Tower Height (m) | Total Height (m) | Blade Tip Speed (mph) | Rated Wind Speed (m/s) |
| GE 1.5 s | 1.5 | 35.25 | 64.7 | 99.95 | 183 | 12 |
| GE 1.5sle | 1.5 | 38.5 | 80 | 118.5 | 183 | 14 |
| Vestas V82 | 1.65 | 41 | 70 | 111 | 138 | 13 |
| Vestas V90 | 1.8 | 45 | 80 | 125 | 157 | 11 |
| Vestas V100 | 2.75 | 50 | 80 | 130 | 179 | 15 |
| Vestas V90 | 3.0 | 45 | 80 | 125 | 200 | 15 |
| Vestas V112 | 3.0 | 56 | 84 | 136 | 232 | 12 |
| Gamesa G87 | 2.0 | 43.5 | 78 | 121.5 | 194 | 13.5 |
| Siemens | 2.3 | 46.5 | 80 | 126.5 | 169 | 14 |
| Bonus (Siemens) | 1.3 | 31 | 68 | 99 | 138 | 14 |
| Bonus (Siemens) | 2.0 | 38 | 60 | 98 | 151 | 15 |
| Bonus (Siemens) | 2.3 | 41.2 | 80 | 121.2 | 164 | 15 |
| Suzlon 950 | 0.95 | 32 | 65 | 97 | 156 | 11 |
| Suzlon S64 | 1.25 | 32 | 73 | 105 | 156 | 12 |
| Suzlon S88 | 2.1 | 44 | 79 | 124 | 181 | 14 |
| Repower MM92 | 2.0 | 46.25 | 100 | 146.25 | 163 | 11.2 |
| Clipper Liberty | 2.5 | 44.5 | 80 | 124.5 | 163 | 11.5 |
| Mitsubishi MWT95 | 2.4 | 47.5 | 80 | 127.5 | 188 | 12.5 |
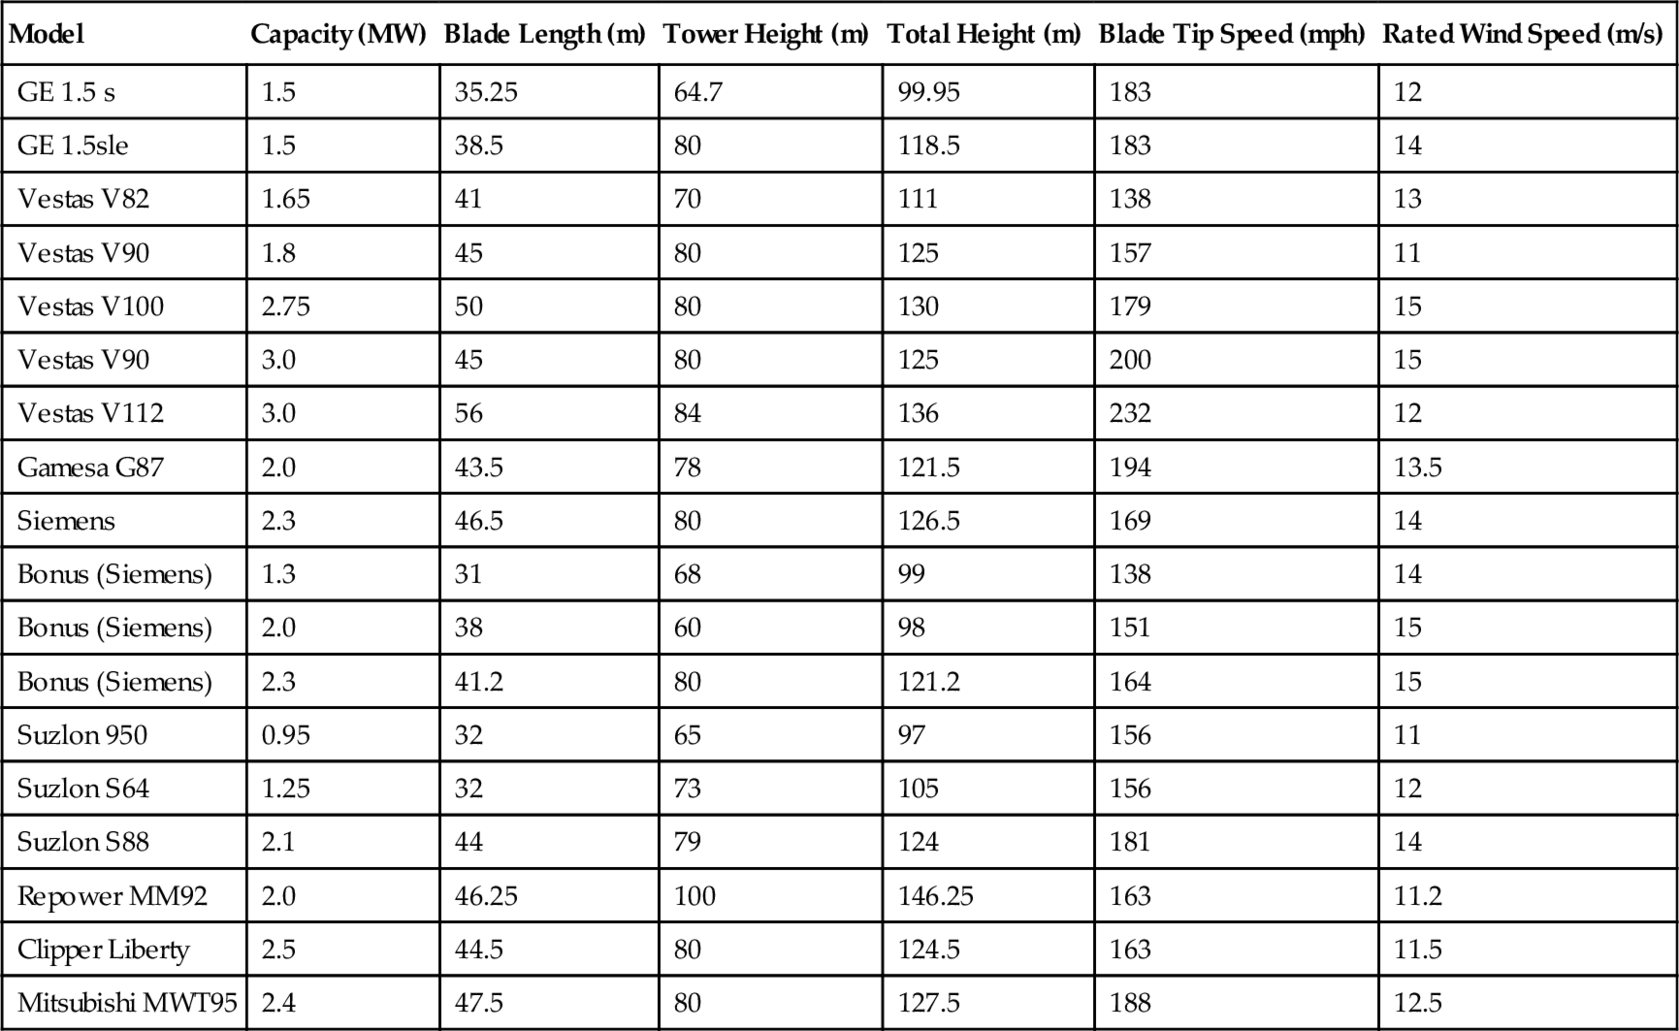
Most of the turbines sit on a tower around 80-m high. The wind speed increases at higher heights above the ground. At about 80 m, the wind speed levels off. This turns out to be an optimum height for the tower.
The top 10 wind turbine manufacturers in 2010, with their market share, are:
2. Sinovel 11.1%
3. GE Wind Energy 9.6%
4. Goldwind 9.5%
5. Enercon 7.2%
6. Suzlon Group 6.9%
7. Dongfang Electric 6.7%
8. Gamesa 6.6%
9. Siemens Wind Power 5.9%
10. United Power 4.2%
The largest is Vestas, a Danish company, and 4 of the top 10—Sinovel, Goldwind, Dongfang and United—are Chinese companies. This is not surprising given that wind energy has been growing the most rapidly in China. The only American company on the list is General Electric at number 3. As well as Vestas, Siemens also manufacturers their turbines in Denmark where wind turbine technology has been given a favored economic status.
Carbon Dioxide Emissions and Pollution
Wind power consumes no fuel and thus has no emissions directly related to electricity production. Wind power plants, however, do produce emissions during the initial manufacturing and construction. During the manufacture of the wind turbine, steel, concrete, copper wire, rubber, aluminum and other materials are manufactured and transported using processes that generate some emissions. The majority of the CO2 emissions come from producing the concrete for the wind turbine foundations. The wind turbine manufacturer, Vestas, claims that the initial carbon dioxide emissions payback is within about nine months of operation. This is compared to a standard coal-fired power plant. Another 2006 study reported in Wikipedia found that CO2 emissions of wind power range from 14 to 33 tons/GWh of energy produced.
A study by the Irish National Grid stated that “Producing electricity from wind reduces the consumption of fossil fuels and therefore leads to emissions savings.” It found reductions in CO2 emissions ranging from 330 to 590 tons of CO2 per GWh.
Land Use Issues
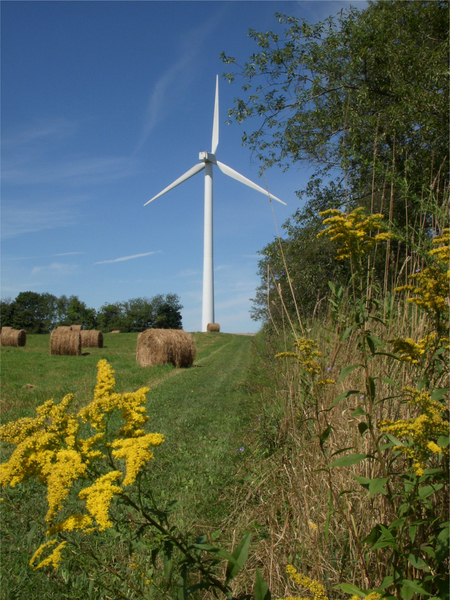
A wind farm requires roughly 0.1 km2 (0.039 sq mi, 25 acres) of clear land per megawatt of turbine capacity. A 1-GW (1000-MW) wind farm, for example, might extend over an area of approximately 100 km2 (25,000 acres). If they are sited closer together, the turbines start to interfere with each other’s efficiency and they begin to harness less energy. 1 GW per 100 km2 amounts to 10 W/m2, and that is the maximum energy that can be harnessed if the wind blows at a constant rate all the time. If you put larger turbines in the same area, you have to put them farther apart so that they do not interfere with each other. The area required per turbine increases linearly as the turbine power increases. The maximum recoverable wind energy, however, remains constant at 10 W/m2. Moreover, the average capacity factor for modern wind turbines is about 20%-30%, so this means that the turbines can harness about 2-3 W/m2 (Figures 9.8 and 9.9).
In a typical wind prone area, the total available power from the wind is about 500 W/m2. It would appear that wind turbines are capable of capturing less than 1% of this energy. It is not possible to harness more than 3 W/m2 from even the most favorable windy areas. This may seem like a relatively large footprint for an energy harnessing installation, but the land can still be used for other activities, particularly crops and animal grazing. Wind energy experts contend that less than 1% of the land needs to be used for foundations and access roads; the other 99% can still be used for farming. Some clearing of trees around tower bases would be necessary for the installation of tower sites in wooded areas, but the affected footprint would remain small.
At 2-3 W/m2, the current installed wind-generating capacity of 46 GW occupies an area of 15-23 Gm2 (3.7-5.7 million acres). If you wanted to increase production to 200 TWh/month—half of the U.S. electricity demand—you would need to install another 875 GW of wind-generating capacity for a total capacity of 920 GW. This would occupy 310-460 Gm2 (76-115 million acres). This is approximately equal to the entire states of Colorado and Nebraska combined. While it is feasible to do this, the 875 GW would have to be backed up by other energy sources or energy storage capacity.
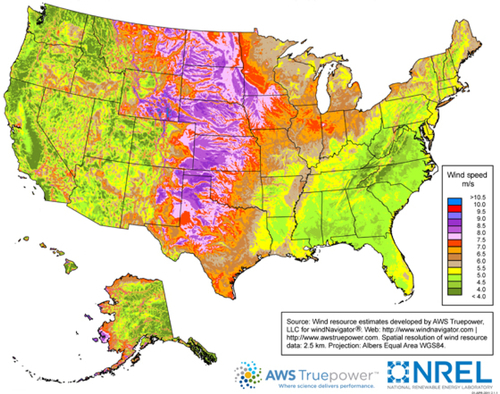
Figure. 9.10 shows the average wind speed in all areas of the United States. The best areas for wind power generation are in the central plains areas reaching from North Dakota and Montana in the north to Texas in the south, to Wyoming in the west, and as far east as Indiana. There are clearly large areas of the country that are suitable for wind generation. This map does not include offshore areas where additional potential exists.
In the United States, landowners typically receive $3,000 to $5,000 per year in rental income from each wind turbine, depending on the size. These turbines are usually deployed at a density of about one every thirty acres. A 1,000 acre tract of land, for example, could generate about $100,000 per year for the landowner in addition to the income gained from growing crops or grazing animals on the land.
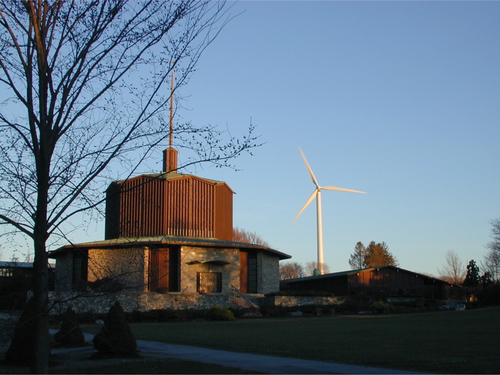
Turbines are not generally installed in urban areas, except as smaller single units (see Figure 9.11). Buildings interfere with the wind flow, and turbines must be sited a safe distance from residences to guard against failure. The 20-MW Steel Winds project south of Buffalo, New York is an exception. It is situated in an urban location, but is separated from residences by siting the turbines on an uninhabited lake shore.
Wind turbines located in agricultural areas do interfere with crop-dusting operations. Operating rules prohibit the approach of aircrafts within a stated distance of the turbine towers. Even if turbine operators agree to shut down the turbines during crop-dusting operations, flying between turbines is still hazardous and limits the effectiveness of crop dusting.
In Ireland and Scotland, there has also been concern about the damage caused to peat bogs, with one Scottish politician campaigning for a moratorium on wind developments on peat areas claiming that, “Damaging the peat causes the release of more carbon dioxide than wind farms save.”
The Portsmouth Abbey Wind Turbine
Portsmouth Abbey operates a Benedictine High School in Portsmouth, Rhode Island, and they have installed a single 660-kW turbine on a small hill on school grounds, set back sufficiently from the school buildings and neighboring houses (see Figures 9.11 and 9.12). This project is representative of other projects in the United States because there are similar small wind-generating projects in other urban areas around the world. Some details of the Portsmouth Abbey project are provided on the Portsmouth Abbey website and include the following information:
• Portsmouth Abbey and the Benedictine High School are one of the larger customers of national grid in this area and have been working diligently to combat rising energy costs through the implementation of energy efficiency and conservation programs.
• In addition to energy conservation measures, the Abbey wished to promote renewable energy and had looked into a number of options, including solar, geothermal and wind power.
• As wind has been a resource on the site of the school since colonial times, it was determined that a wind turbine could possibly provide the Abbey and the school with the best option for a renewable energy source and the greatest savings in energy costs.
• With the assistance of the R.I. Renewable Energy Fund and the Roger Williams University, the school initiated a detailed study to quantify the local wind resource, including the installation of a special 50-m (164-ft.) tall meteorological monitoring pole.
• Additional analysis was made of the electrical usage patterns of the school in order to select a wind turbine that would produce the needed energy using the available winds. The desire was to select a turbine that could meet the school's needs and yet be sensitive to the setting of the Abbey and the neighborhood. Studies found that a mid-sized wind turbine would suffice. In addition, the Abbey had enough space to place the turbine away from its boundaries. The turbine is approximately 750 ft. from the nearest neighbor.
• A Vestas 660-kW wind turbine generator was selected as the best choice for this project. This turbine has three 77-ft carbon fiber blades atop a 164-ft tapered tubular steel tower. The rotor turns at a constant 28.5 revolutions per minute. The structure stands a proud 240 ft from the ground to the tip of the highest blade. The turbine is secured by a concrete foundation that sits in a 30-ft hole, and its tower is firmly bolted to 80, one-inch diameter, 27-ft-long rods set firmly into the foundation.
• Over the last two decades, modern wind turbines generators have advanced in technology and are proven, reliable sources of electricity that are pollution-free and safe for the community. This wind energy project is providing a unique benefit to local schools. Portsmouth Abbey continues to invite local student groups for presentations and tours and hopes, in the future, to make available data that can be used for any number of academic disciplines, including meteorology, environmental or earth science, physics, engineering, etc.
• Modern wind turbines have special design features that have significantly reduced operating noise. The wind turbine produces less than 45 dB (decibels) at the edge of Cory's Lane. This is comparable to the ambient sounds of the wind blowing through the trees. The wind turbine is not a hazard to wildlife.
• Power from the wind turbine at the school reduces the load on the local utility electrical distribution feeder. This provides higher voltage and improved power quality to the entire neighborhood during peak power use periods.
• In December 2004, the Abbey applied to the State of Rhode Island Renewable Energy Fund for its support of this wind power project. After careful evaluation of the proposed plan, the Fund Board generously made available their advisory resources as well as a grant for more than one-third of the estimated project costs.
• On March 18, 2005, the Abbey applied to the Town of Portsmouth for the special-use, permit and variance needed to bring a wind turbine to fruition. With strong support from neighbors, the permit was unanimously granted.
• The foundation was completed at the beginning of January 2006. The State of Connecticut Police Department gave special permission for the lower part of the tower to travel through the state on a Friday, due to the truck's oversize load.
• The turbine arrived during the week of March 20 and was erected during the last week in March 2006. Brother Joseph watched the sun rise from the top of the turbine on March 31, 2006, the day the blades began to turn. The turbine began providing electricity for the grid at 10 a.m. that morning.
• As of March 31, 2007, one year to the day after the wind turbine began its operation, it has generated nearly 1.3 million kWh of clean electricity and has supplied 39.35% of the school's electrical energy use. This successful trend has continued.
• During its first year of operation, the highest documented wind gust was 67 mph. The turbine generates electricity at wind speeds up to the maximum of 55 mph, then pitches the blades to 90° angles and waits for the wind to subside to 45 mph before starting to turn again.
• Total wind turbine revenues during its first year of operation were $222,710, including $64,661 in renewable energy credits, $28,496 in wholesale electricity sold back to the grid, and $129,553 in retail electricity displaced.
• For its important contributions to conservation in Rhode Island, Portsmouth, the Abbey and the school received the 2007 Environmental Merit Award by the U.S. Environmental Protection Agency, the 2007 Conservation Award by the Garden Club of America, and the 2006 Senator John H. Chafee Award for Outstanding Conservation Project.
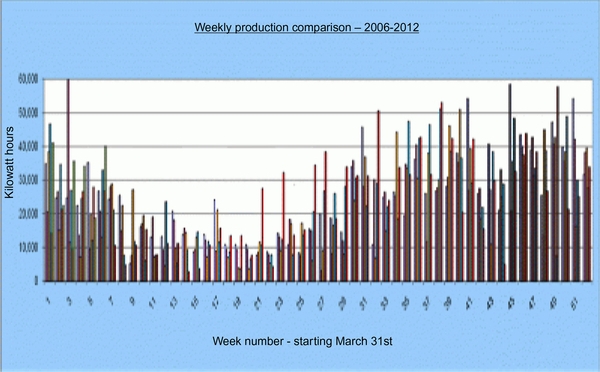
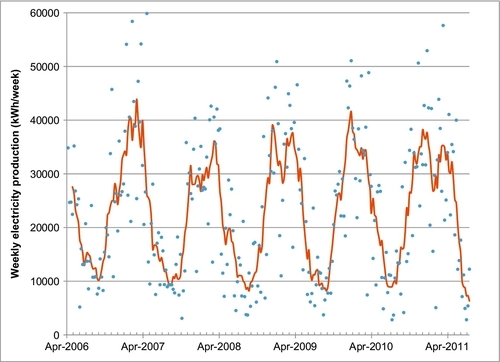
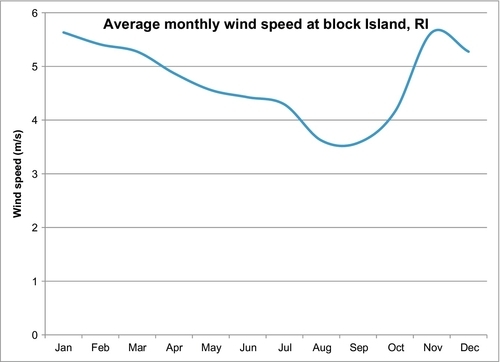
The Portsmouth turbine is monitored weekly for its energy output. The bar chart in Figure 9.13 and the graph in Figure 9.14 show the electrical energy output of the turbine's first five years, which began on March 31, 2006. The blue dots on Figure 9.14 show the weekly energy production and the red line shows the seven-week moving average of the weekly data. The moving average line shows that the energy production has an annual cycle of being higher in the winter months of November to February and lower in the summer months of July to September. This coincides with lower wind speeds in the summer and higher speeds in the winter.
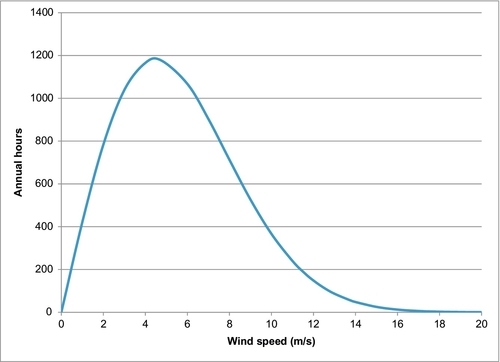
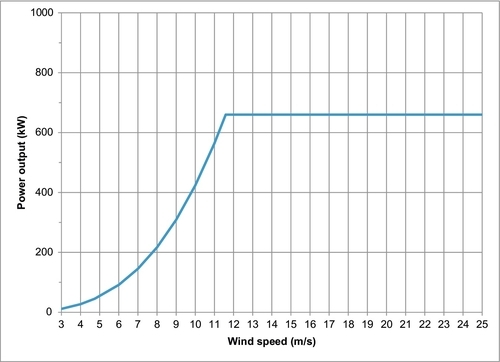
The National Oceanic and Atmospheric Administration (NOAA) publish wind speed data for various locations around the United States. Figure 9.15 shows the average monthly wind speed for Block Island off Rhode Island. This data is reasonably representative of the Portsmouth area, where the Portsmouth Abbey Wind Turbine is located. This shows the lower average winds speeds in the summer. The average wind speed year-round is 4.75 m/s, and this can be represented with a Rayleigh distribution plot with a characteristic modal wind speed of 4.5 m/s, as shown in Figure 9.16. The Vestas turbine used here has a blade length of 77 ft, giving a blade diameter of 47 m. The energy output of this turbine, calculated from Equation 9.7, is shown in Figure 9.17. From this plot, it can be seen that the rated power output of 660 kW is reached at 11.6 m/s, well above the average wind speed. At the average wind speed of 4.75 m/s, only 45 kW can be generated by this turbine.
In order to analyze the optimum generator size, four generator sizes were investigated with regard to this turbine: 53 kW, 660 kW, 1.1 MW and 2.08 MW. The power output profiles for these four generators are shown in Figure 9.18. It is easy to see that the 53-kW turbine is close to the maximum power output for the average wind speed and it is tempting to argue that a bigger generator is not justified. Figure 9.19, however, shows the energy generated over one year and the resulting capacity factor for each generator size. The smallest generator (53 kW) would enjoy a high capacity factor of 65%, meaning that it would be operating most of the time and usually generating power at its maximum capacity; however, it would only generate 0.3 GWh per year. The 660-kW generator, by contrast, would be able to generate almost four times that amount of electricity at 1.12 GWh per year, even though its capacity factor drops down to only 19%. The 1.1-MW generator would only be able to generate a little more than this at 1.2 GWh per year and the 2.08-MW generator would only generate about 1.23 GWh per year. The bigger generators don’t generate much more electricity because it takes much higher wind speeds for them to reach their maximum generating potential and in that area those wind speeds are rarely seen. The 1.1-MW generator needs wind at 13.75 m/s (31 mph) to reach its full 1.1 MW of power, while the 2.08-MW generator needs wind at 17 m/s (38 mph) to reach its full 2.08 MW of potential. Their capacity factors also drop down to 12.5% and 6.75%, respectively. Consequently, the 660-kW generator is the optimum size for this turbine and for the wind profile in this area.
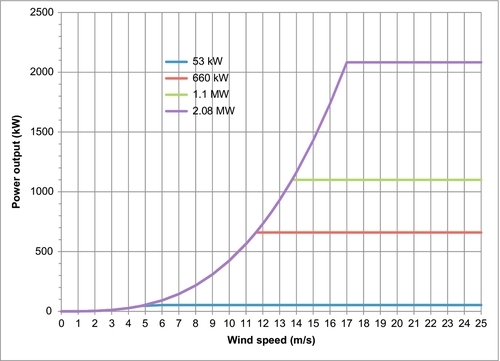
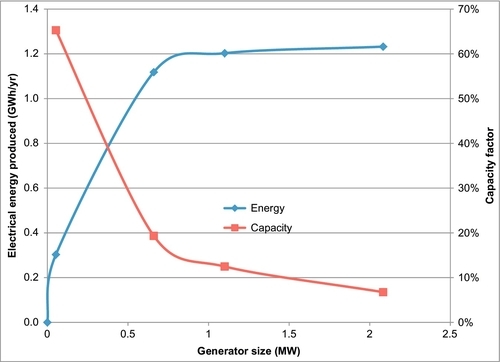
Table 9.2 below shows the actual electricity generated during the first five years of operation. The average amount generated in the first five years was 1.214 GWh per year, which is very close to what was predicted for the wind profile with this turbine and is about as well as can be expected.
Impact on Birds, Bats and Other Flying Wildlife
There is a lingering perception that wind turbines kill a lot of birds and bats. This is not really true. In fact, wind farms cause about 0.4 bird fatalities per gigawatt-hour of electricity generated. This is relatively low and on par with any large manmade structure. It is also small compared to the number that die as a result of automobile traffic, hunting, electric power transmission lines, high-rise buildings and cats. In the United States, turbines kill about 150,000 birds per year, compared to 80,000 killed by aircraft, 80 million killed by cars, 100 million killed by collisions with plate glass, 130 million killed by power lines and 200 million killed by cats. The impact of wind turbines on birds is really negligible compared to other hazards.
In 2009, the Royal Society for the Protection of Birds (RSPB) in the UK warned that “numbers of several breeding birds of high conservation concern are reduced close to wind turbines,” probably because “… birds may use areas close to the turbines less often than would be expected, potentially reducing the carrying capacity of an area.” In the United States, the National Audubon Society also warns against siting wind farms in areas especially important to birds and other affected wildlife.
The U.S. Fish and Wildlife Service have also expressed concern and have issued guidelines for the siting of wind energy facilities in the United States. These guidelines recommend that wind farm operators do not place turbines in the following areas: areas documented as the location of any species protected under the Endangered Species Act; local bird migration pathways or areas where birds concentrate; near landscape features that attract raptors; in a configuration that is likely to cause bird mortality; and, areas where fragmentation of large contiguous tracts of wildlife habitat will occur as a result of turbine placement.
The Peñascal Wind Power Project in Texas and the Altamont Pass Wind Farm in California are two projects that have had particular issues with bird mortality. The Peñascal Wind Farm is located in the path of a bird migration route and it uses avian radar detectors to detect birds as far as 4 miles away. If the system determines that the birds are in danger of running into the rotating blades, it shuts down the turbines. The system automatically restarts the turbines when the birds have passed. At the Altamont Pass Wind Farm in California, continued efforts to reduce raptor and other bird mortality, including seasonal shutdowns, have proved ineffective. The issue appears to be with the size of the turbines because they currently believe that larger modern turbines would substantially reduce the number of raptors killed per megawatt of power produced at APWRA.
Bat migration can also be affected by wind turbine activity, but much less is known about these effects. One 2004 study in the eastern United States estimated that over 2,200 bats were killed by 63 onshore turbines in a six-week study. One method of mitigating this is to install microwave transmitters on the turbines. As bats use radar to migrate, they avoid radar-transmitting devices. The microwave rays warn the bats to stay away.
Impacts on People
Safety
Any large mechanical device such as a wind turbine has some hazards associated with its construction and operation. Hazards include workers falling off the towers or becoming caught in machinery. The blades can also fail and disintegrate, creating hazards for those nearby. Sometimes ice can form on the blades and be projected onto the ground. Aircraft and parachutists have also crashed into them. Malfunctioning turbines can potentially catch fire. The average death rate associated with wind-power generation is about 0.1 deaths per TWh generated. This is fairly low and is comparable to hydroelectric power.
Health and Esthetics
Some people object to the presence of wind turbines because they are large and visible. Many people do not like to live next to them because of noise, shadow flicker or because they are an eyesore. In agricultural areas, people still complain that they destroy the viewshed in otherwise pristine wilderness areas. Even when they are driving down the highway, some feel that the towers interfere with their view of the wilderness. These are subjective concerns, but some of them, such as noise, strobing and shadow flicker, can be measured. Noise is only an issue for those who live and work close to a turbine or wind farm; however, the noise generated is always less than traffic noise. The reported effects of noise include dizziness, anxiety, headaches and interruption to sleep patterns.
In Ontario, Canada, the Ministry of the Environment created noise guidelines to limit wind turbine noise levels at 30-m away from a dwelling or campsite to 40 decibels. Other countries have created minimum setbacks between turbines and dwellings. Two kilometers is typical.
A 2008 European Union–sponsored report from The Netherlands found that “…the sound of wind turbines causes relatively much annoyance. The sound is perceived at relatively low levels and is thought to be more annoying than equally loud air or road traffic.” The report found that, “annoyance with wind turbine noise was associated with psychological distress, stress, difficulties to fall asleep and sleep interruption,” which they described as a health effect. Similarly, a 2007 Swedish study report stated, “Annoyance is an adverse health effect.”
A 2007 report by the US National Research Council noted, “… Low-frequency vibration and its effects on humans are not well understood. Sensitivity to such vibration resulting from wind-turbine noise is highly variable among humans.” Although there are opposing views on the subject, it has recently been stated (Pierpont 2006) that “…some people feel disturbing amounts of vibration or pulsation from wind turbines, and can count in their bodies, especially their chests, the beats of the blades passing the towers, even when they can’t hear or see them.” More needs to be understood regarding the effects of low-frequency noise on humans.
A 2009 report sponsored by wind-industry groups made the following counterclaims:
• Wind Turbine Syndrome symptoms are the same as those seen in the general population due to stresses of daily life. They include headaches, insomnia, anxiety and dizziness.
• Low frequency and very low–frequency “infra-sounds” produced by wind turbines are the same as those produced by vehicular traffic and home appliances, even by the beating of people's hearts. Such infra-sounds are not special and convey no risk factors.
People also complain about shadow flicker and strobing from wind turbines. Shadow flicker is caused by the blade casting moving shadows on the ground and through windows. Strobing is the effect produced when a turbine blade reflects the sun onto the ground and into people’s eyes. This may only occur for a short period during the day, but people have reported numerous health effects from these, ranging from distraction while operating equipment to vertigo, headaches, nausea and seizures.
On April 4, 2004, Der Spiegel (Germany) was quoted by The Telegraph (England) saying, “They introduced the world to ‘environmentally friendly’ energy, but now some of Europe's ‘greenest’ countries are under pressure to backtrack on wind farms in the face of public anger over their impact on the countryside…Voters are outraged by the unsightly turbines, the loud, low-frequency humming noise that they create and the stroboscopic effects of blades rotating in sunshine…The dream of environmentally friendly energy has turned into highly subsidized destruction of the countryside.”
This returns to the point of the Towler Principle—you cannot extract energy from the environment without having an impact on the environment. The more successful the energy source, the bigger is its environmental effects and the more these effects are noticed.
Energy Reliability
Despite the reported health effects and other objections that people have, the big problem with wind power is that the wind does not blow all the time and so the electricity production rises and falls as the wind speed rises and falls. This does not coincide with the demand for electricity. Depending on the site and the turbine properties, the wind turbine is usually generating electricity about 20-30% of the time. In the Portsmouth Abbey Wind Turbine project described above, they used a 660-kW turbine and generated 1.3 GWh in the first year and 6.07 GWh in five years, at an average of 1.214 GWh per year. This represents a capacity factor of 21.6%. The average in the United States is now approaching 30%.
If we relied only on wind energy to generate our electricity, the nominal output of the turbines must be 3.33 times the average electricity demand, and 70% of the electricity generated must be stored as some other form of energy for future use. Alternatively, if the wind turbine only supplies a small fraction of the electricity, the base load source must be turned down when the wind is blowing and generating electricity and turned up again when the wind is not blowing.
Whenever wind power is deployed, there are two choices you can make with regard to the reliability issue: the wind power must be supplemented with a large energy storage project or it must be combined with an alternative and more reliable energy source. If the first option is used, the energy storage cost increases the electricity cost substantially. If the second option is preferred, it is equivalent to providing a redundant system which also increases the cost substantially. For example, if you have to build a gas- or coal-fired power plant to back up the wind turbines when the wind is not blowing, you might as well not build the wind turbine at all. Just build the gas- or coal-fired power plant and use it all the time. Then you don’t have to turn it down when the wind is blowing. Alternatively, it is possible to operate a dual purpose gas- or coal-fired power plant that generates electricity 70% of the time when the wind is not blowing, but during the 30% of the time when the wind is blowing the plant can switch to generating liquid fuels from the gas or coal. The economics of this have not been studied, but this scheme has been proposed for investigation.
You can argue that when the wind is blowing, the electricity being generated is cleaner. If clean technologies are the issue, you can build a gas- or coal-fired plant that has zero emissions and is just as clean as the wind turbine. This is a cheaper alternative to clean energy. Moreover, the wind turbine does have environmental impacts that cause concern to those affected. In fact, there are scientists that argue when all the environmental impacts are combined with the fact that the wind has to be backed up by other energy sources such as coal-fired plants, wind power is not very green at all.
Conveniently, it is near impossible to estimate the quantity of CO2 and other gases emitted in order to back-up intermittent wind power: there are too many variables involved. So the wind industry has an easy job dismissing the critics. But the fact remains that CO2 emissions are increased, possibly to the point where they fully compensate the savings realized by wind power. The example of Denmark seems to confirm this: producing 15 to 20% of its electricity from the wind, this most wind powerized country in the world has failed to reduce its greenhouse gas emissions. And California, Germany, Spain are building more fossil-fuel power plants in spite of their massive investments in wind farms. This, better than anything else, proves the point that wind farm opponents across the world are trying to make.
-Mark Duchamp, Windfarms/Birds Research Manager, Proact International, quoted on Wikipedia.
Energy Storage
If wind power is to be combined with energy storage, various storage methods must be considered. The best method currently available is pumped storage (see Chapter 10). In this method, the excess energy generated while the wind is blowing is used to pump water from a low-lying reservoir uphill to a higher reservoir. When the wind is not blowing, the water is allowed to flow from the higher reservoir to the lower reservoir, driving a water powered turbine to generate electricity. In some places, this is a reliable cost effective method of energy storage but the number of places where it can be done is limited. At the moment, the United States has the capacity to generate about 0.35 TWh/mo from pumped storage. This is clearly inadequate to back up wind power. The total hydroelectric generating capacity is about 25 TWh/mo (this depends on the level of rainfall that has filled the dams that serve the hydroelectric generators). If all of this was dedicated to backing up the wind generators, you would be restricted to only generating about 8 TWh/mo from wind. This level of electricity has already been exceeded from wind generators.
An alternative method of energy storage is the use of batteries. When the wind is blowing, the batteries are charged up, and when the wind is not blowing the batteries are used to feed electricity into the grid. This is a very expensive method of providing backup for wind power and greatly adds to the cost.
Wind power is expanding rapidly all around the world, but the larger it gets, the more reliability and backup become an issue. At the moment, the only option seems to be that the wind generators must be backed up by the fossil-fuel generators, coal and natural gas. They have to be turned up when the wind is not blowing and conversely turned down when the wind is blowing.
Summary
Despite the concerns and objections, wind power is increasing rapidly in both the United States and the world. People like wind power because it is perceived as clean energy and it is much less expensive than solar power. Consequently, its use will continue to increase for some time. It may even double in the next 10 years. Eventually, however, concerns about its environmental impacts, reliability and cost will bring a halt to its expansion.