
Hydroelectricity
Abstract
Hydroelectricity is probably the cheapest and most reliable source of renewable energy, and it has not yet reached its limit of expansion either in US or in the world. As a result, it can and should be a significant future contributor to the energy supply. But hydroelectricity has its detractors because it depends on dams that impact fish migration and spawning regions and otherwise change the ecology of the river. There are solutions to these problems, but environmental concerns remain prevalent.
Hydroelectricity is probably the cheapest, cleanest and most reliable of the renewable energy sources; however, it does have its detractors. Hydroelectricity is heavily dependent on the building of dams, which greatly alters the ecology of the river basin and limits fish migration and spawning regions. Worldwide, an installed capacity of 777 GW supplied 2998 TWh of hydroelectricity in 2006. This was approximately 20% of the world’s electricity and accounted for about 88% of electricity from renewable sources. The United States has an installed capacity of 80 GW and in 2009 generated 250 TWh of electricity. This represents 36% of the installed hydroelectric capacity, which is typical of worldwide capacity factors. A hydroelectric power station never operates at full capacity because the water flow in the river fluctuates on an annual basis. The demand for electricity can also fluctuate, on both a daily and an annual basis.
China has the largest hydroelectric generating capacity in the world with more than 200 GW of installed capacity. China also continues to increase this capacity by building dams at a rapid rate. The largest hydroelectric generating station in the world is in China at the Three Gorges Dam on the Yangtze River, which has a generating capacity of 22.5 GW. The largest in the United States is the Grand Coulee Dam on the Columbia River, which has a generating capacity of 6.8 GW. The generating stations on the Columbia River together have a combined generating capacity of 37 GW (see more details on this in a later section).
The hydroelectric generating capacity is not fully developed either in the United States or in the world. China and Canada are currently increasing their hydroelectric capacity the fastest, while the United States lags behind. The United States has about 400 GW of additional hydroelectric potential, which could generate 1250 TWh of electricity per year, assuming a similar 36% capacity factor. This would increase the hydroelectric share of U.S. electricity to about 40% of the total. Given that hydroelectric power is clean and reliable and has high turn-down ratios, increasing the level of hydroelectric power is entirely feasible. The disadvantage of this is the environmental impact. Dams change the ecology of the river, particularly altering fish migration patterns. It should be noted that there are advantages too beyond mere energy gains. Flood control, additional water availability and recreational activities always benefit from the building of dams.
Hydroelectric Basics
In a hydroelectric power station, the potential energy of the water due to its height above the turbine is first converted to kinetic energy and then to electrical energy. The formula for calculating the electric power production at a hydroelectric plant is
P = power (W),
ρ = the density of water (1000 kg/m3),
h = the difference in height between the water level behind the dam and the water level in the river below the dam (m),
V = water volumetric flow-rate (m3/s),
ρV = the mass flow-rate of the water through the turbine (kg/s)
g = acceleration due to gravity of 9.81 m/s2,
η = coefficient of efficiency due to losses.
A reasonable number for η in modern hydroelectric turbines is 0.85-0.9. This means that 10-15% of the potential energy of the water is lost due to friction of the water flowing in the penstock and in the turbine blades and gears. This “lost” energy is transmitted to the water and surrounding atmosphere as heat (see Chapter 3).
As an example, a particular turbine with an energy efficiency of 0.9 (90%) is designed to allow 1200 m3/s through its turbine blades when there is a height (h) of 94.4 m between the top of the water in the dam and the river below. To calculate the installed power capacity of this turbine:
![]()
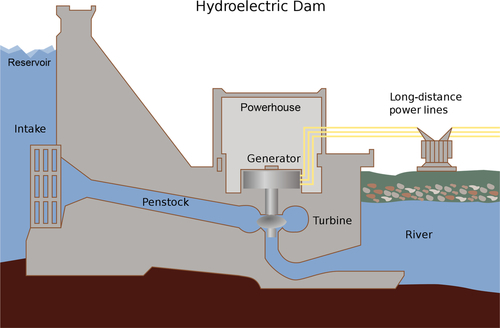
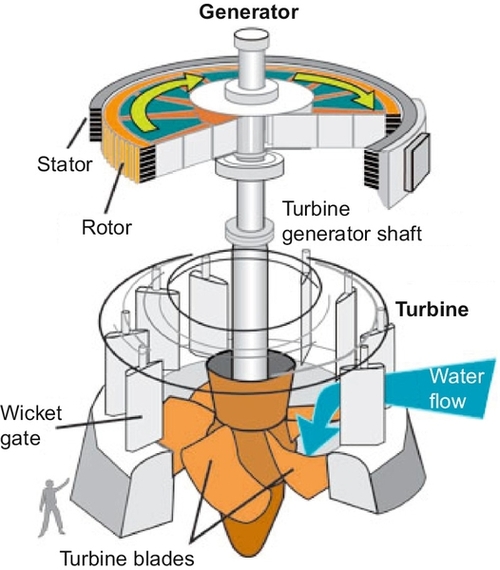
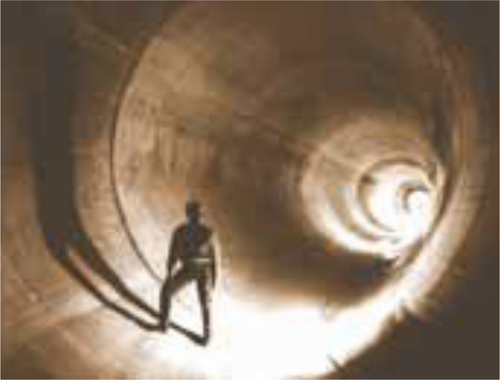
Figure 10.1 shows the elements of a hydroelectric generating station. The water from the reservoir behind the dam enters the intake near the bottom of the reservoir. It then flows through the penstock, where the potential energy of the water in the reservoir is converted to kinetic energy. The flowing water turns the turbine blades converting the kinetic energy of the water to the electric energy in the generator. The generator is then connected to the electrical grid for power use. The details of the turbine are shown in Figure 10.2. The water flowing through the penstock reaches the wicket gate which directs the water through the turbine blades causing them to turn the shaft. This turns the rotor through the stator, which causes the electrical current to flow in the stator wires. This electrical energy is then fed into the power grid. These turbines are often very large devices. Figure 10.2 compares the turbine to the size of a human being standing beside it.
In the next section, the Columbia River hydroelectric scheme is discussed in more detail as an example of river development.
The Columbia River Hydroelectric System
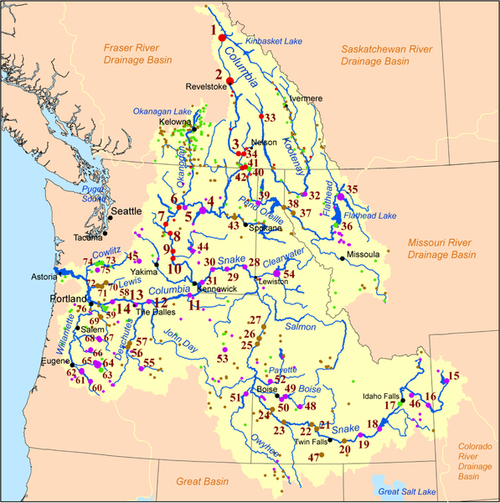
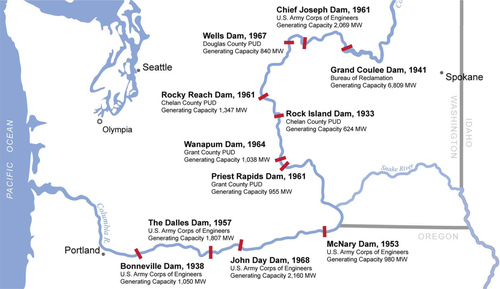
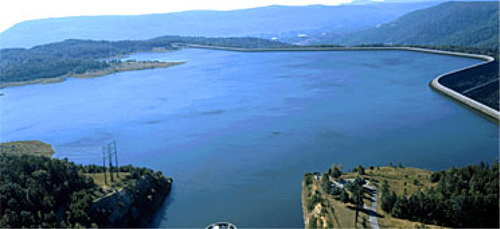
The Columbia River system in the northwest United States, shown in Figure 10.3, is an excellent example of an integrated hydroelectric development. The Columbia and its tributaries drain a 260,000-square-mile basin that spans seven states (Oregon, Washington, Idaho, Montana, Nevada, Wyoming, and Utah) and the Canadian province of British Columbia. It flows for 1243 miles from where it originates in the Columbia Lake in southeastern British Columbia. It first flows north for about 200 miles, then turns south for another 300 miles before it crosses into the U.S. state of Washington. It then flows south through Washington and turns east to form the border between Washington and Oregon. Its average volumetric discharge rate is 265,000 cubic feet of water per second (192 million acre-feet per year), with the highest volumes in the wet summer months between April and September and the lowest in the drier winter months from November to February when precipitation is lower and water is stored in the catchment basin as snow. Its source is at 2690 ft above sea level and from there it drops an average of 2.1 ft per mile, but in some sections it falls more than 5 ft per mile.
Its major tributary, the Snake River, has a source in Yellowstone Park in Wyoming at an elevation of 8930 ft above sea level. This contributes a great deal of potential energy to the system. The Snake contributes an average flow-rate of 57,000 ft3/s to the Columbia’s total of 265,000 ft3/s. The Columbia has 14 major tributaries, shown in Table 10.1 with the average discharge contribution of each tributary. The most important tributary, the Snake, has 13 tributaries of its own. It is 1078 miles long, which is longer than the 918 miles that the Columbia flows from its source to the confluence with the Snake. The Deschutes, John Day and Willamette tributaries drain basins south of the Columbia, while the Yakima, Lewis and Cowlitz tributaries drain areas on the north side of the river.
Table 10.1
Average Discharge Rates of the Columbia River Tributaries
| Tributary | Average Discharge (ft3/s) |
| Snake River | 56,900 |
| Willamette River | 37,400 |
| Kootenay River | 30,650 |
| Pend Oreille River | 26,430 |
| Cowlitz River | 9140 |
| Spokane River | 7900 |
| Lewis River | 6125 |
| Deschutes River | 5845 |
| Yakima River | 3542 |
| Wenatchee River | 3079 |
| Okanogan River | 3039 |
| Kettle River | 2925 |
| Sandy River | 2257 |
| John Day River | 2060 |
The Columbia-Snake River Basin is arguably the most hydroelectrically developed river system in the world. More than 400 dams and many other structures on tributaries restrict the river flows and tap a large portion of the Columbia's hydroelectric generating capacity, more than 34.3 GW. Figure 10.3 shows the 76 dams that generate hydroelectricity. The key to the dam numbers shown in Figure 10.3 is shown in Table 10.2. Of the 34.3 GW of generating capacity, 20 GW is on the 11 main dams on the U.S. portion of the Columbia, 4.7 GW is on the Snake, 1.6 GW is on the Kootenay, 4 GW is on the Canadian portion of the Columbia, and the other 3.7 GW is on other tributaries on the U.S. side. The 24-GW hydroelectric generating capacity in the 14 dams on the main Columbia River section is shown in Table 10.3.
Table 10.2
Map Key for Figure 10.3, The 76 Dams on the Columbia River Hydroelectric System
| Map Number | Name | River | Height (m) | Date |
| 1 | Mica Dam | Columbia River | 243 | 1973 |
| 2 | Revelstoke Dam | Columbia River | 152 | 1984 |
| 3 | Keenleyside Dam | Columbia River | 59 | 1968 |
| 4 | Grand Coulee Dam | Columbia River | 168 | 1942 |
| 5 | Chief Joseph Dam | Columbia River | 70 | 1955 |
| 6 | Wells Dam | Columbia River | 49 | 1968 |
| 7 | Rocky Reach Dam | Columbia River | 36 | 1962 |
| 8 | Rock Island Dam | Columbia River | 22 | 1932 |
| 9 | Wanapum Dam | Columbia River | 31 | 1963 |
| 10 | Priest Rapids Dam | Columbia River | 29 | 1959 |
| 11 | McNary Dam | Columbia River | 67 | 1954 |
| 12 | John Day Dam | Columbia River | 70 | 1968 |
| 13 | The Dalles Dam | Columbia River | 61 | 1957 |
| 14 | Bonneville Dam | Columbia River | 60 | 1937 |
| 15 | Jackson Lake Dam | Snake River | 21 | 1911 |
| 16 | Palisades Dam | Snake River | 82 | 1957 |
| 17 | Gem State Dam | Snake River | 12 | 1988 |
| 18 | American Falls Dam | Snake River | 32 | 1978 |
| 19 | Minidoka Dam | Snake River | 26 | 1906 |
| 20 | Milner Dam | Snake River | 24 | 1905 |
| 21 | Lower Salmon Dam | Snake River | 16 | 1949 |
| 22 | Bliss Dam | Snake River | 43 | 1950 |
| 23 | C.J. Strike Dam | Snake River | 35 | 1952 |
| 24 | Swan Falls Dam | Snake River | 25 | 1901 |
| 25 | Brownlee Dam | Snake River | 128 | 1958 |
| 26 | Oxbow Dam | Snake River | 64 | 1961 |
| 27 | Hells Canyon Dam | Snake River | 98 | 1967 |
| 28 | Lower Granite | Snake River | 69 | 1975 |
| 29 | Little Goose Lock and Dam | Snake River | 69 | 1970 |
| 30 | Lower Monumental | Snake River | 69 | 1969 |
| 31 | Ice Harbor Lock and Dam | Snake River | 63 | 1962 |
| 32 | Libby Dam | Kootenay River | 129 | 1973 |
| 33 | Brilliant Dam | Kootenay River | 42 | 1944 |
| 34 | Duncan Dam | Duncan River | 40 | 1967 |
| 35 | Hungry Horse Dam | Flathead River | 172 | 1953 |
| 36 | Kerr Dam | Flathead River | 60 | 1953 |
| 37 | Noxon Rapids Dam | Clark Fork | 52 | 1960 |
| 38 | Cabinet Gorge Dam | Clark Fork | 52 | 1952 |
| 39 | Albeni Falls Dam | Pend Oreille River | 55 | 1955 |
| 40 | Boundary Dam | Pend Oreille River | 104 | 1967 |
| 41 | Seven Mile Dam | Pend Oreille River | 67 | 1979 |
| 42 | Waneta Dam | Pend Oreille River | 67 | 1954 |
| 43 | Long Lake Dam | Spokane River | 65 | 1915 |
| 44 | O'Sullivan Dam | Crab Creek | 61 | 1949 |
| 45 | Tieton Dam | Tieton River | 97 | 1925 |
| 46 | Ririe Dam | Willow Creek | 77 | 1977 |
| 47 | Salmon Falls Dam | Salmon Falls Creek | 66 | 1912 |
| 48 | Anderson Ranch Dam | Boise River | 139 | 1947 |
| 49 | Arrowrock Dam | Boise River | 107 | 1915 |
| 50 | Lucky Peak Dam | Boise River | 104 | 1955 |
| 51 | Owyhee Dam | Owyhee River | 127 | 1932 |
| 52 | Black Canyon Dam | Payette River | 56 | 1924 |
| 53 | Mason Dam | Powder River | 53 | 1968 |
| 54 | Dworshak Dam | Clearwater River | 219 | 1973 |
| 55 | Arthur R. Bowman Dam | Crooked River | 75 | 1961 |
| 56 | Round Butte Dam | Deschutes River | 134 | 1964 |
| 57 | Pelton Dam | Deschutes River | 62 | 1957 |
| 58 | Condit Dam | White Salmon River | 38 | 1913 |
| 59 | Portland No. 1 Dam | Bull Run River | 56 | 1929 |
| 60 | Hills Creek Dam | Willamette River | 104 | 1962 |
| 61 | Lookout Point Dam | Willamette River | 84 | 1953 |
| 62 | Fall Creek Dam | Willamette River | 62 | 1965 |
| 63 | Smith Dam | McKenzie River | 66 | 1962 |
| 64 | Cougar Dam | McKenzie River | 158 | 1964 |
| 65 | Blue River Dam | Blue River | 95 | 1968 |
| 66 | Green Peter Dam | Santiam River | 115 | 1968 |
| 67 | Detroit Dam | Santiam River | 141 | 1953 |
| 68 | Big Cliff Dam | Santiam River | 52 | 1953 |
| 69 | North Fork Dam | Clackamas River | 63 | 1953 |
| 70 | Swift No. 1 Dam | Lewis River | 126 | 1958 |
| 71 | Yale Dam | Lewis River | 98 | 1953 |
| 72 | Merwin Dam | Lewis River | 95 | 1931 |
| 73 | Mossyrock Dam | Cowlitz River | 112 | 1968 |
| 74 | Mayfield Dam | Cowlitz River | 61 | 1963 |
| 75 | Sediment Retention | Toutle River | 73 | 1988 |
| 76 | Willamette Falls Locks | Willamette River | 15 | 1873 |
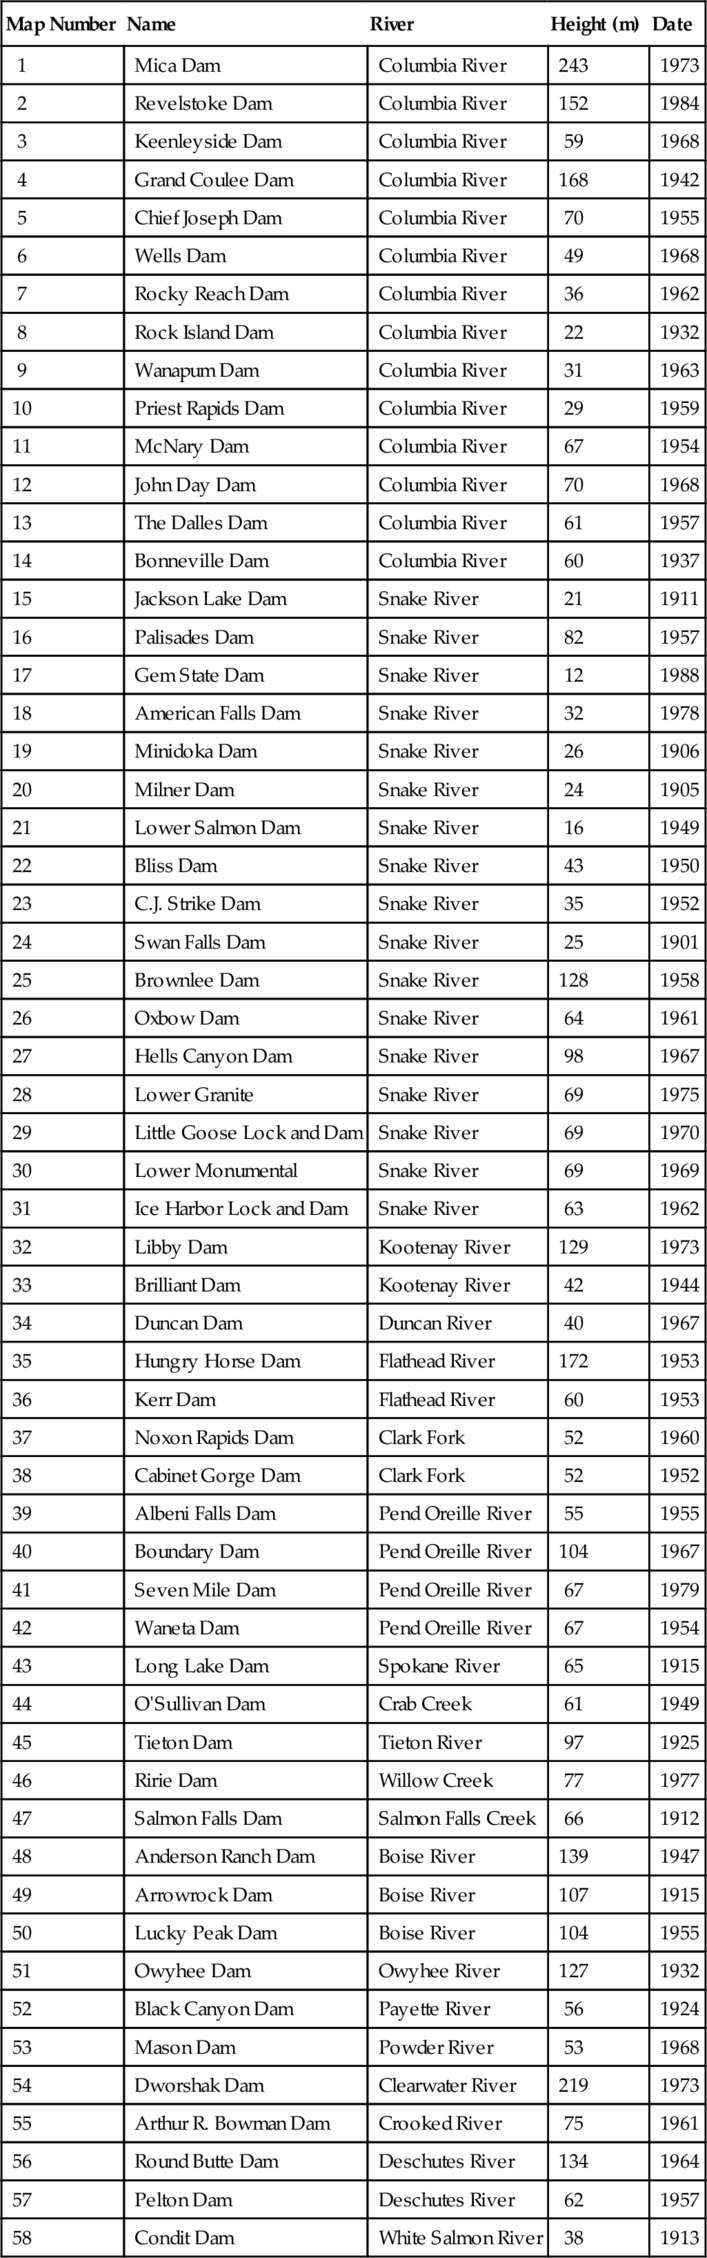
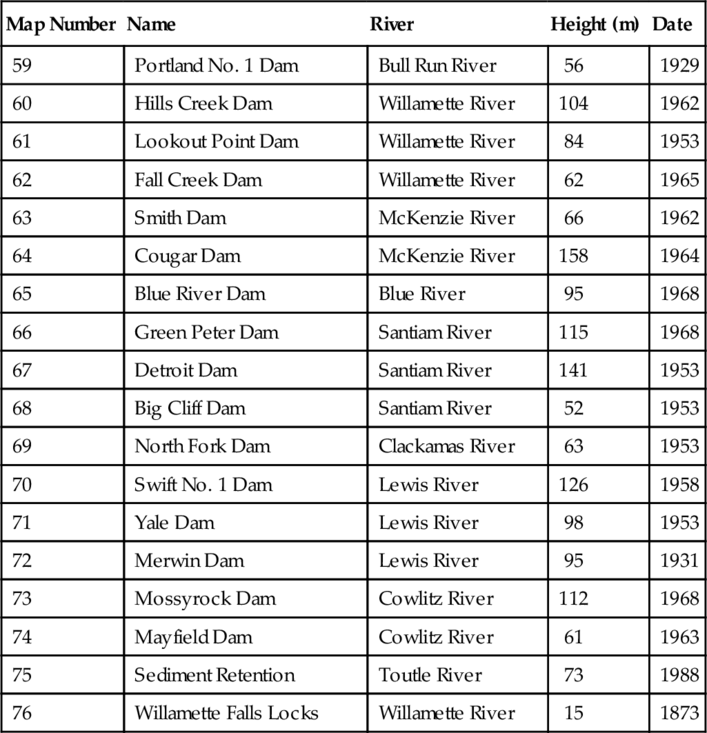
Table 10.3
Hydroelectric Generating Capacity on the Columbia River
| Dam | Capacity (MW) | Rank | Location | Date | Lake |
| Mica Dam | 1805 | 5 | British Columbia | 1973 | Kinbasket Lake |
| Revelstoke Dam | 1980 | 4 | British Columbia | 1984 | Revelstoke Lake |
| Keenleyside Dam | 185 | 14 | British Columbia | 1968 | Raised Arrow Lakes |
| Grand Coulee | 6809 | 1 | Washington | 1942 | Franklin D. Roosevelt |
| Chief Joseph Dam | 2620 | 2 | Washington | 1955 | Rufus Woods Lake |
| Wells Dam | 840 | 12 | Washington | 1967 | Lake Pateros |
| Rocky Reach Dam | 1287 | 7 | Washington | 1961 | Lake Entiat |
| Rock Island Dam | 660 | 13 | Washington | 1933 | Rock Island Pool |
| Wanapum Dam | 1038 | 9 | Washington | 1963 | Lake Wanapum |
| Priest Rapids Dam | 955 | 11 | Washington | 1961 | Priest Rapids Lake |
| McNary Dam | 980 | 10 | Washington; Oregon | 1954 | Lake Wallula |
| John Day Dam | 2160 | 3 | Washington; Oregon | 1971 | Lake Umatilla |
| The Dalles Dam | 1780 | 6 | Washington; Oregon | 1960 | Lake Celilo |
| Bonneville Dam | 1050 | 8 | Washington; Oregon | 1937 | Lake Bonneville |
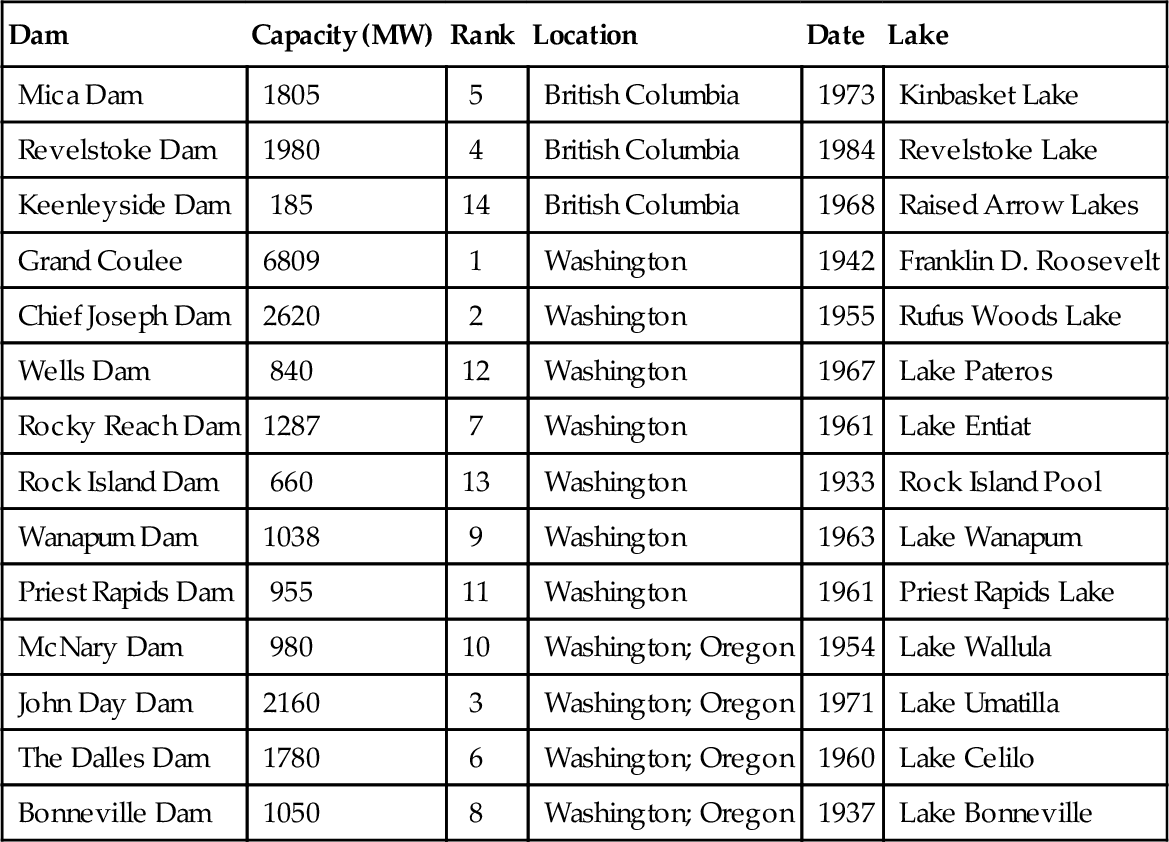
Rock Island Dam on the middle river was the first major hydroelectric power project on the Columbia. Completed in 1932, Rock Island Dam is small compared to the much larger dams that followed it. The Bonneville and Grand Coulee were built by the federal government and completed, respectively, in 1937 and 1942. The last dam built on the U.S. portion of the Columbia, the John Day Dam, came on line in 1971. In 1973 and 1984, Canada completed two large dams—the Mica and the Revelstoke—on the upper portion of the river on the Canadian side. These two dams had a generating capacity of almost 4 GW. They were built after a treaty between Canada and the United States was negotiated and signed in 1964.
Six of the dams on the Columbia create large storage reservoirs that are not only used to generate hydroelectricity, but also serve a very important flood control function and provide water for irrigation systems in agricultural projects on the Columbia Plateau in Washington. With the completion of four dams on the lower Snake River from 1962 to 1972, a series of lakes also allowed barges to navigate more than 465 miles from the Pacific Ocean to the inland port of Lewiston, Idaho (see Figure 10.3).
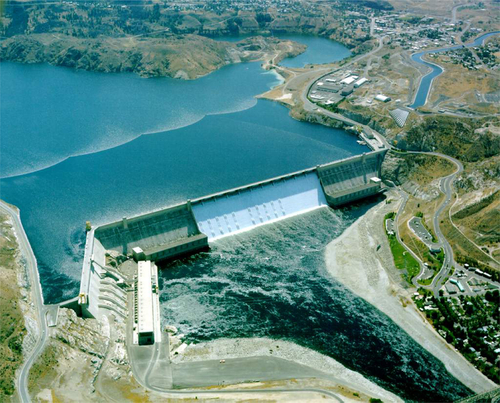
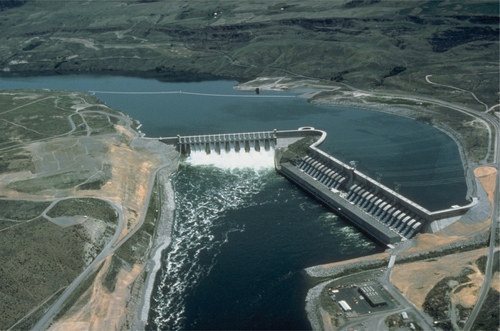
The Grand Coulee Dam
The largest dam on the river is the Grand Coulee dam and its associated Franklin D. Roosevelt Lake (Figure 10.4). This dam not only generates electricity but also plays a major role in the supply of Columbia River water to the irrigation projects on the Columbia Plateau. To support the irrigation projects, the John W. Keys III Pump-Generating Plant pumps water uphill 280 ft from the Franklin D. Roosevelt Lake to the Banks Lake. This water is then used to irrigate approximately 670,000 acres of farmland in the Columbia Basin Project. More than 60 crops are grown in the basin and distributed across the nation.
Congress authorized the Grand Coulee Dam in 1935, with its primary purpose to provide water for irrigation. When the United States entered World War II in 1941, the focus of the dam changed from irrigation to power production. In 1943, Congress authorized the Columbia Basin Project to deliver water to the farmers of the Columbia Plateau in central Washington State. Construction of the irrigation facilities began in 1948. Components of the project include the pump-generating plant, the feeder canal and the storage reservoir, which is now named Banks Lake.
Banks Lake was formed by damming the northern 27 miles of the Grand Coulee canyon and has a storage capacity of 715,000 acre-feet of water. The Banks Lake stores water for irrigation and also is used for recreational boating. The pumping plant began operation in 1951. From 1951 to 1953, six pumping units—each rated at 65,000 horsepower and with a capacity to pump 1600 ft3/s—were installed in the plant. In the early 1960s, the potential for pumped electricity storage was investigated and planned. Reversible pumps were installed to allow water from Banks Lake to flow back through the units to generate power during periods of peak demand. The first three generating pumps came online in 1973. Two more generating pumps were installed in 1983, with the final generating pump being installed in January 1984. The total generating capacity of the plant is now 314 MW. Further details on its use for pumped storage are discussed in the section on pumped storage.
It is interesting to read the stated purposes and benefits of the Grand Coulee dam, which according to the U.S. government, “… include flood control and river regulation, water storage and delivery (including irrigation), power generation, recreation, and fish and wildlife.” The Grand Coulee is the largest hydroelectric dam in the United States with a generating capacity of 6809 MW. Other details of the dam are shown in Table 10.4 in both English and SI units.
Table 10.4
Specifications of the Grand Coulee Dam
| Grand Coulee Dam | English Units | SI Units |
| Total length of dam wall (axis) | 5223 ft | 1592 m |
| Length of main dam wall | 3867 ft | 1178 m |
| Length of Forebay Dam | 1170 ft | 356 m |
| Length of Wing Dam | 186 ft | 56 m |
| Height above Bedrock | 550 ft | 167 m |
| Height above original Streambed | 401 ft | 122 m |
| Height above current river level | 345 ft | 105 m |
| Lake area | 82,300 acres | 33,306 ha |
| Lake length | 151 miles | 243 km |
| Lake Shoreline | 600 miles | 965 km |
| Active and joint use capacity | 5,185,000 acre-feet | 6,395,603,340 m3 |
| Maximum elevation above sea level | 1290 ft | 393 m |
| Total generating capacity | 6809 MW | 6809 MW |
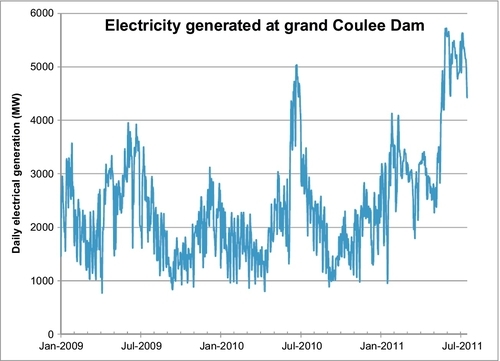
The U.S. government reports the daily height of the water in the dam as well as the water inflow and outflow estimates. The height of the water in the dam is directly related to the net inflow minus the outflow. The data for the period from January 2009 to July 2011 is shown in Figure 10.5. There is a lot of fluctuation in the daily inflow and outflow data, so Figure 10.5 shows a 30-day moving average of the net water inflow minus the outflow to and from the lake. This is calculated by taking the gross volume of water that has flowed into the lake from the river, minus the gross volume of water that has flowed out of the lake through the generating turbines to the river below. This net volume is averaged over the previous 30 days to smooth out the daily variations. Notice that in Figure 10.5 when the net water flow increases, so too does the height of the water in the dam, and vice versa.
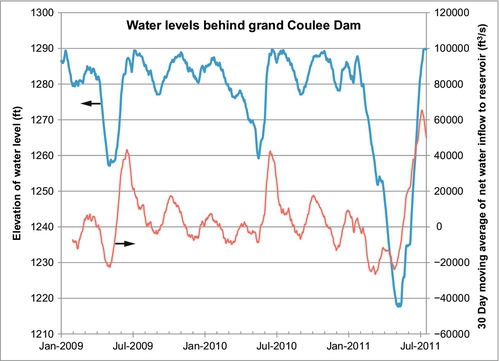
The electricity generated by the dam can be calculated from the water height (shown in Figure 10.5) relative to the river below as well as the discharge volumes, using Equation 10.1. To calculate the power output, you need to first estimate the turbine efficiencies, which turn out to be 87%. This number can be obtained by matching the maximum turbine capacity [reported to be 6809 MW and calculated using the maximum head height of 105.2 m (345 ft)] and the maximum reported volumetric discharge of 7592 m3/s. The maximum water height is assumed to be 345 ft above the river below, as shown in Table 10.4. This corresponds to a water elevation of 1290 ft above sea level for the water in the dam. From these values, you can then calculate the electricity generated on any day at Grand Coulee dam. As an example, on July 17, 2011, the water level was at the maximum 1290 ft above sea level corresponding to a water head height (h) of 345 ft above the discharge water level. The average volumetric flow-rate of water discharged on that day was 174,000 ft3/s. Converting these numbers to SI units gives h = 105.2 m and V = 4927 m3/s. The power output that day was
![]()
![]()
The net power generated each day since January 1, 2009 is shown plotted in Figure 10.6. From January 1, 2009 to July 17, 2011, 53.97 TWh of electricity was generated. This represents about 36% of the total capacity and is typical for a hydroelectric operation.
The Other Columbia River Dams
The 11 hydroelectric generating dams in the U.S. portion of the river are shown in Figure 10.8. Five of these dams (and another three on the Snake River) are “run-of-the-river” dams, so called because they have only a small capacity reservoir. Consequently, the water coming from the upstream must be used for generation at the moment it is received or must be allowed to bypass the dam. These dams usually generate electricity constantly. The other dams can be turned on and off as the electricity demand changes. The biggest of these run-of-the-river dams is the Chief Joseph Dam (see Figures 10.7 and 10.8), which has a generating capacity of 2620 MW and is located immediately below the Grand Coulee Dam. The others are the four lowest level dams: the McNary, the John Day, the Dalles, and the Bonneville.
The Columbia River dams have altered the migration of the previously strong anadromous fish populations (fish that migrate between freshwater rivers and saltwater oceans) in the river. This has led to significant declines in the numbers of these fish. Prior to the construction of the dams, commercial fishing operations had harvested millions of pounds of fish each year, especially salmon. The largest portion of the harvest came from the lower river and the estuary by the ocean. Since then, the combined effects of dams, increased ocean fishing, deterioration of the river habitats and changing river conditions have made the Columbia less and less habitable for the anadromous fish.
Ever since the early 1970s, the fish catch has continuously declined, with hatchery-raised species now making up more than 80% of commercially caught salmon in the river. Fish hatcheries began operation in the basin in 1877 and helped mitigate the dam-caused salmon declines. Nevertheless, some species of salmon have now been listed as endangered. In order for fish to migrate up the river, the dams on the lower river have fish ladders that allow the migrating fish to bypass the dams and continue up the river to their spawning grounds. These fish ladders are chutes that the fish can swim up to reach the water above the dam. The Chief Joseph Dam (see Figure 10.7)—which is located on the middle reaches of the river just below the Grand Coulee Dam, as well as the Grand Coulee Dam—have no fish ladders, which blocks fish migration to the upper half of the Columbia River system.
Despite the barriers that the dams ostensibly cause, navigation of the Columbia as a shipping channel has actually been enhanced by the changes to the river. Previously, large commercial ships could not travel very far up-river. Because of the dredging of a deep channel in the lower river—which was deepened to 40 ft in 1976—and the deep man-made lakes on the middle river, ocean-going freighters can navigate up the Columbia to Portland, Oregon, and Vancouver, Washington (not to be confused with the Canadian city of Vancouver, British Columbia). Barges can also transport goods from there to the interior. Towboats pull the barges up through locks on the Bonneville, the Dalles, John Day, McNary and on four Snake River dams carrying fuel and other commodities upriver and returning with wood chips, lumber and agricultural products downriver.
In the nineteenth century, before any dams were built, agricultural projects began to use water from the Columbia River. By the 1920s, major irrigation projects along the Columbia and its tributaries such as the Yakima, Wenatchee and Umatilla rivers operated with the benefit of federal assistance. During the 1930s and 1940s, however, the construction of the big dams, especially the Grand Coulee Dam on the upper river and the McNary Dam on the middle river, greatly increased irrigated agriculture on the Columbia Plateau. In 1948, the Columbia Basin Project began transporting Columbia River water by canal to more than 670 thousand acres on farms in central Washington. This project required large pumping stations, a network of canals and large sprinkler systems. There were more than 60 major irrigated crops including alfalfa, potatoes, mint, beets, beans, orchard fruit and grapes.
Recreation on the Columbia, which includes sailing, swimming, water skiing, canoeing and other water sports have become commonplace on the river since World War II. This was made more feasible by the creation of the lakes that resulted from the building of the dams. More recently, sailboarding and windsurfing have also become popular. In 1986, Congress passed the Columbia River Gorge National Scenic Area Act, which mandates environmental protection of the Columbia River Gorge through cooperation among federal, state, municipal and county governments in the Gorge.
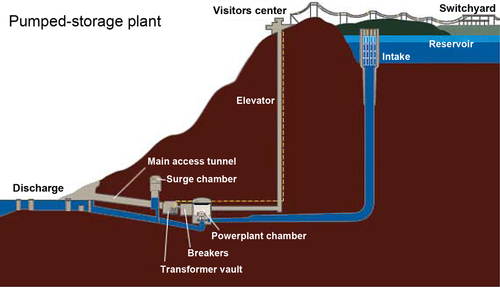
Pumped Hydroelectric Storage
Pumped storage is a variation on hydroelectric power generation, which can be used to store energy, especially electricity. The procedure is to store energy by pumping water from a lower elevation reservoir to a higher elevation reservoir. When the energy is needed, the higher elevation reservoir water can be run through a hydroelectric turbine to generate electricity. The turbine is designed to operate as the pump during the water storage operation. The method so far has mainly been used to store or buy electricity at lower off-peak rates and then generate electricity for use or sale at higher peak rates. Some energy (10-15%) is lost in the process to friction, so pumped storage actually consumes energy. Overall, it makes money and allows power utilities to balance the electrical demand. It also has the potential to be expanded to include wind and solar energy projects to balance the load when the wind is not blowing or the sun is not shining.
In 2008, the world pumped storage-generating capacity was 104 GW. The European Union (EU) had 38.3 GW of pumped storage capacity (36.8% of world capacity) out of a total of 140 GW of hydropower, which represented 5% of the total net electrical capacity in the EU. In 2009, the United States had 21.5 GW of pumped storage-generating capacity (20.6% of world capacity) accounting for 2.5% of the net electrical generating capacity.
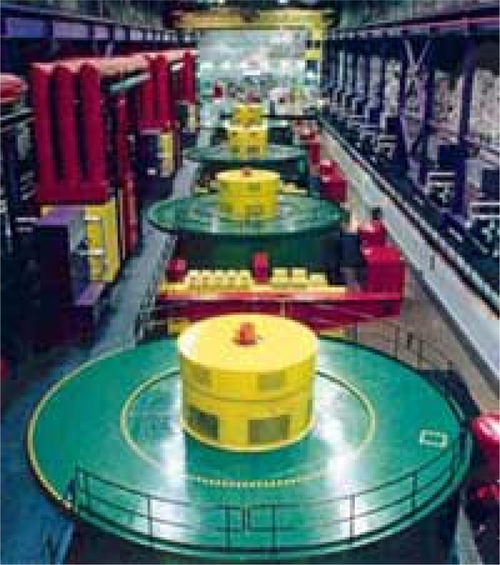
One example of a pumped storage plant in the United States is the Raccoon Mountain Pumped-Storage Plant in Marion County, Tennessee, 6 miles west of Chattanooga. It is owned and operated by the Tennessee Valley Authority (TVA) and has been in operation since 1978. It cost $300 million to build. Water is pumped from the Nickajack Reservoir on the Tennessee River to a storage reservoir at the top of Raccoon Mountain (see Figures 10.9, 10.10, and 10.11). The storage reservoir on top of the mountain covers an area of 528 acres and was created by a dam wall that is 230 ft high and 8500 ft long and curves around the contours of the mountain to contain the water. It takes 28 h to fill the upper reservoir and 22 h to drain it. During periods of high-electric demand, water is released from the reservoir through a tunnel drilled through the mountain, driving four 383 MW electric generators (a total of 1532 MW; see Figure 10.12) in the same tunnel inside the mountain. It is used almost every day to balance the electrical load in the TVA system.
The largest-capacity pumped-storage power station in the world (and in the United States) is the Bath County Pumped Storage Station in Virginia, with a generating capacity of 2772 MW. The pump-turbine system is composed of six 462-MW units manufactured by the Allis-Chalmers Manufacturing Company. The two reservoirs are separated by 1263 ft (385 m) in elevation. It cost $1.6 billion to build and went into operation in 1985. The upper reservoir is 265 acres (110 ha) in area, and the lower reservoir is 555 acres (220 ha). The upper reservoir can discharge water to the hydroelectric generators at the maximum rate of 852 m3/s. During operations, the water level can fluctuate by 105 ft (32 m) in the upper reservoir and 60 ft (18 m) in the lower reservoir. The generating efficiency in this system has not been reported but, using the methods shown previously in the Grand Coulee Dam section, it can be calculated as 86.1%. Other pertinent details of the plant are
Owners: Dominion (60%) and Allegheny Power (40%)
Lower Reservoir Dam
• 2400 ft long (732 m)
• Contains 4 million cubic yards (3.1 million cubic meters) of earth and rock fill
Lower Reservoir
• 555 surface acres (2.25 km2)
• Water level fluctuates 60 ft (18 m) during operations
Upper Reservoir Dam
• 2200 ft long (671 m)
• Contains 18 million cubic yards (13.8 million cubic meters) of earth and rock fill
Upper Reservoir
• 265 surface acres (1.07 km2)
• Water level fluctuates 105 ft (32 m) during operations
Water flow—Pumping: 12.7 million gallons/minute (801 m3/s)
Water flow—Generating: 13.5 million gallons/minute (852 m3/s)
Turbine generators: Six Francis-type 462-MW units manufactured by Allis-Chalmers
Maximum pumping power (per unit): 642,800 horsepower (479,300 kW)
Using these numbers, the generating capacity of the system can be verified using Equation 10.1.
![]()
![]()
At the end of the generating cycle, when the water level in the upper reservoir has been lowered by 32 m and the water level in the lower reservoir has been raised by 18 m, the height difference between the two reservoirs has been reduced to 335 m. The water flow-rate has also been reduced to 740 m3/s. The generating capacity becomes
![]()
There is a smaller pumped storage facility on the Columbia River associated with the Grand Coulee Dam. The John W. Keys III Pump-Generating Plant pumps water 280 ft uphill from the Franklin D. Roosevelt Lake to the Banks Lake. This water is used to irrigate farmland in the Columbia Basin Project. Construction of the irrigation facilities began in 1948. Components of the project include the pump-generating plant, feeder canal and the Banks Lake equalizing reservoir.
Banks Lake was formed by damming the northern 27 miles of the Grand Coulee canyon and has an active storage capacity of 715,000 acre-feet of water. The plant was originally designed just as a pumping operation and began to pump water for irrigation in 1951. From 1951 to 1953, six pumping units were installed in the plant to pump the water to the upper reservoir. Each pump was rated at 65,000 horsepower and with a capacity to pump 1600 ft3/s. In the early 1960s, it was decided that this arrangement had the potential for pumped power storage. Reversible Francis-type pump-generators were installed to allow water from Banks Lake to flow back through the units to generate power during periods of peak demand. The total generating capacity of the pumped storage plant is now 314 MW.
Summary
Hydroelectric power generates a clean, renewable and reliable energy supply. According to a March 2007 report released by the Electric Power Research Institute (EPRI), there is 90 GW of untapped hydroelectric power generation potential in the United States. According to EPRI, this could produce enough energy to serve the needs of 22 cities the size of Washington, D.C. and equates to over 250 million tons of potential reductions in greenhouse gas emissions per year that is currently unrealized. EPRI reports that, by the year 2025, the United States also has the potential to develop 10 GW (or 11% of the total above) from new, small hydro capacity gains at existing hydro sites and new generating facilities at existing dams.
The U.S. Hydropower Association website states that the industry could install 60 GW of new capacity by 2025, which is only 15% of the total untapped hydropower resource potential in the United States, meaning that the Hydropower Association has identified 400 GW of additional hydropower potential. At 36% capacity, this 400 GW of additional capacity could generate an additional 1250 TWh of clean renewable electricity per year, 40% of the U.S. demand. EPRI only considers developing 90 GW of this potential because it is better to leave some rivers wild to maintain some diversity in the ecosystems.
Developing this hydroelectric potential has the following added benefits as stated by the U.S. Department of the Interior for the Grand Coulee Dam: “… flood control and river regulation, water storage and delivery (including irrigation), power generation, recreation, and fish and wildlife development.” Flood control is an important benefit of hydroelectric dams. In the summer of 2011, many communities along many rivers in the United States (including the Mississippi, Missouri, and Red Rivers) were flooded, creating significant dislocation. Prior to the building of the three Gorges Dam on the Yangtze River in China, millions of people lost their lives when they drowned in floods that occurred periodically on the river. The Three Gorges Dam certainly had an impact in the areas behind the dam and the whole ecology of the river was changed, but the lives that it saves every year and the electricity that it generates makes it worthwhile. There is still plenty of further potential for this in the United States and around the world.