Configuring BI Components
The MOSS BI offering is based on four components that are used to gather and present information. These components are then combined using the Office BI connectors, the dashboard features, and the filter Web Parts to aggregate the BI information so that it is relevant for users. The four building blocks of Office System BI are
Excel Services
KPIs
Reporting Services and the Report Center site template
BDC
Using Excel Services to create BI
Excel Services provide a very key component of Office System BI because they allow you to reuse the spreadsheet assets that exist in your organization and use tools that are familiar to your users. Excel Services provide not only the capability to publish Excel spreadsheets to the Web but also the functionality users need to do calculations within the Web Parts for incredibly efficient data collaboration and data sharing.
Cross-Ref
For more information on configuring Excel Services for your environment, see Chapter 9.
Publishing spreadsheets with parameters
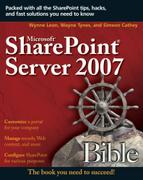
If you would like to enable input or filtering parameters to your published Excel spreadsheets, you need to configure named cells for those spreadsheets and then identify those parameters when you publish the spreadsheet. This allows you to provide filter or parameter values to the spreadsheet from connected Web Parts on a page. For example, in the dashboard shown in Figure 14.1, users have the ability to enter a bill rate as a parameter for the standard Phase 1 proposal shown in the Excel Web access Web Part so that it will recalculate the proposal estimate. This value has also been connected as a filter to find the consultants that match the entered bill rate in the SharePoint contact list.
Figure 14.1. Using a Published parameter to change an Excel Web Access calculation

Another example would be to filter a pivot chart based on an AS cube. By naming the filter parameter within Excel and publishing it with Excel Services, the pivot table can be connected to the AS filter and the pivot table will update when a filter parameter is selected in the AS filter Web Part. In Figure 14.2, the AS filter is connected to both the Excel Web Access Web Part and the KPI that is also based on that cube.
Figure 14.2. Using an Analysis Services filter to filter the data returned in an Excel Web Access Web Part and KPI

To identify a cell within Excel as a parameter field and publish using Excel Services, follow these steps:
1. | Open your Excel spreadsheet and left-click the cell that contains the value that will be your parameter or filter. |
2. | In the cell above the top-left column and to the left of the function button, type the name of your parameter cell. In Figure 14.3, we have selected cell B1, which contains the Default Bill Rate value and entered “BillRate” as the cell name. Press Enter. Figure 14.3. Naming a cell for use as a parameter
|
3. | If you are publishing a simple Excel spreadsheet (as opposed to a pivot table or table), select the cells for your Excel calculations, then right-click and select Name a Range. Enter a name for your Excel functionality in the Name field and click OK to exit the New Name dialog box. If you are publishing a pivot table or table, this step is not necessary. |
4. | From the mail Excel menu, select Publish
|
5. | Enter the URL and file name for your spreadsheet in the File name field, or browse for the site in the Save in field and type the file name in the File name field. |
6. | Click Excel Services Options. |
7. | In the Show tab, select Items in the Workbook from the drop-down menu and select all Named Ranges, all Pivot Tables, and all Tables. These options will vary based on the type of your spreadsheet, but confirm that you have at least selected All Named Ranges as shown in Figure 14.4. |
8. | Click the Parameters tab. |
9. | Click Add. |
10. | Select the check box next to your named cell, as shown in Figure 14.5. Figure 14.5. Selecting the parameter name and cell reference
|
11. | Click OK to exit the Add Parameters dialog box. |
12. | Click OK to exit the Excel Services Options. |
13. | Click Save to publish the file to your SharePoint site. |


Using the Excel Web Access Web Part
The Excel Web Access Web Part is a key component of a business intelligence solution. This Web Part allows you to provide spreadsheet information in a Web Part by using Excel calculation services. The user can then pivot or filter or create calculations on the data without affecting the underlying data source. The Excel Web Access Web Part can be linked to either an Excel 2007 spreadsheet or data from SQL Server 2005 Analysis Services.
After you have published a file like the simple one used in the publishing a parameter steps earlier, you can open that file from your document library and view the Excel functionality in full screen mode. You can then enter and apply parameters as shown in Figure 14.6.

You can also use the Excel Web Access Web Part to embed it on a page. To configure the Excel Web Access Web Part, follow these steps:
1. | Browse to the dashboard or Web Part page to which you want to add the Excel Web Access Web Part and select Edit Page from the Site Actions menu in the top right corner. |
2. | If you do not already have the Web Part on your page, click Add a Web Part in the zone that you want the Excel Web Access Web Part, select Excel Web Access from the Web Part list, and click Add. |
3. | From the edit menu in the top right corner of your Excel Web Access Web Part, select Modify Shared Web Part. |
4. | In the Workbook field, enter or browse to the URL of your published file. |
5. | If you have more than one named range or a particular named ranged that you want to display, enter the name in the Named Item field as shown in Figure 14.7. Figure 14.7. Configuring the Excel Web Access Web Part
|
6. | Enter the appropriate number of rows and columns to include. |
7. | Select whether you want to display the parameters task pane in the Interactivity section if you have parameters. You may want to hide these parameters if you will be connecting them to filters. |
8. | Click OK. |

If you would like to connect this Web Part to a filer, see the steps for configuring filters in the Adding Filters to Your Dashboard section of this chapter.
Selecting Key Performance Indicators
Key Performance Indicator (KPI) list templates help display key performance information for your organization in a manner that drives actions. KPIs are configured to represent the progress of the organization or team in a meaningful way so that it focuses the team on the right actions and goals. To do this, KPIs aggregate data that resides in locations throughout the company so that the KPIs provide a view of trend information from that data source. Multiple indicators are combined in a single list so that at a glance, users see the high-level information that they need.
KPIs are intended to help organizations quantify and communicate goals using existing data sources. This process should increase the business performance and cohesiveness of the organization by keeping goals focused and measured. KPI lists can be based on four data sources:
SharePoint lists: If you have a list that tracks key organizational activity, the KPIs can be created from views of that list. In addition, this list can include BDC columns or SQL Server 2005 columns.
Excel workbooks: If you are tracking KPIs in an Excel workbook, SharePoint can create KPI lists from that workbook.
SQL Server 2005 Analysis Services: KPI lists can be based on AS cubes that use registered connections in the data connection library. KPIs that are based on AS cubes can also be filtered by the AS filter Web Part as shown in the Adding the SQL Server 2005 Analysis Services filter section below.
Directly entered KPI data: The KPI lists allow you to enter KPI names, expected values, and current values and displays the status based on these entries. This is an acceptable approach if you do not have the data stored elsewhere because the data will not be synchronized with another source.
Note
KPIs can be targeted to audiences and filtered to show the KPIs only for that audience. In this fashion, they can be useful on personalization pages although they will show data for the user’s audience (such as sales for region targeted by audience) instead of current user. The logic behind this is that KPIs are not usually oriented by person, but instead by attributes that are audience specific.
Cross-Ref
Chapter 16 discusses planning and implementing KPIs in detail. See that chapter for more information on how to select and configure your KPIs.
Using Reporting Services and the Report Center
The Report Center template provided with MOSS 2007 provides a collaboration and publishing location for reports and metrics. The Report Center combines the capabilities for providing status and trend information by using KPIs with the dashboard capability for combining Web Parts into a page so that related information from a variety of sources give users a full view.
The Report Center site template provided with MOSS 2007 can be customized to support KPIs, dashboards, Excel Web Access Web Parts, and reports, thus creating a site that supports business intelligence.
Cross-Ref
For more information about using and configuring the Report Center, see Chapter 15.
Using BDC content sources
The Business Data Catalog (BDC) enables you to reuse other sources of data in your organization. It is a shared service that allows you to centrally surface business data from other applications in your organization, and make that data available to MOSS lists, Web Parts, search, and user profiles.
You can use the BDC to display data from Siebel, SAP, or other applications through Web services or database access. The most common sources for BDC data are line-of-business applications so that you can reuse that information throughout the organization without giving all users access and/or training on that line-of-business application.
The BDC is designed to surface this data with minimal coding effort. With that said, to define the entity, you need to have a database developer that can map the business application to the metadata model BDC provides.
Cross-Ref
For more information about using and configuring the Business Data Catalog, see Chapter 17.