Implementing KPIs from Analysis Services
KPIs can also be created from data in SQL Server 2005 Analysis Services. In this scenario, Analysis Services has done all the work to analyze the data and create the KPI within its own framework, and SharePoint creates an indicator from the data as it is presented. The values of the goal, the warning, and the indicator itself are all defined in Analysis Services, as shown in Figure 16.15, so there are not many options that you need to configure at the SharePoint level other than selecting which indicators to display on your KPI list. Indicators created from Analysis Services are the only ones that can show trends because this information is processed by Analysis Services.

Creating an Office data connection to your Analysis Services cube
The first step in creating an indicator from SQL Server Analysis Services is to configure the connection to the cube for the KPI to use. You do this by using Excel 2007 to create the Office Data Connection (ODC) file and then uploading that to a data connection library. By storing your ODC files in a data connection library, you enable user access to those data sources without having to know all the details about server, database, and security settings. You can, however, use Windows security for the connection so that the user’s credentials are necessary for access to the data.
To create an ODC to your Analysis Services cube, follow these steps.
1. | Open Excel 2007 and select the Data tab. |
2. | Select From Analysis Services in the From Other Sources menu in the Get External Data section. |
3. | Enter the server name and connection credentials on the Connect to Database Server page of the Data Connection Wizard, as shown in Figure 16.16. Click Next. Figure 16.16. Using the Data Connection Wizard to connect to your Analysis Services server
|
4. | Select the database and cube that contains your KPIs in the Select Database and Table page of the Data Connection Wizard, as shown in Figure 16.17. Click Next. Figure 16.17. Selecting your Analysis Services cube in the Data Connection Wizard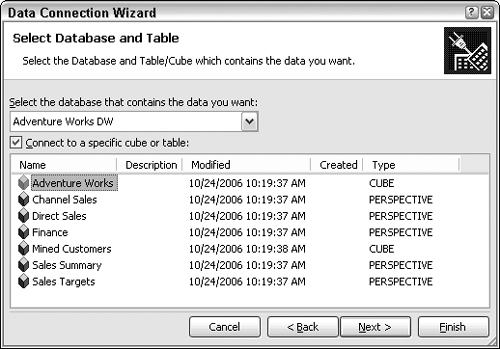
|
5. | Enter the filename and description for your ODC file as shown in Figure 16.18. The description should be used to let users know the details of the connection so that they can accurately pick the connection that meets their needs. If you do not select a filename location by using the browse button, the file will be saved to your [My Data Sources] folder under [My Documents]. Click Finish. |
6. | In the Import Data prompt that appears when you finish, select Only Create Connection as shown in Figure 16.19. Figure 16.19. Creating a connection file using Excel 2007
|
7. | Using a browser, navigate to the Data Connection Library in which you want to store the ODC file. This will most likely be in the Report Center for your site collection. |
8. | Select Upload from the top navigation bar as shown in Figure 16.20, browse to or enter the location of your ODC file, and select OK. Figure 16.20. Uploading the ODC file to the SharePoint Data Connection Library
|
9. | Provide a description for the ODC file so users know to what cube they will be connecting and select Check in. |


Creating an indicator from data in SQL Server 2005 Analysis Services
You can create an indicator from data in SQL Server 2005 Analysis Services. Follow these steps:
1. | Navigate to the KPI list to which you would like to add the manual indicator. If you do not already have a KPI list, follow these steps:
|
2. | Select Indicator using data in SQL Server 2005 Analysis Services from the New menu. |
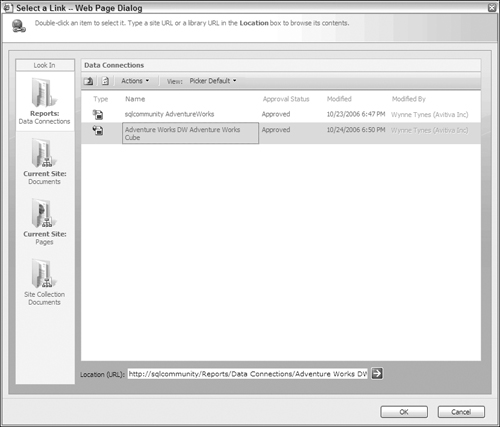
3. | Select the ODC in a data connection library in the Data Connection field as shown in Figure 16.21 and click OK. |
4. | Filter by KPI folder and select the appropriate KPI list in the SQL Server Analysis Services KPI section. Select whether you would like any defined child indicators included in the KPI, as shown in Figure 16.22. Note If you add a parent indicator and select that you would like to include the child indicators, it would be redundant to add the child indicators as their own KPI entries. |
5. | Enter the name of the indicator in the Name field and the comments to help explain the value or status. |
6. | Enter the details page in the Details Link section for drilling down on the indicator. If no page is entered, a default details page appears when the user clicks. If no page is entered, a default details page showing all the properties including description and comments appears when the user clicks the item. Ideally, the details link should direct users to the location where they can take action to update the information driving the KPI, such as the application that pushes the data to the Analysis Services cube. |
7. | Click in the Update Rules section whether you want the indicator to be recalculated every time it is viewed or when the update value link is clicked, as shown in Figure 16.23. |
8. | Click OK. |