
In this chapter, you will learn about. . .
Supply Chains
The Management of Supply Chains
"Green" Supply Chains
Information Technology: A Supply Chain Enabler
Supply Chain Integration
Supply Chain Management (SCM) Software
Measuring Supply Chain Performance

Web resources for this chapter include
Animated Demo Problems
Internet Exercises
Online Practice Quizzes
Lecture Slides in PowerPoint
Virtual Tours
Company and Resource Weblinks
www.wiley.com/college/russell
As an example of its commitment to sustainability, Mars supports good farming practices in cocoa-growing regions and equitable labor practices along the cocoa supply chain, which places it as an industry leader in the pursuit of socially responsible cocoa production. Mars is one of the world's largest users of cocoa, which is the primary agricultural export of West African countries like Cote d'Ivoire, Ghana, Nigeria, and Cameroon. It is estimated that throughout West Africa there are more than 2 million small cocoa farms and those affected by cocoa farming may be as many as 10 million people. Aging trees, outdated farming techniques, and plant disease diminish annual crop yields by as much as 35%. Overcoming these problems is essential to the economic sustainability of this region, and sustaining a critical part of Mars' supply chain. Mars is addressing these problems by engaging in research projects in pest management techniques and breeding disease-resistant cocoa trees. Mars is a founding member of the World Cocoa Foundation and partners with them to deliver practical farming knowledge directly to farmers, including the Sustainable Tree Crops Program in West Africa. Mars was a key signatory to the Harkin-Engel protocol that brings together national governments and the global cocoa and chocolate industry to improve working conditions and labor practices on cocoa farms along the cocoa supply chain.
Mars was the first global chocolate company to commit to certifying its entire cocoa supply as being produced in a sustainable manner by 2020. It has committed to source 100,000 tons of Rainforest Alliance-certified cocoa by 2020, and has contracted the first UTZ certified cocoa beans. UTZ is a global certification program that has developed a meaningful, practical, and inclusive code of conduct that reflects minimum requirements for sustainable global cocoa production.
In this chapter we will learn about supply chains and the key role supply chain management plays in successfully integrating a company like Mars' different operations management functions and processes.
Source: Mars, Incorporated, www.mars.com
Globalization and the evolution of information technology have provided the catalysts for supply chain management to become the strategic means for companies to manage quality, satisfy customers, and remain competitive. A supply chain encompasses all activities associated with the flow and transformation of goods and services from the raw materials stage to the end user (customer), as well as the associated information flows. In essence, it is all the assets, information, and processes that provide "supply." It is made up of many interrelated members, starting with raw material suppliers, and including parts and components suppliers, subassembly suppliers, the product or service producer, and distributors, and ending with the end-use customer.
• Supply chain: the facilities, functions, and activities involved in producing and delivering a product or service from suppliers (and their suppliers) to customers (and their customers).
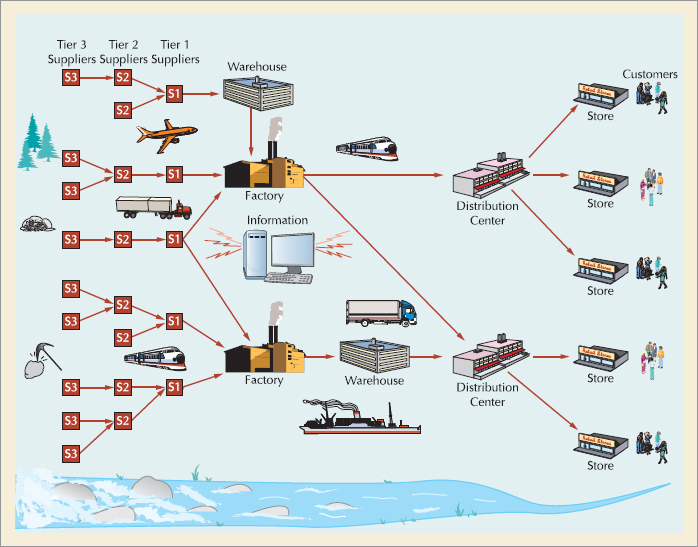
Figure 10.1 illustrates the stages, facilities, and physical movement of products and services in a supply chain. The supply chain begins with suppliers, which can be as basic as raw material providers. These suppliers are referred to as upstream supply chain members, while the distributors, warehouses, and eventual end-use customers are referred to as downstream supply chain members. The stream at the bottom of the figure denotes the flow of goods and services (i.e., demand) as the supply chain moves downstream. Notice that the stream is very rough at the up-stream end and gets smoother as it moves downstream, a characteristic we will discuss in greater detail later. Also note that "information" is at the center of Figure 10.1; it is the "heart and brains" of the supply chain, another characteristic we will talk more about later.
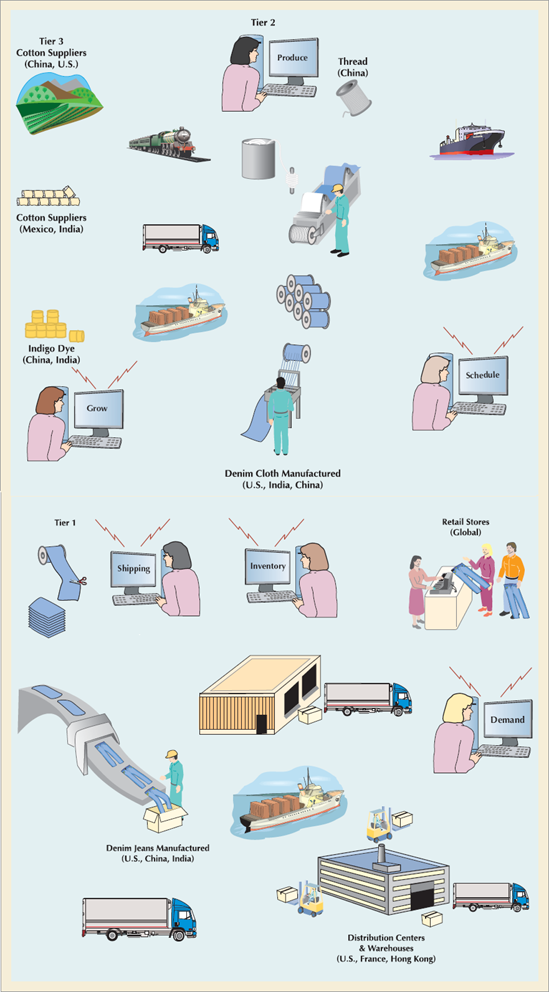
The supply chain in Figure 10.1 can represent a single producer directly linked to one level of suppliers and one set of end-use customers. A grocery store that gets food products like milk, eggs, or vegetables directly from a farmer (and not through a distributor), and sells them directly to the customer who consumes them reflects this basic level of supply chain. However, supply chains are more typically a series of linked suppliers and customers; every customer is in turn a supplier to the next, up to the final end user of the product or service. For example, Figure 10.2 shows the supply chain for denim jeans, a straightforward manufacturing process with a distinct set of suppliers. Notice that the jeans manufacturer has suppliers that produce denim who in turn have suppliers who produce cotton and dye.
As Figures 10.1 and 10.2 show, the delivery of a product or service to a customer is a complex process, encompassing many different interrelated processes and activities. First, demand for a product or service is forecast, and plans and schedules are made to meet demand within a time frame. The product or service can require multiple suppliers (who have their own suppliers) who prepare and then ship parts and materials to manufacturing or service sites. A large manufacturer like General Electric or Hewlett-Packard, has thousands of suppliers including first-tier suppliers that supply it directly, second-tier suppliers that supply those suppliers, third-tier suppliers that supply second-tier suppliers, and so on. Parts and materials are transformed into final products or services. These products may then be stored at a distribution center or warehouse. Finally, these products are transported by carriers to external or internal customers. However, this may not be the final step at all, as these customers may transform the product or service further and ship it on to their customers. All of this is part of the supply chain—that is, the flow of goods and services from the materials stage to the end user.
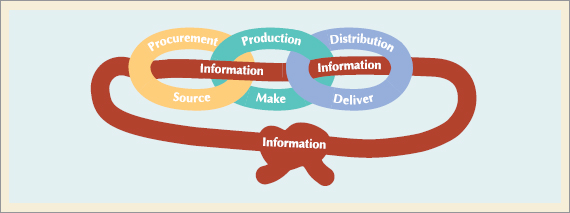
The supply chain is also an integrated group of processes to "source," "make," and "deliver" products.
The supply chain is also an integrated group of business processes and activities with the same goal—providing customer satisfaction. As shown in Figure 10.3, these processes include the production of the products and components from suppliers; production of the products and services; and distribution of products to the customer including taking and filling orders. Information and information technology tie these processes together; it is what "integrates" them into a supply chain.
•procurement: purchasing goods and services from suppliers.
Supply chains for services are sometimes not as easily defined as supply chains for manufacturing operations. Since the supply chain of a service provider does not always provide the customer with a physical good, its supply chain does not focus as much on the flow of physical items (material, parts, and subassemblies) through the supply chain. It instead may focus more on the human resources and support services necessary to provide its own service. The supply chain of a service provider also tends to be more compact and less extended than a manufacturing supply chain. It generally does not have as many tiers of suppliers, and its distribution network is smaller or nonexistent. However, supply chains of service companies are definable and can be effectively managed using many of the same principles. Service companies and organizations have suppliers (who have suppliers), and they distribute their products to customers (who may have their own customers). Although a hospital and HMO do not provide actual goods to its customers, they nevertheless purchase equipment, computers, drugs, and medical supplies from suppliers (who have suppliers). They also contract for services (such as food preparation or laundry); hire doctors, nurses, accountants, administrators, and staff; and provide health care. They have quality-management issues throughout their supply chain. They also encounter the same problems and inefficiencies as a manufacturing-based supply chain. Other service-oriented companies, like McDonald's, do, in fact, provide a physical product, and thus have a more discernible supply chain with distribution, transportation and inventory like a manufacturing company.
In recent years, terms such as value chain and demand chain have been used instead of, or interchangeably with, supply chain. Are there any differences between the two terms? Originally, a value chain was thought to have a broader focus than a supply chain. A value chain included every step from raw materials to the eventual end user, whereas a supply chain focused more narrowly on the activities that get raw materials and subassemblies into the manufacturing operation, that is, supply. In this context, the ultimate goal of a value chain is the delivery of maximum value to the end user. However, we have already indicated that the general perception of a supply chain is that it also encompasses this same broad focus, from raw material to end user. Alternatively, a demand chain has been referred to as a network of trading partners that extends from manufacturers to end-use consumers. The objective of demand chain management is to increase value for any part or all of the chain. This perhaps is a somewhat more narrowly defined perspective then a supply chain or value chain. However, in reality all of these terms have come to mean approximately the same thing to most people, and the terms are frequently used interchangeably.
•Value: the creation of value for the customer is an important aspect of supply chain management.
A common thread among these perceptions of supply, value, and demand chains is that of value. Value to the customer is good quality, a fair price, and fast and accurate delivery. To achieve value for the customer, the members of the supply chain must act as partners to systematically create value at every stage of the supply chain. Thus, companies not only look for ways to create value internally in their own production processes, but they also look to their supply chain partners to create value by improving product design and quality, enhancing supply chain performance and speed, and lowering costs. To accomplish these value enhancers, supply chain members must often collaborate with each other and integrate their processes, topics that we will continually return to in this chapter.
Supply chain management (SCM) focuses on integrating and managing the flow of goods and services and information through the supply chain in order to make it responsive to customer needs while lowering total costs. Traditionally, each segment of the supply chain was managed as a separate (stand-alone) entity focused on its own goals. However, to compete in today's global marketplace a company has to count on the combined and coordinated effort of all members of the supply chain.
•Supply chain management (SCM): requires managing the flow of information through the supply chain in order to attain the level of synchronization that will make it more responsive to customer needs while lowering costs.
Supply chains require close collaboration, cooperation, and communication among members to be effective. Suppliers, and their customers must share information. It is the rapid flow of information among customers, suppliers, distributors, and producers that characterizes today's supply chain management. Suppliers and customers must also have the same goals. They need to be able to trust each other: Customers need to be able to count on the quality and timeliness of the products and services of their suppliers. Furthermore, suppliers and customers must participate together in the design of the supply chain to achieve their shared goals and to facilitate communication and the flow of information.
Keys to effective supply chain management are information, communication, cooperation, and trust.
One of a company's main objectives in managing its supply chain is to synchronize the upstream flow of incoming materials, parts, subassemblies, and services with production and distribution downstream so that it can respond to uncertainty in customer demand without creating costly excess inventory. Examples of factors that contribute to uncertainty, and hence variability, in the supply chain are inaccurate demand forecasting, long variable lead times for orders, late deliveries, incomplete shipments, product changes, batch ordering, price fluctuations and discounts, and inflated orders. The primary negative effects of supply chain uncertainty and variability are lateness and incomplete orders. If deliveries from suppliers are late or incomplete, they slow down the flow of goods and services through the supply chain, ultimately resulting in poor-quality customer service. Companies cope with this uncertainty and try to avoid delays with their own form of "insurance," inventory.
•Inventory: insurance against supply chain uncertainty.
Supply chain members carry buffer (or extra) inventory at various stages of the supply chain to minimize the negative effects of uncertainty and to keep goods and services flowing smoothly from suppliers to customers. For example, if a parts order arrives late (or does not arrive at all) from a supplier, the producer is able to continue production and maintain its delivery schedule to its customers by using parts it has stored in inventory for just such an occurrence.
Companies also accumulate inventory because they may order in large batches in order to keep down order and transportation costs or to receive a discount or special price from a supplier. However, inventory is very costly. Products sitting on a shelf or in a warehouse are just like money sitting there not being used when it could be used for something else. It is estimated that the cost of carrying a retail product in inventory for one year is over 25% of what the item cost. Inventory-carrying costs are over $300 billion per year in the United States. As such, suppliers and customers would like to minimize or eliminate it.
•Bullwhip effect: occurs when slight demand variability is magnified as information moves back upstream.
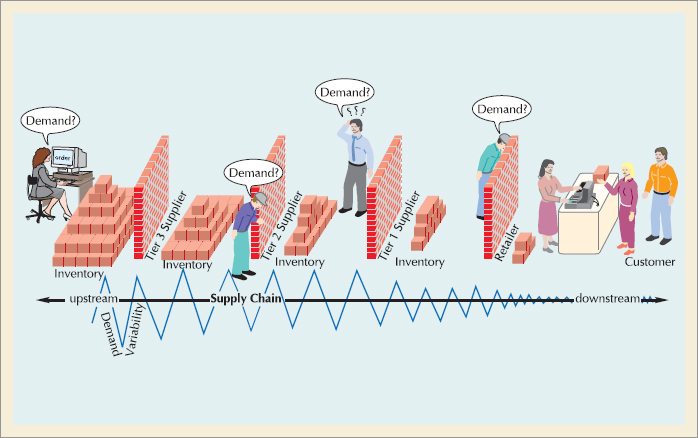
Distorted information or the lack of information, such as inaccurate demand data or forecasts, from the customer end can ripple back upstream through the supply chain and magnify demand variability at each stage. This can result in high buffer inventories, poor customer service, missed production schedules, wrong capacity plans, inefficient shipping, and high costs. This phenomenon, which has been observed across different industries, is known as the bullwhip effect. It occurs when slight to moderate demand variability becomes magnified as demand information is transmitted back upstream in the supply chain. In Figure 10.1 the stream at the bottom of the figure reflects this occurrence; the flow is greater (and the waters more turbulent) further upstream. Figure 10.4 presents a detailed perspective of the bullwhip effect.
The bullwhip effect is created when supply chain members make ordering decisions with an eye to their own self-interest and/or they do not have accurate demand information from the adjacent supply chain members. If each supply chain member is uncertain and not confident about what the actual demand is for the succeeding member it supplies and is making its own demand forecast, then it will stockpile extra inventory to compensate for the uncertainty. In other words, they create a security blanket of inventory. As shown in Figure 10.4, demand for the end user is relatively stable and the inventory is small. However, if slight changes in demand occur, and the distributor does not know why this change occurred, then the distributor will tend to overreact and increase its own demand, or conversely reduce its own demand too much if demand from its customer unexpectedly drops. This creates an even greater overreaction by the manufacturer who supplies the distributor and the suppliers who supply the manufacturer. One way to cope with the bullwhip effect is for supply chain members to share information, especially demand forecasts. If the supply chain exhibits transparency, then members can have access to each other's information, which reduces or eliminates uncertainty.
When supply chains stretch over long distances and include multiple parts, services, and products, uncertainty increases. In "lean" supply chains there is little redundancy and slack (i.e, inventory), so when disruptions occur, the effects can cascade through the supply chain hindering normal operations. For example, a labor strike at an automobile plant can cause downstream assembly plants to reduce or stop production, which, in turn, can result in a lack of autos on dealer lots. Parts shortages, customer order changes, production problems and quality problems are the types of things that can disrupt a supply chain. As we have suggested, one way to offset this uncertainty is by carrying extra inventory at various stages along the supply chain, (i.e., the bullwhip effect). However, another way to reduce uncertainty is called risk pooling.
In risk pooling, risks are aggregated to reduce the impact of individual risks. As this implies, there are several ways to pool supply chain risks. One way is to combine the inventories from multiple locations into one location, like a warehouse or distribution center. It is well known (and can be shown mathematically) that it is more economical to hold inventory at one central location than dispersing it across several customer locations. Doing so reduces the overall inventory investment needed to achieve a target service level across all the customers the distribution center supplies (i.e., it's more costly to meet variations in demand from several locations than from one), which in effect, reduces demand variability. Adding a distribution center between the supplier and the end-use customers can also shorten the lead time between the supplier and customer, which is another way to pool risks. When the demand forecast is closer to its actual occurrence (i.e., shorter lead time), then variability is reduced; it's a lot easier to predict demand for next week than for next month.
Another way to pool risks is to reduce parts and product variability, thereby reducing the number of product components, which allows a company to meet demand with fewer products. Common product components that can be used in a lot of different products enable a company to pool its forecasts for the components demand, resulting in fewer forecasts. (The more forecasts there are, the more chances for errors.) Reducing product variability can have the same effect. It's easier to forecast demand for a small number of product configurations than a larger number of configurations. This is why automobile companies like Honda offer packages of options rather than just a list of add-ons. Yet another way to pool risks is by creating flexible capacity. It reduces the uncertainty for the customer if its demand can be met by several different production facilities, which the supplier can achieve by increasing its production capacities at several different locations. The customer can reduce its own risks by increasing the number of suppliers it uses.
•sustainability: meeting present needs without compromising the ability of future generations to meet their needs.
"Going green," also referred to as achieving sustainability, has become one of the most visible recent trends in operations and supply chain management. Sustainability, according to the United Nations, is "meeting present needs without compromising the ability of future generations to meet their needs." Implicit in this definition is not depleting or abusing our natural resources like air, water, land, and energy in a way that's going to harm current or future generations. For businesses it also means sustaining human and social resources. However, to many companies, sustainability means becoming environmentally friendly and socially conscious (i.e., "green"), at the expense of competitiveness and higher costs. A common perception among many U.S. and European corporations is that requiring suppliers, especially in developing countries, to use green practices is not feasible because they do not face the same governmental, cultural, and social pressures; that green manufacturing will require costly new equipment and processes; and that the customer market for products designed with green attributes is "soft." As a result companies often view social and environmental responsibility separately from business objectives.
However, there is a growing realization among many companies that the social and environmental benefits of developing sustainable products do not have to come at the expense of reduced profits and competiveness. Sustainability can, in fact, be cost effective and profitable and provide the impetus for product and process innovations. Green initiatives can lower costs because fewer resources are used, and additional revenues can result from better products or new businesses. Although Toyota realized huge costs in developing its hybrid Prius, it has created a whole new successful and potentially profitable product and market just as gasoline prices were rising. Further, by designing products that can be recycled or reused, companies can reduce waste, thereby lowering costs. Thus, while a commitment to green practices can create a better image for companies among consumers (and the government), they can also reduce costs and increase revenues.
The impetus for, and commitment to, sustainability generally comes from downstream in the supply chain and moves back upstream to include suppliers. Companies have found that suppliers can account for as much as 80% of the resources consumed in a product's supply chain. Companies must work with and guide suppliers to reduce the inefficient use of resources, reduce the use of raw materials, reduce waste, and recycle. Suppliers can be coerced into using green practices by threats, demands, or incentives, or a combination.
Many companies already have quality improvement programs in place that require suppliers to adhere to continuous improvement goals of eliminating returned products, thus reducing waste; poor quality translates to wasted resources. The same quality management focus on reducing waste can work to achieve sustainability goals. As we discussed in Chapter 2, the cost of poor quality can have a significant impact on a company's profitability and competitiveness, and quality costs may often come from suppliers along the supply chain, including the cost of materials, labor, and resources for reworking defective products; the cost of shipping delays and customer service errors; and the cost of product replacement and waste.
Improving fuel efficiency in a distribution fleet, having employees telecommute, using eco-friendly packaging materials, building energy efficient facilities, reducing the use of wooden pallets, and even turning the thermostat up in summer and down in winter are initiatives that improve processes and reduce costs, and also achieve sustainability goals. For example, FedEx, which has a fleet of 700 aircraft and 44,000 vehicles that consume an estimated 4 million gallons of fuel per day, is replacing old aircraft with new larger more fuel-efficient Boeing aircraft that will reduce its fuel consumption by over 50% and increase capacity by 20%; it uses hybrid vans that are over 40% more fuel efficient and has replaced over 25% of its fleet with more fuel-efficient vehicles; it has developed new software that will optimize aircraft routes and schedules; and it has developed more energy-efficient solar systems at distribution hubs in California and Germany. FedEx has also started a consulting firm to sell the energy expertise it has gained through it own sustainability initiatives.
ALONG THE SUPPLY CHAIN
Achieving Sustainability While Reducing Costs and Increasing Profits
FedEx has a fleet of 700 aircraft and 44,000 vehicles that consume an estimated 4 million gallons of fuel per day. As part of its sustainability efforts it is replacing old aircraft with new larger, more fuel-efficient Boeing aircraft that will reduce its fuel consumption by over 50% and increase shipping capacity by 20%; it uses hybrid vans that are over 40% more fuel efficient and has replaced over 25% of its fleet with more fuel-efficient vehicles; it has developed new software that will optimize aircraft routes and schedules; and it has developed more energy-efficient solar systems at distribution hubs in California and Germany. FedEx has also started a consulting firm to sell the energy expertise it has gained through it own sustainability initiatives.
Twenty-five percent of IBM's 320,000 employees telecommute, saving the company $700 million in real estate costs each year, and AT&T annually saves $550 million with telecommuting. Cisco Systems established a business unit for recycling that increased the reuse of equipment from 5% to 45% and reduced recycling costs by 40% in a four-year period; overall the unit became a profit center that earned Cisco over $100 million in one year. Proctor and Gamble estimated that if U.S. households switched to cold-water clothes washing instead of heating water we would save 80 billion kWh of electricity and reduce carbon dioxide emissions by 34 million tons. As a result they developed new cold-water detergents, Tide Coldwater in the United States and Ariel Cool Clean in Europe. More popular in Europe than the states, cold-water washing rose from 2% to 21% in the United Kingdom, and in Holland it rose from 5 to 52%. Upon discovering that household cleaning products are the second biggest environmental concern in the United States next to cars and that up to 35% of consumers consider environmental benefits when making purchases, Clorox spent three years and $20 million to develop its nonsynthetic Green Works line of cleaning products. Endorsed by the Sierra Club, in one year Green Works grew the natural cleaner market in the United States by 100%, and Clorox garnered a 40% share of the $200 million market; and then it introduced biodegradable cleaning wipes and nonsynthetic detergents that compete directly with P&G products. Waste Management, a $14 billion garbage disposal company, estimated that it was hauling $9 billion worth of reusable waste to landfills and set up a new business unit, "Green Squad," to partner with companies in the United States to turn waste into profits; for example, working with Sony to collect elec-tronic waste for recycling.
Look on the Internet and identify other green initiatives that companies have taken that reduce costs or increase profits.
Source : Ram Nidumolu, C.K. Prahalad and M.R. Rangaswami, "Why Sustainability is Now the Key Driver of Sustainability," Harvard Business Review, vol. 87 (9: September 2009), pp. 57–64.
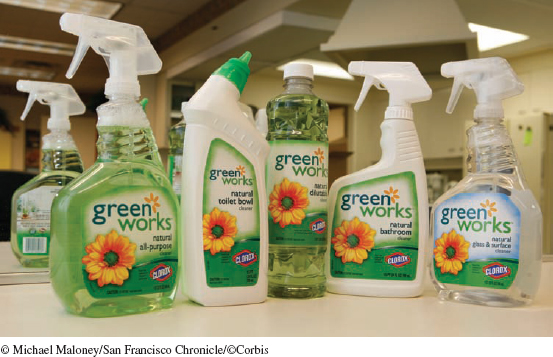
Clorox's Green Works line of environmentally-friendly household cleaning products made with natural, biodegradable non-petroleum-based materials is among a wave of new products that many companies are introducing to tap into potentially profitable "sustainable" consumer markets.
Information is the essential link between all supply chain processes and members. Computer and information technology allows real-time, online communications throughout the supply chain. Technologies that enable the efficient flow of products and services through the supply chain are referred to as "enablers," and information technology has become the most important enabler of effective supply chain management.
Information links all aspects of the supply chain.
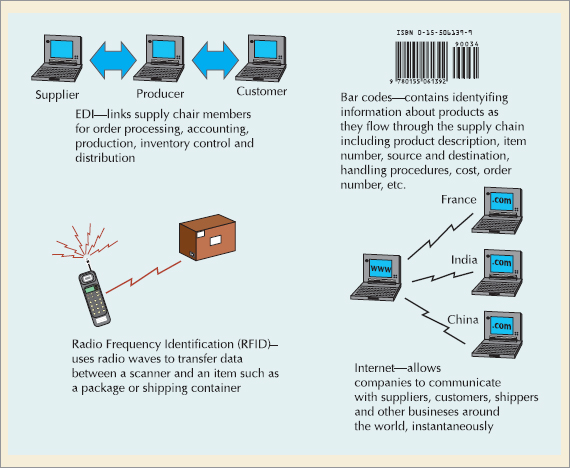
Supply chain managers like to use the phrase "in modern supply chain management, information replaces inventory." Although this statement is not literally true—companies need inventory at some point, not just information—information does change the way supply chains are managed, and these changes can lead to lower inventories. Without information technology supply chain management would not be possible at the level it is currently being accomplished on a global basis. Some of the more important IT supply chain enablers are shown in Figure 10.5.
E-business replaces physical processes with electronic ones. In e-business, supply chain transactions are conducted via a variety of electronic media, including EDI, e-mail, electronic funds transfer (EFT), electronic publishing, image processing, electronic bulletin boards, shared databases, bar coding, fax, automated voice mail, CD-ROM catalogues, the Internet, Web sites, and so on. Companies are able to automate the process of moving information electronically between suppliers and customers. This saves both labor costs and time.
•E-business: the replacement of physical business processes with electronic ones.
Some of the features that e-business brings to supply chain management include:
Cost savings and price reductions derived from lower transaction costs (including labor and document savings)
Reduction or elimination of the role of intermediaries and even retailers and service providers, thus reducing costs
Shortening supply chain response and transaction times for ordering and delivery
Gaining a wider presence and increased visibility for companies
Greater choices and more information for customers
Improved service as a result of instant accessibility to services
Collection and analysis of voluminous amounts of customer data and preferences
The creation of virtual companies like Amazon.com that distribute only through the Web, which can afford to sell at lower prices because they do not need to maintain retail space
Leveling the playing field for small companies, which lack resources to invest in infrastructure (plant and facilities) and marketing
Gaining global access to markets, suppliers, and distribution channels
•Electronic data interchange (EDI): a computer-to-computer exchange of business documents.
Electronic data interchange (EDI) is a computer-to-computer exchange of business documents in a standard format, which has been established by the American National Standards Institute (ANSI) and the International Standards Organization (ISO). It creates a data exchange that allows trading partners to use Internet transactions instead of paper when performing purchasing, shipping, and other business. EDI links supply chain members together for order processing, accounting, production, and distribution. It provides quick access to information, allows better customer service, reduces paperwork, allows better communication, increases productivity, improves tracking and expediting, and improves billing and cost efficiency.
EDI can be effective in reducing or eliminating the bullwhip effect discussed earlier in this chapter. With EDI, supply chain members are able to share demand information in real time, and thus are able to develop more accurate demand forecasts and reduce the uncertainty that tends to be magnified at each upstream stage of the supply chain.
A bar code is what is referred to as an "automated data collection" system, or "auto-ID." In bar coding, computer-readable codes are attached to items flowing through the supply chain, including products, containers, packages and even vehicles. The bar code contains identifying information about the item. It might include such things as a product description, item number, its source and destination, special handling procedures, cost, and order number. A food product can be identified down to the farmer who grew it and the field it was grown in. When the bar code information is scanned into a company's computer by an electronic scanner, it provides supply chain members with critical information about the item's location in the supply chain.
Bar code technology has had a huge influence on supply chain management, and it is used by thousands of companies in different situations. Package delivery companies like FedEx and UPS use bar codes to provide themselves and customers with instantaneous detailed tracking information. Supermarkets use scanners at cash registers to read prices, products, and manufacturers from Universal Product Codes (UPCs).
When bar codes are scanned at checkout counters, it also creates point-of-sale data—an instantaneous computer record of the sale of a product. This piece of information can be instantly transmitted throughout the supply chain to update inventory records. Point-of-sale data enable supply chain members—suppliers, producers, and distributors—to quickly identify trends, order parts and materials, schedule orders and production, and plan for deliveries.
•Point-of-sale data: creates an instantaneous computer record of a sale.
•Radio frequency identification (RFID): can send product data from an item to a reader via radio waves.
While a barcode is the most commonly used auto-ID system, a more technologically advanced system is radio frequency identification (RFID). RFID technology uses radio waves to transfer data between a reader, (that is, a scanner), and an item such as a shipping container or a carton. RFID consists of a tiny microchip and computer, often a small, thin ribbon, which can be put in almost any form—for example between layers of cardboard in a box, or on a piece of tape or a label. An RFID "tag" stores a unique identification number. RFID scanners transmit a radio signal via an antenna to "access" the tag, which then responds with its number. The tag could be an Electronic Product Code (EPC), which could be linked to databases with detailed information about a product item. Unlike bar codes, RFID tags do not need a direct "line of sight" to read, and many tags can be read simultaneously over a long distance.
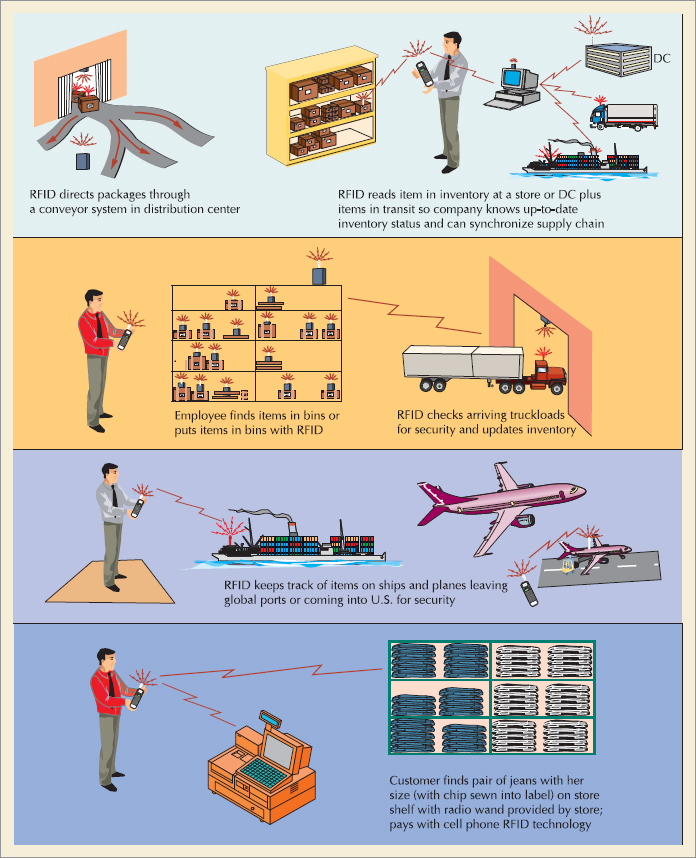
RFID has a number of advantages over barcodes. RFID tags do not need a direct "line of sight" to read, and many tags can be read simultaneously over a long distance. When products arrive at a location, such as a retail store, shipping dock, or warehouse, each barcode has to be scanned individually, whereas RFID readers placed at an entry site (like a door) can automatically scan a whole pallet of different products automatically and instantaneously. As such, RFID provides complete visibility of product location, is faster, reduces labor usage, and is more accurate than barcodes. With barcodes it is difficult to know how much product is in a store; however, RFID readers inside a store (or warehouse) can continuously monitor what is available, and when the inventory reaches a certain level it can be reordered. When items are stored in a warehouse, the barcode on the item to be stored has to be scanned as well as the barcode fixed to the location; however, RFID eliminates these steps.
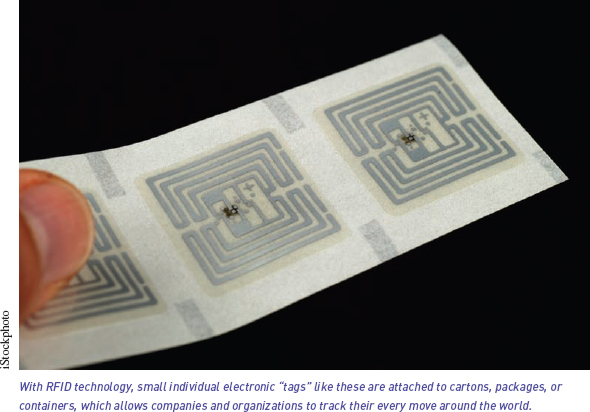
With RFID technology, small individual electronic "tags" like these are attached to cartons, packages, or containers, which allows companies and organizations to track their every move around the world.
In a global supply chain RFID tags make it possible for a supplier or retailer to know automatically what goods they have and where they are around the world. For example, a retailer could distinguish between three cartons of the same product and know that one was in the warehouse in Asia, one was in the store, and one was in ocean transit, which would speed up product location, delivery, and replenishment. Figure 10.6 shows some of the advantages RFID provides. RFID technology also has obvious security benefits by being able to identify all items being shipped into the United States on an airplane or a ship.
Walmart has mandated that its top suppliers put RFID tags carrying EPC codes on pallets and cases, and Kroger, Target, and CVS are doing the same. Walmart estimates that the following benefits will result from RFID:
Labor to scan barcodes on cases and pallets will be eliminated.
On-shelf monitoring will decrease stock-outs in stores.
Prevention of product shrinkage, vendor fraud, and theft.
Decreased distribution center costs by tracking over 1 billion pallets annually.
Provide inventory visibility enabling a 20% reduction in inventory levels.
Savings of over $8 billion per year.
However, RFID technology does have some disadvantages. RFID technology is not yet standardized, which makes it difficult to track items that move from one system to another. Using RFID is more costly than using barcodes: individual RFID tags are expensive relative to barcodes, and the readers are costly. It has been estimated that it costs more than $2 million to RFID-enable a typical warehouse. As a result, it is likely that both barcodes and RFID will be used by companies for supply chain management for years to come.
No technology has a bigger impact on supply chain management, and business in general, than the Internet. Through the Internet a business can communicate with customers and other businesses within its supply chain anywhere in the world in real time.
The Internet has eliminated geographic barriers, enabling companies to access markets and suppliers around the world that were previously inaccessible. By doing so, the Internet has shifted the advantage in the transaction process from the seller to the buyer, because the Internet makes it easier for companies to deal with many more suppliers around the world in order to get lower prices and better service.
ALONG THE SUPPLY CHAIN
Supply Chain Management at Gaylord Hotels
The Opryland Resort is one of several hotel properties owned and operated by Gaylord Entertainment Company headquartered in Nashville, Tennessee, with annual revenues approaching $1 billion and 10,000 employees. Gaylord Hotels are universally known for their elegant guest accommodations, state-of-the-art facilities, and exceptional customer service. In the hotel industry customer satisfaction is a critical metric so Gaylord management has become skilled at using its supply chain to accommodate guest preferences. Gaylord sources more than 7,000 items ranging from breath mints to specialty ovens, and it relies heavily on guest and employee feedback in determining the products it buys from suppliers. Gaylord is able to leverage its buying power and its unique position within the market (as a hotel that suppliers want their products in) to get the best quality products at the best price. Gaylord makes sure it is able to "get what it pays for," (one of the definitions of quality we introduced in Chapter 2). The SCM team at Gaylord consists of three groups that handle purchases: food and beverage and furniture, fixtures, and equipment (FFE); maintenance, repairs, and operations (MRO); and IT and services. Using an Oracle software system, teams across the United States can share data and see what sister hotels are doing within three or four minutes. When an item or idea becomes a success at one hotel, it is passed up to corporate headquarters to possibly become a best practice across all Gaylord properties. When making purchasing decisions the company looks at the entire supply chain to negotiate for the best price. For example, when purchasing paper products Gaylord monitors trends in materials used in paper production, such as wood pulp, using the Product Price Indices (PPI) or Consumer Price Index (CPI) to gauge worldwide demand for resources that it can use to negotiate prices with manufacturers. They also negotiate directly with the manufacturer for products on a cost-plus basis, thereby separating out logistics and distribution fees and working separately with distributors for delivery. Gaylord is also selecting green products, packaging, and services when they meet guest standards, such as sustainably farmed food products, energy-efficient lighting and air conditioning, cleaning products, and guest amenity products.
Identify some of the other products that a hotel like Gaylord might purchase from suppliers. Do you think hotels have more or less opportunities than a manufacturing firm to source from overseas suppliers? Do you think a hotel's supply chain would be more or less complex than a manufacturing firm's?
Source: Lisa Arnseth, "Four-Star Supply Chain Management," Inside Supply Management," vol. 20 (8: August 2009), pp. 26–28.
The Opryland Hotel in Nashville is a service operation with a clearly defined and manageable supply chain like any manufacturing company

The Internet adds speed and accessibility to the supply chain. Companies are able to reduce or eliminate traditional time-consuming activities associated with ordering and purchasing transactions by using the Internet to link directly to suppliers, factories, distributors, and customers. It enables companies to speed up ordering and delivery, track orders and delivery in real time, instantaneously update inventory information, and get instantaneous feedback from customers. This combination of accurate information and speed allows companies to reduce uncertainty and inventory. Internet commerce is expected to exceed $6 trillion in this decade.
Dell was the first computer company to move to a direct-sell-to-customers model over the Internet. Its popular build-to-order (BTO) models were initially based on telephone orders by customers. Dell created an efficient supply chain using a huge number of weekly purchase orders faxed to suppliers. However, Dell now sends out orders to suppliers over the Internet every few hours or less. Dell's suppliers are able to access the company's inventories and production plans, and they receive constant feedback on how well they are meeting shipping schedules.
Dell's Web site allows the customer to configure a PC with the desired features; to order and track the order status, allowing the customer to follow their purchase in real time from order to delivery; and to be notified by e-mail as soon as the order is shipped. Also, Dell created secure private sites for corporate and public sector customers to provide access to service and support information customized to the customer's products. In addition, Dell provides online access to technical reference materials and self-diagnostic tools that include symptom-specific troubleshooting modules that walk customers interactively through common systems problems.
One of the keys to having a successful, efficient supply chain is to get the various supply chain members to collaborate and work together, that is, to get "in-sync." This level of coordination is referred to as supply chain integration. Information technology is the key element in achieving supply chain integration through four areas—information sharing, collaborative planning, work-flow coordination, and the adoption of new models and technologies. Table 10.1 on the following page describes the positive effect each of these elements can have on supply chain performance.
Information sharing includes any data that are useful to other members of the supply chain such as demand data, inventory stocks, and production and shipping schedules—anything that can help the supply chain members improve performance. Information needs to be transparent (i.e., not hidden) and easily accessible, online. Collaborative planning defines what is done with the information that is shared. Workflow coordination defines how supply chain partners work together to coordinate their activities. Finally, adopting new business models and technologies is how supply chain members redesign and improve their supply chain performance.
•Collaborative, planning, forecasting, and replenishment (CPFR): a process for two or more companies in a supply chain to synchronize their demand forecasts into a single plan to meet customer demand.
Collaborative planning, forecasting, and replenishment (CPFR) is a process for two or more companies in a supply chain to synchronize their individual demand forecasts in order to develop a single plan for meeting customer demand. With CPFR, parties electronically exchange a series of written comments and supporting data, which includes past sales trends, point-of-sale data, on-hand inventory, scheduled promotions, and forecasts. This allows participants to coordinate joint forecasts by concentrating on differences in forecast numbers. They review the data together, compare calculations, and collaborate on what is causing discrepancies. If there are no exceptions they can develop a purchase order and ship. CPFR does not require EDI; data can be sent via spreadsheets or over the Internet. CPFR is actual collaboration because both parties do the work and both parties share in fixing the problems. Sharing forecasts in this type of collaborative system can result in a significant decrease in inventory levels for both the manufacturer and distributor since it tends to reduce the "bullwhip effect," and thus lower costs.
Table 10.1. Supply Chain Integration
•Enterprise resource planning (ERP): software that integrates the components of a company by sharing and organizing information and data.
Enterprise resource planning (ERP) is software that helps integrate the components of a company, including most of the supply chain processes, by sharing and organizing information and data among supply chain members. It transforms transactional data like sales into useful information that supports business decisions in other parts of the company. For example, when data such as a sale becomes available in one part of the business, it is transmitted through ERP software, which automatically determines the effects of the transaction on other areas, such as manufacturing, inventory, procurement, invoicing, distribution, and accounting, and on suppliers. Through these information flows ERP organizes and manages a company's supply chain. Most ERP vendors systems handle external, Web-based interactions, and have software specifically for supply chain management called "SCM."
SAP was the first ERP software provider and is the largest, which has made it almost synonymous with ERP applications software. mySAP.com is the umbrella brand name for the SAP software. mySAP.com is a suite of Web-enabled SAP modules that allow a company to collaborate with its customers and business partners along its supply chain. When a customer submits an order, that transaction ripples throughout the company's supply chain, adjusting inventory, part supplies, accounting entries, production schedules and shipping schedules, and balance sheets. Different nations' laws, currencies, and business practices are embedded in the software, which enables it to translate sales transactions smoothly between business partners in different countries—for example, a company in Taiwan and its customer in Brazil.
ERP is discussed in greater detail in Chapter 15 "IT Systems for Resource Planning".
As we indicated in previous sections, inventory is a key element in supply chain management. On one hand, it enables a company to cope with uncertainty by serving as a buffer between stages in the supply chain. Inventory allows items to flow smoothly through the system to meet customer demand when stages are not in sync. On the other hand, inventory can be very costly. As such, it is important for a company to maintain an efficient supply chain by lowering inventory levels (and costs) as much as possible. In order to accomplish this objective, several numerical measures, also called key performance indicators (KPIs) or metrics, are often used to measure supply chain performance. Three of the more widely used key performance indicators are inventory turnover, inventory days of supply, and fill rate.
•Key performance indicators (KPIs): metrics used to measure supply chain performance.
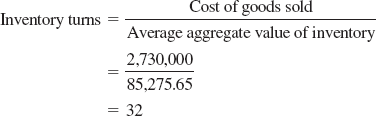
•Inventory turns: a supply chain perfomance metric computed by dividing the cost of goods sold by the average aggregate value of inventory.
Inventory turnover (or turns) is computed by dividing the cost of goods sold (i.e., the cost of annual sales) by the average aggregate inventory value:
The average aggregate value of inventory is the total value (at cost) of all items being held in inventory, including such things as raw materials, work-in-process (WIP), and finished goods. It is computed by summing for all individual inventory items, the product of the average number of units on hand in inventory at any one time multiplied by the unit value:
The cost of goods sold is only for finished goods, valued at cost, not the final sale price (which might include discounts or markups).
Every time product items are sold that are equal to the average amount of money that was invested in those items, then the inventory has been turned. An item whose inventory is sold (i.e., turns over) once a year has higher holding costs (for rent, utilities, insurance, theft, etc.) than one that turns over twice, three times, or more in that same time period. For example, if a firm that sells products that cost $10,000 in a year has a total revenue from the sale of these products of $15,000, the gross profit is $5,000. However, suppose instead the company only purchased $5,000 worth of product at the first of the year, and then just before running out of stock, it bought an additional $5,000 of product with part of the revenues from selling the first batch. The company still invested $10,000 in products and made revenues of $15,000, but only on an investment of $5,000. Which strategy is better—making $5,000 gross profit on an investment of $10,000 or $5,000? It is better to invest the smaller amount; with a $5,000 investment the company has freed up $5,000 for part of the year to invest in other things it could make a profit on, and it has reduced its holding costs. However, the trick is to invest the minimum amount possible in products and reorder at just the right time to avoid stockouts. This is why a company with good supply chain management has more inventory turns than a company that does not.
A poor, or comparatively low, inventory turnover indicates that a large amount of inventory is required to satisfy demand. In general, a good (or poor) number of inventory turns is relative to what is being achieved at various stages across a company and what the industry norm is. Only comparisons of inventory turns for companies within the same industry are meaningful. Comparing a supermarket to a car dealer is not meaningful; a supermarket sells fast-moving products so its inventory turns will be higher than a car dealer that sells slow-moving items. In the 1980s, inventory turns for many manufacturing companies were less than five; however, the advent of lean production (see Chapter 16) and the increased focus on quality management and supply chain management have increased inventory turns in much of the manufacturing sector to about six turns per year for a typical company. Although this seems like a small change, it still represents a significant decrease in costs and increase in profits. Alternatively, a typical computer company or grocery store will have 12 turns or more per year.
Toyota had inventory turns in the 60s in the 1980s when its supply chain was mostly in Japan, but this has fallen to between 10 and 12 in recent years as it has expanded globally and the complexities of its supply chain have increased accordingly. High-tech companies typically have around six turns per year, but Dell has achieved inventory turns greater than 50, belying its supply chain success. In one year Palm increased its number of turns from 12 to 26, which decreased inventory from $55 million to $23 million. Alternatively, pharmaceutical giant Pfizer has had recent inventory turns as low as 1.5. However, this does not mean that Pfizer is doing poorly finan-cially—it has been very profitable. It does mean that perhaps it could manage its supply chain more efficiently.
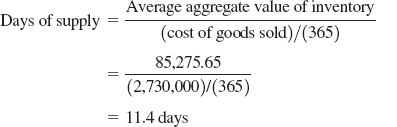
Another commonly used KPI is days (or weeks) of supply. This is a measure of how many days (or weeks) of inventory is available at any point in time. It is computed by dividing the aggregate average value of inventory by the daily (or weekly) cost of goods sold,
Automotive companies typically carry about 60 days of finished goods supply.
•Fill rate: the fraction of orders filled by a distribution center within a specific time period.
Another frequently used KPI is fill rate. Fill rates are the fraction of orders placed by a customer with a supplier distribution center or warehouse which are filled within a specific period of time, typically one day. High fill rates indicate that inventory is moving from the supplier to the customer at a faster rate, which thereby reduces inventory at the distribution center. For example, Nabisco's fill rate for its Planter's peanuts at Wegman's grocery store chain is 97%, meaning that when the store places an order with the Nabisco distribution center, 97% of the time it is filled within one day.
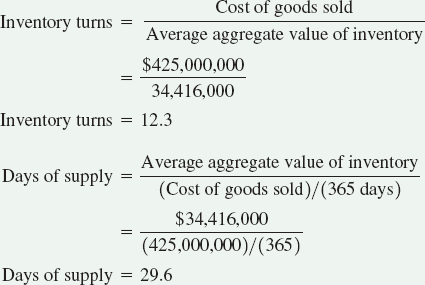
Computing Key Performance Indicators
The Tomahawk Motorcycle Company manufactures motorcycles. Last year the cost of goods sold was $425 million. The company had the following average value of production materials and parts, work-in-process, and finished goods inventory:
Production materials and parts | $ 4,629,000 |
Work-in-process | 17,465,000 |
Finished goods | 12,322,000 |
Total average aggregate value of inventory | $34,416,000 |
The company wants to know the number of inventory turns and days of supply being held in inventory.
Solution
In Chapter 2, Quality Management, we talked about various techniques that could be employed to monitor product and service quality. One of the more powerful techniques we presented was statistical process control, the subject of Chapter 3. Although we tend to think that process control is used to monitor and control quality for manufacturing operations, it can also be used to monitor and control any of the processes in the supply chain. If products are defective, then the effects are obvious. However, other problems along the supply chain that create uncertainty and variability are most often caused by errors. If deliveries are missed or are late, if orders are lost, if errors are made in filling out forms, if items with high obsolescence rates (like PCs) or perishable items are allowed to stay too long in inventory, if demand forecast errors are made, if plant and equipment are not properly maintained, then the supply chain can be disrupted, thereby reducing supply chain performance. Thus, at any stage in the process, statistical process control charts can be used to monitor process performance.
•Supply chain operations reference (SCOR): a cross-industry supply chain diagnostic tool maintained by the Supply Chain Council.
The supply chain operations reference (SCOR) model is a supply chain diagnostic tool that provides a cross-industry standard for supply chain management. It was developed and is maintained by the Supply Chain Council, a global not-for-profit trade association organized in 1996 with membership open to companies interested in improving supply chain efficiency primarily through the use of SCOR. The Supply Chain Council (SCC) has almost 1,000 corporate members around the world, including many Fortune 500 companies.
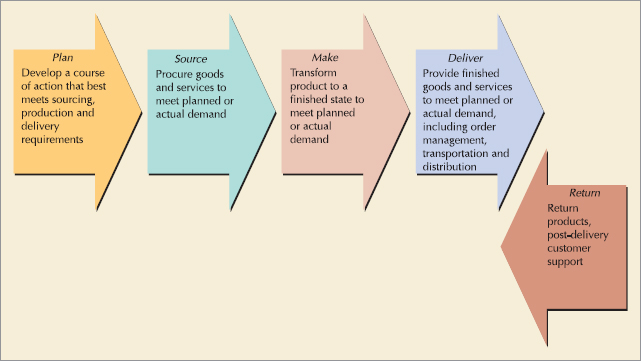
The purpose of the SCOR model is to define a company's current supply chain processes, quantify the performance of similar companies to establish targets to achieve "best-in-class" performance, and identify the practices and software solutions that will yield "best in class" performance. It is organized around a set of five primary management processes—plan, source, make, deliver, and return, as shown in Figure 10.7. These processes provide a common set of definitions, or building blocks, that SCOR uses to describe any supply chain, from simple to complex. This allows supply chains for different companies to be linked and compared.
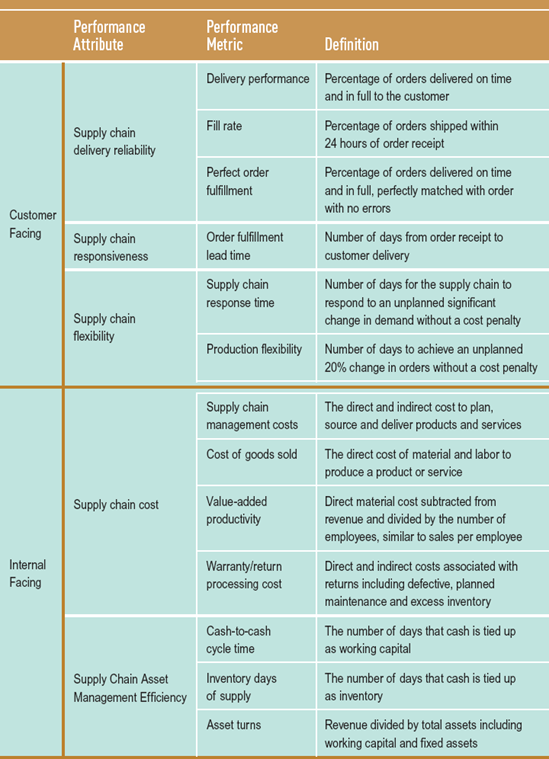
A primary feature of the SCOR model is the use of a set of performance indicators or "metrics" to measure supply chain performance. These metrics are categorized as "customer-facing" or "internal-facing" as shown in Table 10.2. Customer-facing metrics measure supply chain delivery reliability, responsiveness, and flexibility with respect to customers and suppliers. Internal-facing metrics measure supply chain cost and asset management efficiency. The metrics may be used for multiple supply chain processes.
These metrics are used to develop a "SCORcard" that measures both a company's current supply chain performance for different processes and its competitor's metrics. The company then projects the level of metrics it needs to be on a par with its competitors, to have an advantage over its competitors, or to be superior. The value associated with these measured improvements in performance is then projected for the different performance attributes. For example, a company may know that the industry "median fill rate" is 90% and the industry best-in-class performance is 99%. The company has determined that its current fill rate is 65%, and that a fill rate of 90% will give it parity with its competitors, a 95% fill rate will give it an advantage, and a 99% fill rate will make it superior to most of its competitors. The company may then project that the improvement in its fill rate plus improvements in the other supply chain reliability attributes (i.e., delivery performance and perfect order fulfillment) will increase supply chain value by $10 million in revenue. This process wherein a company measures its current supply chain performance, compares it to its competition, and then projects the performance levels it needs to compete is referred to as "gap analysis." SCOR then provides a framework not only for measuring performance but for diagnosing problems and identifying practices and solutions that will enable a company to achieve its competitive performance objectives.
Supply chain management is one of the most important, strategic aspects of operations management because it encompasses so many related functions. Who to buy materials from, how to transport goods and services, and how to distribute them in the most cost-effective, timely manner constitutes much of an organization's strategic planning. Contracting with the wrong supplier can result in poor-quality materials and late deliveries. Selecting the wrong mode of transportation or carrier can mean late deliveries to customers that will require high, costly inventories to offset. All of these critical functional supply chain decisions are complicated by the fact that they often occur in a global environment within cultures and markets at a distance and much different from those in the United States.
bullwhip effect occurs when demand variability is magnified at various upstream points in the supply chain.
collaborative planning, forecasting, and replenishment (CPFR) a process for two or more companies in a supply chain to synchronize their demand forecasts into a single plan to meet customer demand.
e-business the replacement of physical business processes with electronic ones.
electronic data interchange (EDI) a computer-to-computer exchange of business documents.
enterprise resource planning (ERP) software that connects the components of a company by sharing and organizing information and data.
fill rate the fraction of orders placed by a customer with a supplier distribution center or warehouse which are filled within 24 hours.
inventory insurance against supply chain uncertainty held between supply chain stages.
inventory turns a supply chain performance metric computed by dividing the cost of goods sold by the average aggregate value of inventory.
key performance indicator (KPI) a metric used to measure supply chain performance.
point-of-sale data computer records of sales at retail sites.
procurement purchasing goods and services from suppliers.
radio frequency identification (RFID) radio waves used to transfer data, like an electronic product code, between an item with an embedded microchip and a reader.
SCOR the supply chain operations reference model; a diagnostic tool that provides a cross-industry standard for supply chain management.
supply chain the facilities, functions, and activities involved in producing and delivering a product or service from suppliers (and their suppliers) to customers (and their customers).
supply chain management (SCM) managing the flow of information through the supply chain in order to attain the level of synchronization that will make it more responsive to customer needs while lowering costs.
sustainability meeting present needs without compromising the ability of future generation to meet their needs.
value the creation of value for the customer is an important aspect of supply chain management.
INVENTORY TURNS AND DAYS OF SUPPLY
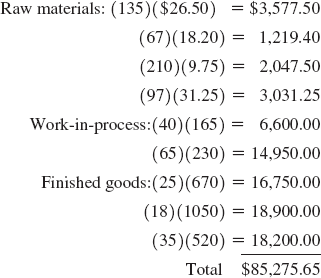
A manufacturing company had the following average raw materials, work-in-process, and finished goods inventory on hand at any one time during the past year.
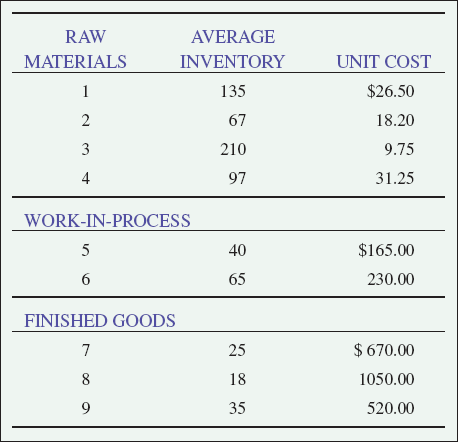
The company's cost of goods sold last year was $2.73 million, and it operates 365 days per year.
Determine the company's inventory turns and days of supply.
SOLUTION
Step 1. Compute the average aggregate value of inventory.
Step 2. Compute inventory turns.
Step 3. Compute days of supply.
10-1. Describe the supply chain, in general terms, for McDonald's and for Toyota.
10-2. Define the strategic goals of supply chain management, and indicate how each element of a supply chain (purchasing, production, inventory, and transportation and distribution) has an impact on these goals.
10-3. Identify three service businesses in your community and describe their supply chains.
10-4. Describe how a business you are familiar with uses IT enablers in its supply chain management.
10-5. Select a company and determine the type of suppliers it has, then indicate the criteria that you think the company might use to evaluate and select suppliers.
10-6. Locate an e-marketplace site on the Internet and describe it and the type of producers and suppliers it connects.
10-7. Explore the Web site of an ERP provider and describe the services it indicates it provides.
10-8. Purchasing is a trade magazine with articles that include many examples of supply chain management at various companies. Research an article from Purchasing and write a brief paper on a company reporting on its Supply Chain activities similar to the "Along the Supply Chain" boxes in this chapter.
10-9. Transportation & Distribution is a trade magazine that focuses on supply chain management, especially logistics. In fact, its Web site is www.totalsupplychain.com. The magazine includes numerous articles reporting on companies' experiences with supply chain management. Select an article from Transportation & Distribution and write a brief paper similar to "Along the Supply Chain" boxes in this chapter about a scientific company's supply chain management.
10-10. Several automobile manufacturers are beginning to implement programs for "build-to-order" cars. Identify an auto company that has initiated a BTO program and describe what it entails. Contrast the BTO program of this manufacturer with a company experienced in BTO production like Dell Computers. Discuss the differences in the supply chains between these companies that makes BTO production more difficult for an auto manufacturer.
10-11. As Amazon.com grew rapidly after it first went "online" with Internet sales in 1995, it experienced several supply chain problems that other retail companies like L.L. Bean, Sears, and J.C. Penney were able to avoid. What might some of these problems be and why did Amazon and other dot. com companies experience them?
10-12. Explain why radio frequency identification (RFID) offers enhanced opportunities for security in global transportation and distribution, and how this in turn could improve supply chain efficiency.
10-13. Walmart is one of the leaders in promoting the development and use of RFID and electronic product codes. Explain how Walmart plans to use RFID, why Walmart wants its suppliers to adopt RFID, and what obstacles you think may exist for this new technology.
10-14. It has been suggested that SCOR might serve as an international supply chain certification tool much like ISO certification for quality. Explain how you think SCOR might be used as a certification tool.
10-15. Describe the supply chain for your university or college. Who are the suppliers, producers, and distributors in this supply chain? Are there different supplier tiers? How would you evaluate this supply chain? Does inventory even exist, and if it does, what form does it take?
10-16. Identify a business that employs EDI in its supply chain management and describe how it is used.
10-17. One of the key elements in supply chain management is forecasted demand. Customer demand is obviously an important, if not the most important, factor in determining production and distribution plans and inventory levels all along the supply chain. If more product is produced than demanded, the company and its suppliers are left with crippling inventories; if less product is produced than demanded, current and future lost sales can be devastating. Thus, it is critical that companies know what customer demand will be as closely as possible. It is also generally assumed that a company cannot control demand; customers determine demand, and customers don't control their customers. As such, demand is often perceived to be strictly an input to supply chain management. This is not always the case, however, as is demonstrated by the unfortunate experiences of many companies. Following are a few examples of companies that treated demand as an independent factor in their supply chain management decision, to their chagrin.[16]
At midyear Volvo found itself with a surplus of green cars in inventory. In order to get rid of this inventory, the sales and marketing group offered discounts and rebates to distributors on green cars. The marketing plan was successful, and the demand for green cars increased. However, supply chain planners, unaware of the marketing plan, perceived that a new customer demand pattern had developed for green cars so they produced more green cars. As a result, Volvo had a huge inventory of green cars at the end of the year.
When Hewlett-Packard introduced a new PC, demand faltered when Compaq and Packard Bell cut prices. In reaction, supply chain planners at HP cut production back without realizing sales and marketing had decided to match their competitors' price cuts. The resulting stockouts HP experienced resulted in a less than merry Christmas season.
Campbell Soup heavily promoted its chicken noodle soup during the winter when demand peaked, which resulted in even greater than normal demand. In order to meet this spike in demand, it had to prepare large amounts of ingredients like chicken in advance and store it. Also, in order to meet the demand, production facilities had to operate in overtime during the winter, which in turn required them to prepare other products in advance and to store them too. The huge inventories and production costs exceeded the revenues from the increased customer demand of chicken noodle soup.
Italian pasta maker, Barilla, offered discounts to customers who ordered full truckloads. This created such erratic demand patterns, however, that supply costs overwhelmed the revenue benefits.
In each of these brief examples, the company was successfully able to influence customer demand with price discounts and effective marketing, demonstrating that demand is not a completely independent factor. In addition, in each case an increase in sales did not result in increased revenues because they were overwhelmed by increased supply chain costs. This presents a complex problem in supply chain management. Effective marketing is generally a good thing because it does increase sales; however, it also makes forecasting demand more difficult because it creates erratic demand patterns tied to price changes. So what should companies do? Should they forego price discounts and promotions to render demand more stable in order to create a more consistent supply chain that can be effectively managed? One company we mentioned in this chapter has, in effect, done this. Identify this company and explain how it manages its supply chain. Also, discuss the complexities associated with managing a supply chain in which price changes from promotions and discounts are used and discuss strategies for overcoming these complexities.
10-18. Surf the Internet and identify a company with a strong commitment to sustainability and discuss their green initiatives.
10-19. What green initiatives have recently been taken at your school? What additional green initiatives do you think your school should undertake? Discuss whether or not you think the initiatives that have been taken have been for cosmetic purposes for public consumption or have resulted in real quality improvement and have been cost effective.
10-20. Discuss how sustainability might fit in with a company's quality management program.
10-21. Discuss how sustainability initiatives might differ between a service company or organization and a manufacturing firm.
10-22. Identify some applications of barcode technology at your school. Would switching to RFID technology for any of these applications be cost effective?
10-23. Select a local business and discuss how they are applying any Auto-ID technologies.
10-24. Describe the differences between a traditional supply chain for a physical product and a "digital supply chain." Identify a company that employs a digital supply chain and describe the processes involved.
10-1. The Fizer Drug Company manufactures over-the-counter and prescription drugs. Last year the company's cost of goods sold was $470 million. It carried average raw material inventory of $17.5 million, average work-in-process of $9.3 million, and average finished goods inventory of $6.4 million. The company operates 365 days per year. Compute the company's inventory turns and days of supply for last year.
10-2. The Ashton Furniture Company manufactures coffee tables and chest of drawers. Last year the company's cost of goods sold was $3,700,000, and it carried inventory of oak, pine, stains, joiners, and brass fixtures, work-in-process of furniture frames, drawers and wood panels, and finished chests and coffee tables. Its average inventory levels for a 52-week business year were as follows.
Raw Materials | Average Inventory | Unit Cost |
|---|---|---|
Oak | 8000 | $6.00 |
Pine | 4500 | 4.00 |
Brass Fixtures | 1200 | 8.00 |
Stains | 3000 | 2.00 |
Joiners | 900 | 1.00 |
Work-in-Process | ||
FRAMES | 200 | $30 |
Drawers | 400 | 10 |
Panels | 600 | 50 |
Chests | 120 | 110 |
Tables | 90 | 90 |
Finished Goods | ||
Chests | 300 | $500 |
Coffee Tables | 200 | 350 |
Determine the number of inventory turns and the days of supply for the furniture company.
10-3. Barington Mills manufactures denim cloth from two primary raw materials, cotton and dye. Work-in-process includes lapped cotton, spun yarn, and undyed cloth, while finished goods includes three grades of dyed cloth. The average inventory amounts on hand at any one time last year and the unit costs are as follows.
Raw Materials | Average Inventory | Unit Cost |
|---|---|---|
Cotton | 70,000 lb. | $2.75 |
Dye | 125,000 gal. | 5.00 |
Work-in-Process | ||
Lapped cotton | 2000 rolls | $10.50 |
Spun yarn | 5000 spools | 6.75 |
Undyed cloth | 500 rolls | 26.10 |
Finished Goods | ||
Grade 1 cloth | 250 rolls | $65.00 |
Grade 2 cloth | 190 rolls | 80.00 |
Grade 3 cloth | 310 rolls | 105.00 |
The company operates 50 weeks per year, and its cost of goods sold for the past year was $17.5 million.
Determine the company's inventory turns and weeks of supply.
10-4. House Max Builders constructs modular homes, and last year their cost of goods sold was $18,500,000. It operates 50 weeks per year. The company has the following inventory of raw materials, work-in-process, and finished goods.
Raw Materials | Average Inventory | Unit Cost |
|---|---|---|
1 | 7200 | $8.50 |
2 | 4500 | 7.20 |
3 | 3200 | 15.40 |
4 | 4800 | 13.70 |
5 | 6900 | 10.50 |
Work-in-Process | Average Inventory | Unit Cost |
A | 100 | $16.200 |
B | 70 | 13.500 |
C | 60 | 6.100 |
D | 35 | 14.400 |
Finished Goods | ||
Model X | 20 | $78.700 |
Model Y | 10 | 65.300 |
Model Z | 10 | 86.000 |
Determine the number of inventory turns and the days of supply for House Max.
10-5. The PM Computer Company makes build-to-order (BTO) computers at its distribution center year round. The following table shows the average value (in $ millions) of component parts, work-in-process, and finished computers at the DC for the past four years.
Year | ||||
|---|---|---|---|---|
1 | 2 | 3 | 4 | |
Component parts | $20.5 | 27.8 | 30.8 | 37.3 |
Work-in-process | 4.2 | 6.7 | 7.1 | 9.5 |
Finished computers | 3.6 | 7.2 | 8.6 | 10.1 |
Cost of goods sold | 226.0 | 345.0 | 517.0 | 680.0 |
Determine the number of inventory turns and the days of supply for each year.
As the company has grown, does it appear that the company's supply chain performance has improved? Explain your answer.
If the company wants to improve its supply chain performance, what items should it focus on? Why?
10-6. Delph Manufacturing Company is going to purchase an auto parts component from one of two competing suppliers. Delph is going to base its decision, in part, on the supply chain performance of the two suppliers. The company has obtained the following data for average raw materials, work-in-process, and finished goods inventory value, as well as cost of goods sold for the suppliers.
Supplier 1 | Supplier 2 | |
|---|---|---|
Cost of goods sold | $8,360,000 | $14,800,000 |
Raw materials | 275,000 | 870,000 |
Work-in-process | 62,000 | 550,000 |
Finished goods | 33,000 | 180,000 |
Each company operates 52 weeks per year.
Determine which supplier has the best supply chain performance according to inventory turns and weeks of supply. What other factors would the company likely take into account in selecting a supplier?
10-7. Solve Problem 3-8 in Chapter 3 to construct a c-chart for monitoring invoice errors at Telcom Manufacturing Company.
10-8. Solve Problem 3-9 in Chapter 3 to construct a c-chart to monitor late order deliveries at the National Bread Company.
10-9. Solve Problem 3-10 in Chapter 3 to construct a p-chart to monitor order problems at BooksCDs.com
10-10. Solve Problem 3-11 in Chapter 3 to construct an x-chart in conjunction with an R-chart for order fulfillment lead time at Valtec Electronics.
10-11. Solve Problem 3-31 in Chapter 3 to construct an x-bar chart in conjunction with an R-chart for delivery time at the Great Outdoors Clothing Company.
Somerset Furniture Company's Global Supply Chain
The Somerset Furniture Company was founded in 1957 in Randolph County, Virginina. It traditionally has manufactured large, medium-priced, ornate residential home wood furniture such as bedroom cabinets and chests of draws, and dining and living room cabinets, tables, and chairs, at its primary manufacturing facility in Randolph County. It employed a marketing strategy of rapidly introducing new product lines every few years. Over time it developed a reputation for high-quality, affordable furniture for a growing U.S. market of homeowners during the last half of the twentieth century. The company was generally considered to be an innovator in furniture manufacturing processes and in applying QM principles to furniture manufacturing. However, in the mid-1990s, faced with increasing foreign competition, high labor rates, and diminishing profits, the Somerset Company contracted to outsource several of its furniture product lines to manufacturers in China, simultaneously reducing the size of its own domestic manufacturing facility and labor force. This initially proved to be very successful in reducing costs and increasing profits, and by 2000 Somerset had decided to close its entire manufacturing facility in the United States and outsource all of its manufacturing to suppliers in China. The company set up a global supply chain in which it arranges for shipments of wood from the United States and South America to manufacturing plants in China where the furniture products are produced by hand by Chinese laborers. The Chinese manufacturers are very good at copying the Somerset ornate furniture designs by hand without expensive machinery. The average labor rate for furniture manufacturing in the United States is between $9 and $20 per hour, whereas the average labor rate for furniture manufacturers in China is $2 per day. Finished furniture products are shipped by container ship from Hong Kong or Shanghai to Norfolk, Virginia, where the containers are then transported by truck to Somerset warehouses in Randolph County. Somerset supplies retail furniture stores from this location. All hardware is installed on the furniture at the retail stores in order to reduce the possibility of damage during transport.
The order processing and fulfillment system for Somerset includes a great deal of variability, as does all aspects of the company's global supply chain. The company processes orders weekly and biweekly. In the United States it takes between 12 and 25 days for the company to develop a purchase order and release it to their Chinese suppliers. This process includes developing a demand forecast, which may take from one to two weeks; converting the forecast to an order fulfillment schedule; and then developing a purchase order. Once the purchase order is processed overseas by the Chinese manufacturer, which may take 10 to 20 days depending on the number of changes made, the manufacturing process requires approximately 60 days. The foreign logistics process requires finished furniture items to be transported from the manufacturing plants to the Chinese ports, which can take up to several weeks depending on trucking availability and schedules. An additional 5 to 10 days is required to arrange for shipping containers and prepare the paperwork for shipping. However, shipments can then wait from one day to a week for enough available containers. There are often too few containers at the ports because large U.S. importers, like "Big W" discount stores in the United States, reserve all the available containers for their continual stream of overseas shipments. Once enough containers are secured, it requires from three to six days to optimally load the containers. The furniture pieces often have odd dimensions that result in partially filled containers. Since 9/11, random security checks of containers can delay shipment another one to three weeks, and smaller companies like Somerset are more likely to be extensively checked than larger shippers like Big W, who the port authorities don't want upset with delays. The trip overseas to Norfolk requires 28 days. Once in port, one to two weeks are required for a shipment to clear customs and to be loaded onto trucks for transport to Somerset's warehouse in Randolph County, which takes from one to three days. When a shipment arrives, it can take from one day up to a month to unload a trailer, depending on the urgency to fill store orders from the shipment.
Because of supply chain variability, shipments can be off schedule (i.e., delayed) by as much as 40%. The company prides itself on customer service and fears that late deliveries to its customers would harm its credibility and result in cancelled orders and lost customers. At the same time, keeping excess inventories on hand in its warehouses is very costly, and since Somerset redesigns its product lines so frequently a real problem of product obsolescence arises if products remain in inventory very long. Somerset has also been experiencing quality problems. The Chinese suppliers employ quality auditors who rotate among plants every few weeks to perform quality control tests and monitor the manufacturing process for several days before visiting another plant. However, store and individual customer complaints have forced Somerset to inspect virtually every piece of furniture it receives from overseas before forwarding it to stores. In some instances, customers have complained that tables and chairs creak noisily during use. Somerset subsequently discovered that the creaking was caused by humidity differences between the locations of the Chinese plants and the geographic areas in the United States where their furniture is sold. Replacement parts (like cabinet doors or table legs) are difficult to secure because the Chinese suppliers will only agree to provide replacement parts for the product lines currently in production. However, Somerset provides a one-year warranty on its furniture, which means that they often need parts for a product no longer being produced. Even when replacement parts were available, it took too long to get them from the supplier in order to provide timely customer service.
Although Somerset was initially successful at outsourcing its manufacturing process on a limited basis, it has since discovered, as many companies do, that outsourcing can result in a host of supply chain problems, as indicated. Discuss Somerset's global supply chain and possible remedies for its supply chain problems, including strategic and tactical changes that might improve the company's supply chain performance, reduce system variability, and improve quality and customer service.
Chopra, S. and P. Meindl. Supply Chain Management, 2nd ed. Upper Saddle River, N.J.: Prentice Hall, 2004.
Christopher, M. Logistics and Supply Chain Management, 2nd ed. Upper Saddle River, N.J.: Prentice Hall, 1998.
Dornier, P., R. Ernst, M. Fender and P. Kouvelis. Global Operations and Logistics. New York: John Wiley & Sons, 1998.
Schecter, D. and Gordon S. Delivering the Goods: The Art of Managing Your Supply Chain. New York: John Wiley & Sons, 2002.
[16] H. L. Lee, "Ultimate Enterprise Value Creation Using Demand-Based Management," Stanford Global Supply Chain Management Forum, http://www.stanford.edu/group/scforum/, September 2001.